July 26, 2026
By Stephen Stofka
For the past few weeks I have been writing about the political polarization of voters based on where they live. Last week I wrote that voting behavior depends on our prediction of how a particular candidate or party will affect our own well being or that of our family, our community. A choice is the result of a prediction. A vote is a choice. Those who vote for a Republican candidate are making different predictions than those who choose a Democratic candidate. To understand the polarization in this country, I want to understand the prediction process itself. How much information do we need to feel like we have enough knowledge to make a prediction? That depends on many things – the circumstances and the consequences of making a prediction.
The Pool of Possibilities
The future is an infinity of possibilities. We cannot gather enough information in the present to flawlessly predict the future. What do we do? Take a small sample of the present and trust that that small sample will reliably represent the future. But how do we decide the size of that sample? Some voters meticulously research candidates and issues before voting. Some people vote by the dominant political party that represents their interests and values. However, in states that allow citizen ballot issues, there may be no clear party line. Some voters rely on a media source to do the research and make recommendations.
Some cities were large enough to support two daily newspapers. The editorial board of one newspaper would present a conservative position on candidates and citizen initiatives. The other newspaper would present a liberal perspective on candidates and issues. Some people grew up learning only one perspective because their parents subscribed to that newspaper. People who moved to a city soon learned which of the two perspectives aligned with their personal values. The newspapers did the work of filtering all the information.
The Media Jungle
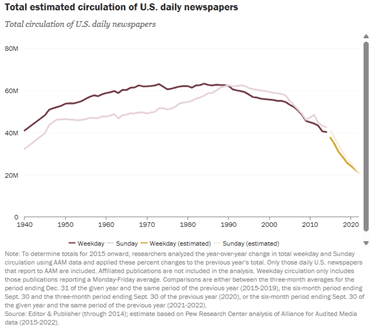
From 1970 to 1990, the circulation of daily newspapers peaked at over 60 million, almost the same number as the number of households in the country. By 2020, estimated circulation was about 25 million. Here’s a chart from Pew Research (Source).
In addition to local and national news, the newspaper had that day’s TV listings, the daily weather forecast, and the results of yesterday’s sports games. Readers checked their horoscope, read cartoons and played the games in the back pages of the newspaper.
Today, digital algorithms serve up news sources and content that engages a reader. We are like donkeys endlessly walking in circles, powering a flour mill as social media dangles a carrot to keep our attention. Like cute cats? Here’s more. Like hearing about Trump’s latest outrage? Here’s more. Before we show you that, here’s a commercial.
The General and the Particular
A President has a relatively small impact on the personal circumstances of most voters. People often vote based on their prediction of whether a particular candidate will be good or bad for the country as a whole, or an industry. Gallup conducts two separate polls for opinions on the general economy, the Economic Confidence Index, and people’s individual financial circumstances, the Personal Finance Survey.
The Economic Confidence Index plunged into negative numbers at the onset of the pandemic and was still negative on the eve of the 2020 election. Sentiments recovered somewhat shortly after Biden took office, then plunged again as inflation climbed to 9% in the summer of 2022. As inflation declined, those polled grew more optimistic. On the eve of the 2024 election, that index was still negative and voters elected Donald Trump, who promised to restore economic confidence. However, a few months after he took office, Trump initiated his “liberation day” tariffs. Public sentiment and the stock market both fell in response. While the stock market recovered, people’s confidence has not. Confidence in the economy is now lower than when Trump left office in January 2021 (Source).
What about people’s personal financial circumstances? In a poll conducted during the first quarter of this year, a third of those polled were “very worried” that they would not have enough money for retirement. Another third were “moderately worried.” Sixty percent of respondents were worried that they could not cover medical bills in case of a serious illness (Source).
Party Loyalty
Some people make voting easy. They vote for each candidate from one of the two dominant political parties. Researching the electoral platform and record of each candidate can be time consuming. Also, many voters do not pay a lot of attention to politics until a few months before an election, so this strategy is practical. Mike Rosen was a conservative radio talk show host in Denver until 2016. His experience working in Washington helped him understand that party politics drove the legislative machinery. Party cohesion, power and connections gets legislation passed. Party affiliation is more important that the merits of individual candidates. Because of that, he endorsed a voting strategy of “party over person.” Having to choose between two dominant parties makes prediction much easier. Each party constructs a brand from a platform of policies meant to strengthen attachment with current members and to attract newcomers.
Attachment
As social creatures, we instinctively seek attachment. Branding is a marketing strategy that promotes attachment between consumers and products or voters and political parties. The Republican Party brands itself as the party of low taxes and low regulations. It promotes larger military spending, which helps support local communities in the southern states where Republican support is strong. The Democratic Party stresses equality and fairness for all. They promote programs which assist lower income families in urban areas where housing and other monthly costs are relatively high. Both branding strategies rely on predictions of the future. Elect our candidates and the future will be better, each party says.
Religion
Religious conviction relies heavily on predictions of the future. The Christian religion evolved from its Jewish roots but stressed individual salvation in contrast to the Messianic culture of the Jewish people that predicted a group salvation. Religious and political affiliation manifests the human desire for attachment. It is understandable that one or both dominant parties would incorporate religious sentiments into their brand.
In the mid-19th century, the Democratic Party promoted expansion of the country into the western lands occupied by Indians and held by Mexico. Expansion of land was necessary for the expansion of slavery, a cornerstone concept championed by the party. The party justified expansion under the banner of Manifest Destiny, an idea that the U.S. had a divinely ordained mission to spread Christian and republican government throughout the continent (Source).
In the past several decades, the Republican Party has absorbed a diverse group of Christian conservatives and evangelicals into the fold. The party has endorsed policies that outlaw abortion and same sex marriages, supported exemption from laws that conflict with one’s religious beliefs, and the rights of religious schools.
Postdiction
The past, particularly the ancient past, is almost as hidden from us as the future. We sample our present circumstances and often invent origin stories to explain the present. We speculate on the creation and composition of the cosmos, the formation of our world, the Earth, and how what is came to be. These speculations are like predictions but they come after the fact. Perhaps we should call them postdictions.
Organized religions promote an attachment to certain origin stories, claiming a divine authority and imprimatur on the opinions, values and interests of that religion’s congregation of believers. There are many religions and religious sects but only two political parties to absorb those congregations.
History
We are a politically divided country because the framers of the Constitution glued two different countries and cultures, north and south, together. Historians note the many dichotomies and contradictions of those founding documents. Thomas Jefferson penned the words “all men are created equal” in the Declaration of Independence, but owned 200 slaves. Article IV, Section 2, Clause 3 of the Constitution itself contained a fugitive slave clause, recognizing and treating human beings as property like domesticated animals (Source). That same declaration grounded government in “the consent of the governed,” but excluded women, blacks, Indians and poor white men.
Although the founders valued liberty and private property, many states allowed the imprisonment of debtors. Governments protected creditor rights above the property rights of farmers. Creditors were usually from urban areas. Debtors, mostly farmers, were from rural areas. From the beginnings of our country, there was a propensity for voters to sort themselves into two interest groups, rural and urban. Because we have a “winner-take-all” election system, this naturally leads to the formation of two political parties. A proportional representation system of elections gives formal recognition to marginalized communities. In our country, minority interests must work within either the Republican or Democratic parties.
Errors
Our actions today represent our predictions of the future, but our predictions aren’t always accurate. How do we cope with the errors of our conclusions? That’s something I want to take a look at next week, and I hope to see you then.
//////////////////
Photo by Maria Lupan on Unsplash