Each month the Institute of Supply Management surveys several hundred firms in both the non-manufacturing and manufacturing sectors of the economy and compiles an index based on the survey responses to questions regarding both current and near future conditions.
The overall index is widely published each month but a closer inspection of the components reveals developing strengths and weaknesses in the economy. The two component indexes I will look at are New Orders and Employment.
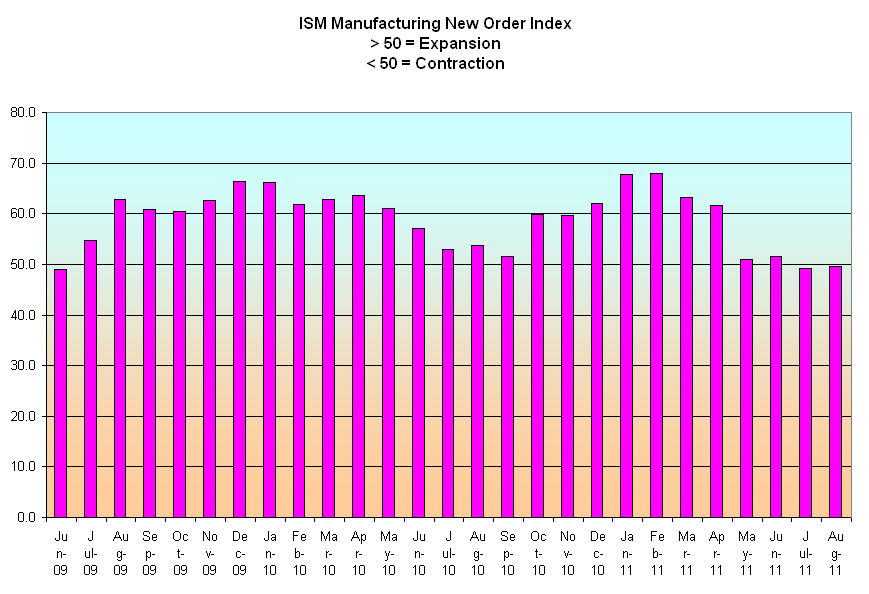
Manufacturing is only about 10% of the overall economy but it is a leading indicator of the underlying health of the overall economy. The recession officially ended in June 2009 and as the chart below shows new orders for goods started growing.
With new orders growing, manufacturers began hiring – the Employment index started increasing from a sick level of 40.
There were two key causes for this improvement: The weakening dollar made manufactured goods attractively valued for businesses and consumers in other countries, thereby boosting our exports. The auto bailouts and “Cash for Clunkers” program that were part of the stiumulus program initiated in the spring of 2009 helped revive the mortally wounded car manufacturers.
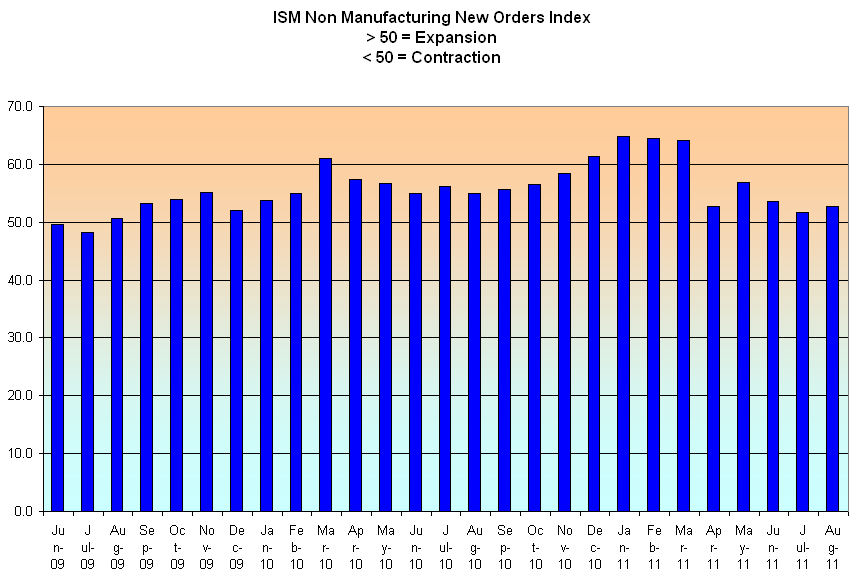
New orders in the non-manufacturing or services sector, the largest part of our economy, also started growing, but not as rapidly.
A large part of the construction trade is included in this sector. The lack of new housing starts – about half what it was just five years ago – has crippled this industry, serving as a dead weight on the sector as a whole. The non-manufacturing employment index lagged behind, not reaching a state of expansion till late summer of 2010.
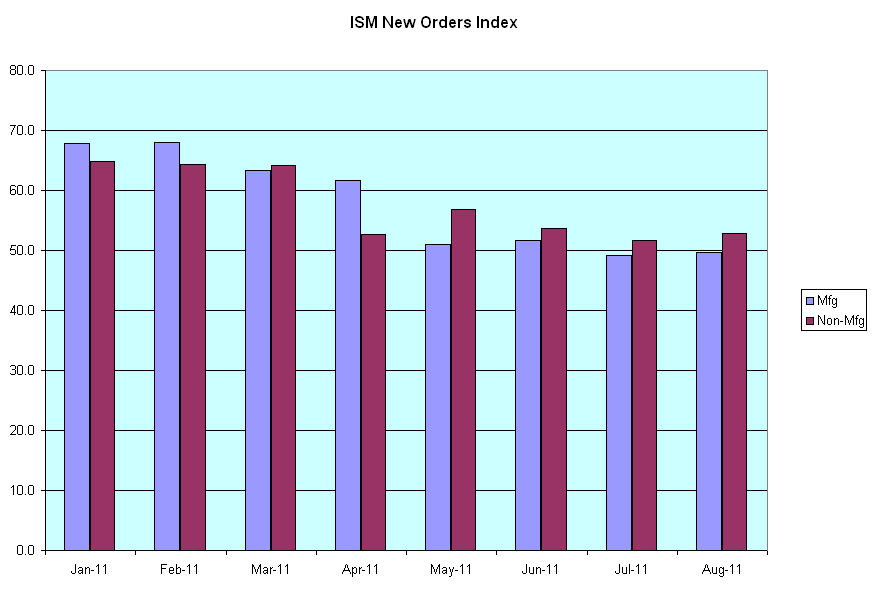
Since the beginning of this year, new orders in both sectors have declined.
The Japanese earthquake and tsunami in March of this year was blamed for the slowdown in manufacturing. In June of this year, Japan appeared to have overcome much of the damage that the tsunami had done to their supply chain, leading economists and stock traders to predict a stronger second half of this year for the U.S. However, the manufacturing new orders index has edged into contraction territory, hardly a sign of increased demand.
As the growth in new orders approaches the midway mark between contraction and expansion, so too does the employment index. In both the manufacturing and service sectors of the economy, growth is minimal, leading some to predict and many to worry about a “double dip” recession.
Unemployment remains stubbornly high as demand softens. The various stimulus programs by the Federal Reserve and the Obama and Bush administrations have had some effect but have not produced the robust recovery hoped for because this is the mother of all deleveraging recessions when both consumers and businesses pay down or restructure their debt and asset prices (housing prices) decline. In the past decades, we accumulated debt the way a house accumulates water when flooded during heavy rains. The Fed and both presidential administrations have been pumping hard to keep the floodwaters from causing even more damage. What do they get for their efforts? Some blame the pumpers for causing the flood.