Presidential Predictabilities

March 27, 2022

by Stephen Stofka

The 2024 presidential election is still far away but a 75 year political trend is surprisingly predictive of election results. Add in one economic indicator and the results are even more predictable. An incumbent president won re-election 8 out of 12 times, or 67%. Those who lost failed to jump the hurdle of unemployment. When there is not an incumbent president, voters have changed parties in 6 out of 7 elections. America spends billions of dollars on election campaigning but voters have busy lives full of many choices. As with many decisions, we follow a few simple guidelines. Here’s a guide to winning the next election.  

American voters like change but they usually play fair. When the annual (year-over-year) change in unemployment is falling (UNRATE note below), incumbent presidents are assured of a second term. I’ll refer to that change as ΔU. If that change is falling, then employment is improving and voters don’t kick someone out of office. Let’s look at some recent history to understand the trend and those few times when political issues overshadowed economic trends. At the end of this article is an earlier history for Boomers and political history buffs.

In 1992, the ΔU did not favor incumbent Republican President H.W. Bush in the long stuttering recovery after the 1990 recession. In the 18 months after the end of the first Gulf War ended in early 1991, his approval numbers sank from very high levels. A third party candidate Independent Ross Perot focused on economic issues and diverted a lot of moderate and conservative votes away from Bush, helping to put Democratic candidate Bill Clinton in the White House with only 43% of the popular vote. Unemployment numbers favored Clinton in his 1996 re-election bid and voters awarded him a second term.

By 2000, the great internet bull market was wheezing. Unemployment was rising and did not favor Democratic VP Al Gore as he sought to succeed Clinton. A few hundred votes in Florida separated Gore and his opponent, former Texas Governor George Bush. A partisan Supreme Court made a radical decision to overrule the Florida Supreme Court and award the election to Bush, switching party choice yet again. If the employment numbers had been more favorable to Gore, voters might have been inclined to keep him at the tiller.

Bush’s approval soared after the 9-11 attack but controversy erupted when he decided to attack Iraqi leader Saddam Hussein on the pretext that the country had weapons of mass destruction. When no weapons were found, his ratings sank. The economy had stumbled after the short recession of 2001 but tax cuts in 2003 helped employment numbers recover. Bush avoided the fate of his father and won re-election.

As the housing crisis grew in the spring of 2008, the unemployment numbers turned ugly. Again voters changed parties and elected the Democratic candidate Barack Obama. Despite Obama’s unpopularity over health care reform, the unemployment numbers helped Obama to a second term over challenger Mitt Romney. After two terms of a Democratic president and knowing voters like change, a gambler would put their money on a Republican candidate in the 2016 election. The employment numbers favored the Democratic candidate Hillary Clinton, who won the popular vote. A few thousand votes in key states turned the tide in Donald Trump’s favor. Again, we learned the lesson that employment numbers assure victory for an incumbent president but not the incumbent political party.

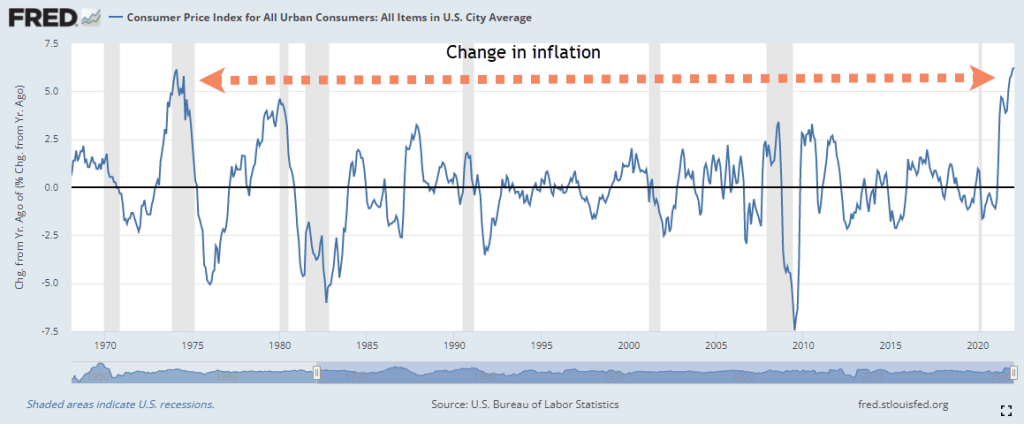
In 2020, the pandemic drove the change in unemployment to stratospheric levels, rising 9.3% from 2019 levels. Both parties responded with legislation to stem the shock and economic pain to American households. Despite those historically unfavorable unemployment numbers, Trump increased the Republican vote count but could not overcome a larger surge in Democratic votes. The unemployment numbers in the quarters before the pandemic favored Trump. Had the pandemic not struck, it is likely that he would have won re-election.

Memo to incumbent presidents: If unemployment is rising you won’t win re-election.

Given that history, an incumbent Party should enact fiscal policy that keeps or lowers unemployment in an election year. An opposition party should try to block any such legislation. After the 2008 election, the country was suffering the worst recession since the Great Depression and Senate Minority Leader Mitch McConnell said that his goal was to make newly elected Democratic candidate Barack Obama a one-term president. McConnell was vilified for his partisan remark during a time of crisis but he stated the political reality that elections are a zero sum game. At the time of the August 2011 budget crisis between Republicans and the White House, the ΔU was a solid ½% negative. Falling unemployment hurts the election chances of the opposition party. The realities of democratic elections are uglier than many voters can stomach but we are carried along on those currents.

If unemployment is rising toward the end of 2023, look for Democrats to enact fiscal spending that will put people to work. To improve their own chances, watch for Republican strategies that will block any such measures.

////////////

Photo by Gene Devine on Unsplash

UNRATE Note: Unemployment is the headline number, averaged over each quarter. The year-over-year change is taken in the 2nd quarter of an election year (April – June) before each political party conducts its convention to choose their candidate.

/////////////

For interested Boomers and history buffs:

Near the end of WW2, 4-term Democratic President Roosevelt died and his VP Harry Truman assumed the Presidency. In 1948, the unemployment numbers looked grim as the economy tried to absorb millions of soldiers returning from war. Pre-election polls had favored Truman’s opponent, Thomas Dewey, and one newspaper printed out a headline on election night that Dewey had won but that announcement was premature. Truman’s victory is the only time an incumbent has won re-election when unemployment numbers were unfavorable. When the final results were announced, Truman famously pointed to the newspaper’s false headline. Perhaps that is the first time when a politician called out “fake news.”

In the spring of 1952, incumbent Democrat President Truman’s ratings were falling. The ΔU was neutral but the trend was against Truman. When he lost the New Hampshire primary to another Democratic candidate, he retired to his home in Missouri. Republican Dwight Eisenhower won the election. In 1956, the unemployment numbers favored “Ike” and voters gave him another term. In 1960, the ΔU had turned against Ike’s aspiring successor, VP Richard Nixon. Voters switched parties, choosing JFK, a Democrat, in a close and contentious election.

After Kennedy’s assassination in 1963, the unemployment numbers were strongly in favor of President and former VP Lyndon Johnson, who rode the wave of favorable sentiment to the White House. In the spring of 1968, the ΔU still favored Johnson but voter sentiment was more focused on the Vietnam War and Johnson decided not to run for re-election just as Truman had chosen 16 years earlier. Richard Nixon’s political fortunes resurrected on his promise to end the war with dignity and voters changed parties.

In 1972, unemployment favored Nixon who regained the White House, only to leave a few years later to avoid impeachment and ejection from office. In 1976, unemployment numbers looked good for Gerald Ford, who had assumed the presidency. However, he could not overcome voter hostility after he pardoned Nixon for the crimes revealed during the Watergate hearings. Incumbency and favorable employment numbers are powerful persuaders but there are a few times when voters concentrate on political matters more than economic considerations.  

Jimmy Carter, a Democrat, took the White House but couldn’t keep it as both unemployment and inflation were rising in 1980. Republican winner Ronald Reagan had often asked “Are you better off today than you were four years ago?” In 1984, unemployment was still high but falling by 2.7% and Reagan won in a landslide. 1988 is the only election in which the voters did not change parties after two terms. Unemployment was falling and voters turned to VP H.W. Bush for his turn in the top job. Unemployment is a decisive factor in re-electing an incumbent but not enough to overcome the American inclination to political change every decade.

The history continues in the main part of the article.

The Change of the Change

March 20, 2022

by Stephen Stofka

Why do unexpected price changes bother us so much? Prices reflect two forces central to our lives – time and utility. Both are common measures yet each is uniquely experienced. The price of our utility – what we need and enjoy – and the price of our time is deeply personal. Price surprises upset a finely balanced mechanism inside each of us. We can adapt to a one-time price change. We struggle to make sense of repeated and erratic price changes.

A proverb in the tool business is that customers don’t want a ¼” drill bit – they want a ¼” hole. The price of goods we buy is the price of the experience we get when we consume a good. We don’t want an ice cream – we want the pleasure of eating ice cream. The cost of ice cream is the price of our time enjoying it.

Interest is the price of money’s time the way that wages are the price of our time. Einstein once quipped that interest was the most powerful force in the universe. We compliment ourselves when we enjoy an unexpected bonus return on our savings. We are outraged when the power of interest works against us. A credit card debt or student loan debt may grow even though we are making regular payments.

The price of money’s time and the price of our time are like two riders on a seesaw who seek an approximate level. For two decades the Federal Reserve has sat on the interest rate side of the seesaw to keep them close to the ground. In response, the prices of consumption assets (houses) and productive assets (stocks) have risen high. What about the price of consumption goods?

Inflation measures changes in the price of consumption goods the way that our car’s speedometer – the mileage indicator – measures our change in position on the road. We adapt to constant speed or inflation. What we notice then are the changes in speed or inflation – the acceleration. After a decade of low inflation, the pandemic was like approaching a highway junction and coming to a near stop before having to accelerate onto another highway. In mid-2021, the sudden acceleration of price changes seemed normal, a catching up after the economic lockdowns of 2020. The acceleration has continued for months now, as though the gas pedal got stuck. Using the FRED data tool at the Federal Reserve, I have charted the price acceleration – the change of inflation.

Today’s price acceleration is as high as that of the deep recession in 1973-74. Two shocks – one of them short term, one long term – produced a singular phenomenon economists called stagflation. The short term shocks were two oil crises in 1974 and 1979 that decreased world oil production (Gross, 2019). The long term shock was the large influx of the Boomer generation into the labor force, doubling the 1% average growth of the labor force. Forty years ago, the Boomers were in their late 20s and early 30s – at that age when we have increasing incomes and material needs. Lopsided demographics and supply shocks combined to produce erratic price changes.

To bring price acceleration under control in 1979 Fed Chair Paul Volker kept raising interest rates (FEDFUNDS) to keep them above the inflation rate. Interest rates acted as a cap on price changes. Once these two forces balanced, the change in inflation decreased but there was a cost. At that time, small businesses paid 20% interest for unsecured short term loans to cover payroll and accounts receivable. The change in interest rates was swift enough and large enough to drive the economy into recession. Until the 2008-9 financial crisis, the 1981-82 recession was the worst since the Great Depression of the 1930s.

This week, Fed Chair Jerome Powell announced a series of small and steady interest rate hikes with a target that is far below the interest rates of four decades ago when a 10% mortgage rate was a bargain. The demographics are different today. Because the labor force is barely growing structural price pressures should weaken. The large Boomer generation is aging and old people don’t buy as much stuff. The Fed can let the interest rate side of the seesaw rise up a bit and hope that inflation will lower in response. Instead of having to cap price changes as they did four decades ago, they can work to a negotiation between these two price forces.

////////////

Photo by Miles Loewen on Unsplash

Gross, S. (2019, March 5). What Iran’s 1979 revolution meant for US and Global Oil Markets. Brookings. Retrieved March 18, 2022, from https://www.brookings.edu/blog/order-from-chaos/2019/03/05/what-irans-1979-revolution-meant-for-us-and-global-oil-markets/

Price Connections

March 13, 2022

by Stephen Stofka

As I was waiting for the car to drink its fill at the gas station, I got to thinking about prices. Their role is to convey information about resource availability but prices are not a conversant sort. They grunt monosyllabic phrases, relaying only the information that something has changed. A person who paid not the slightest attention to the news would wonder what happened when they filled up their car.

When prices decrease, do we buy more of a good or service? Sometimes. We usually pay attention to prices when they increase. In response, we substitute a cheaper good if we can, smoothing out the price changes. Most of us don’t drive more when gas prices decrease. Annual miles driven per adult have fallen as the large Boomer generation has aged (FRED Series TRFVOLUSM227NFWA/CNP16OV). The oldest of the Boomers passed 55 in the mid-2000s when per capita miles peaked.

Prices may not change as quickly as global conditions. When there is a poor coffee harvest in Brazil, the price of coffee in the grocery store may take several months to respond. Not so with gasoline, a global commodity so vital to the global economic engine that gas prices respond quickly to geopolitical events.

Many countries subsidize or control the price of some goods but too much control and prices no longer relay information between producers and consumers. The U.S. government subsidizes the farmers who grow corn to make the ethanol blended into gasoline. It subsidizes dairy, peanut and cotton farmers. Countries with state owned industries may keep a lid on prices to gain and keep political power. This year Kazakhstan lifted price caps on liquified petroleum gas which most people use to fuel their vehicles. Thousands of citizens protested (Neuman, 2022). In 18th century France, people rioted over the price of bread. Gasoline is today’s bread.

The ancient Greek philosopher Protagoras said that man was the measure of all things. In past centuries, essential food commodities that kept people alive were a yardstick of value. Anyone who has to drive to work or drives for a living feels that way about the price of gasoline. Larger firms that depend on predictable prices use the futures market to smooth gas prices but an independent Uber driver bears the full impact of rising gas prices. Should the U.S. subsidize gas prices for those who depend on the fuel? Those policies, politically popular in countries like Venezuela and Kazakhstan, foster political corruption and weaken the economic system. Why? One group of taxpayers subsidizes another group of taxpayers. The price of gasoline is closely linked with the price of power.

Competitive pricing is a hallmark of capitalism but such pricing minimizes profits. Large companies prefer to set a price which maximizes their profits within a competitive environment where other large firms use the same strategy. The result is an entire aisle in a grocery store filled with breakfast cereals that are priced at 10 times their cost. With the milk subsidies, the cereal becomes more affordable. Developed countries have learned to tame the prices of essential items without keeping those prices in a cage. We want our prices to communicate essential resource allocation information but we want well-behaved prices.

In our modern global economy we have many more goods and services available to us. Multiple sources of food products help lower prices but we are subject to the geopolitical risks of a global economy. The Covid pandemic and the war in Ukraine has reminded us that risks accompany benefits. The Russian people are beginning to experience the isolation of being cut off from the international system of trade, money and assets. Like prices, it is better when we are connected to each other.

////////////

Photo by Clint Adair on Unsplash

Neuman, S. (2022, January 8). There’s chaos in Kazakhstan. here’s what you need to know. NPR. Retrieved March 12, 2022, from https://www.npr.org/2022/01/08/1071198056/theres-chaos-in-kazakhstan-heres-what-you-need-to-know

The Fruits of Labor

March 6, 2022

by Stephen Stofka

In trips to the grocery store and gas station, many of us develop an inflation calculator that we trust because it tracks price changes in the unique basket of goods that we buy. If the price of mushrooms doubles, we only care if we buy mushrooms. Economists have the difficult task of computing the price changes of a common set of goods. They spend an extraordinary amount of time and expense surveying people in cities throughout the U.S. to construct a representative sample of the goods we buy (BLS, 2021). The price weighting that economists use to measure inflation differs from our instinctive approach. We assign weighting by the frequency we do something. What catches our attention gets more weight in our consumption basket.

Our sense of inflation can be guided by the price of gasoline when we fill up each week, but it is only 4% of the CPI measure of inflation (BLS, 2022). Many of us underweight the cost of housing that we provide to ourselves. Wait, what? In January, economists at the Bureau of Labor Statistics computed a 4% increase in housing costs even for those who owned their home outright. They call this Owners’ Equivalent Rent (OER) and it makes up a whopping 25% of the calculation of inflation. In the BLS methodology, homeowners are both landlords and renters. Actual rental increases made up only 7% of the index but the BLS uses those rent increases to compute the market price of what a homeowner could rent out their home for each month. For a homeowner, that 4% increase in housing costs is actually a 4% saving. Even better, homeowners do not pay income taxes on that imputed income.

Like gasoline, we overweight the effect of grocery prices because we frequently shop. If we enjoy a sirloin steak once a week, we notice when it increases in price from less than $10 to $13 a pound (FRED series APU0400703613). In the years after the financial crisis many households ate more ground beef. Prices doubled in response to the increased demand (APU000070312). Ground beef is what economists call a Giffen good. Unlike normal goods, we buy more of a Giffen good when our income goes down.

Many of us measure inflation by comparing the prices we pay to the wages we receive. Workers have gained little in the past two decades, eking out an extra 8% in real earnings over that time. All of that gain has come in the past eight years. Workers should expect to share in the productivity increases of the past two decades.

An assumption of neoclassical economics is that workers’ wages reflect their marginal productivity. A BLS analysis (Sprague, 2014) of labor productivity showed an average gain of 2.2% in real output per hour from 2000-2013, yet workers’ real earnings declined slightly. In the past eight years, annual productivity gains have averaged about 1%, slightly below the annual 1.2% increase in real wages. Why have workers been able to command wages appropriate to their productivity in the past eight years but not in the 14 years prior? The problem began before the financial crisis when productivity rose 2.7% per year and real wage growth actually declined. The 2000s came after a period of reversal for the owners of capital. During the 1990s, much money was lost in the pursuit of profits promised by the developing internet. Owners and management recaptured those losses by keeping the productivity gains to themselves during the 2000s. Workers may not be able to regain those lost wages but at least they are securing the fruits of their labor.

/////////////

Photo by Timotheus Fröbel on Unsplash

BLS. (2021, December 9). Consumer price index frequently asked questions. U.S. Bureau of Labor Statistics. Retrieved March 5, 2022, from https://www.bls.gov/cpi/questions-and-answers.htm

BLS. (2022, February 10). Table 1. Consumer price index for all urban consumers (CPI-U): U. S. city average, by Expenditure Category – 2022 M01 results. U.S. Bureau of Labor Statistics. Retrieved March 5, 2022, from https://www.bls.gov/news.release/cpi.t01.htm

Sprague, S. (2014, May). Definition, concepts, and uses. U.S. Bureau of Labor Statistics. Retrieved March 5, 2022, from https://www.bls.gov/opub/btn/volume-3/what-can-labor-productivity-tell-us-about-the-us-economy.htm