Did your head just explode? That’s how the tax code appears to many of us. This spring, many taxpayers sat down with their tax accountants and were informed that they were among the losers created by the tax reform act that went into effect for the 2018 tax year. Among the losers were employees who claim business expenses. In the western states, many in the construction trades may take a temporary job that is located a few hours from home. Instead of driving home every day, they share hotel rooms or live in campers during the work week and travel home on weekends to be with their family. Some employers pay per-diem expenses, but many smaller employers don’t. Under the old tax laws, an employee could deduct meals, lodging and ordinary living expenses away from home. Under the new law, employee business expenses are subject to a threshold that equals 2% of gross income (Note #1).
An employee with business expenses who has a family of four
has discovered that they are the losers this tax filing season, the first one
under the new tax law. Under the old law, that family of four used to get $12K
standard deduction and $16K in personal exemptions. Now they get a $24K standard
deduction and no personal exemption (Note #2). If they have employee business
expenses that meet the threshold test, it may not be enough to exceed the new
higher standard deduction. Some tax accountants report that their clients are
shocked when they learn how much they owe in this first tax year under the new
law.
In the future, some workers may be able to negotiate higher
pay on these away jobs. Some will have to turn down such jobs.
Corporate America was a big winner in the tax reform bill. In
addition to lowered tax rates, low interest rates during the past decade have helped
many publicly held companies buy back their own stock. The stock buybacks have
accelerated this past year, with a record 25% of companies in the SP500 buying
back their own stock, according to a Wall St. Journal analysis published this
week.
Don’t companies have a better use for the money? Apparently
not. When companies buy back stock, they reduce the number of shares
outstanding and increase the profit per share reported. In the first quarter of
2019, these buybacks lifted per-share profits by 4%. The share buybacks have
distracted investors from the fact that corporate profits have flatlined since
2012.
Corporate profits flatlined during the Reagan administration
in the 1980s. Investors bid up stocks on the promise that trickle-down policies
and tax reform would break the cycle. Before profits did start to rise again, stock
prices shook off their speculative pricing on Black Monday in October 1987.
Let’s hope we don’t have a similar phenomenon this time.
We are living in an economy that is fundamentally different than the ones our parents and grandparents grew up in. Some of us want a return to those days. More goods were made in the U.S.A. Each family spent more on food, clothing, furniture and the other necessities of life but the money circulated in our economy, not among the workers of Asia. Union membership was stronger but there were crippling strikes that affected the daily lives of many families. In 2016, the current President promised a return to those days of stronger but more erratic growth. Almost half of voters bet on him to undo the changes of the past several decades. Let’s look at some data that forms the bedrock of consumer confidence.
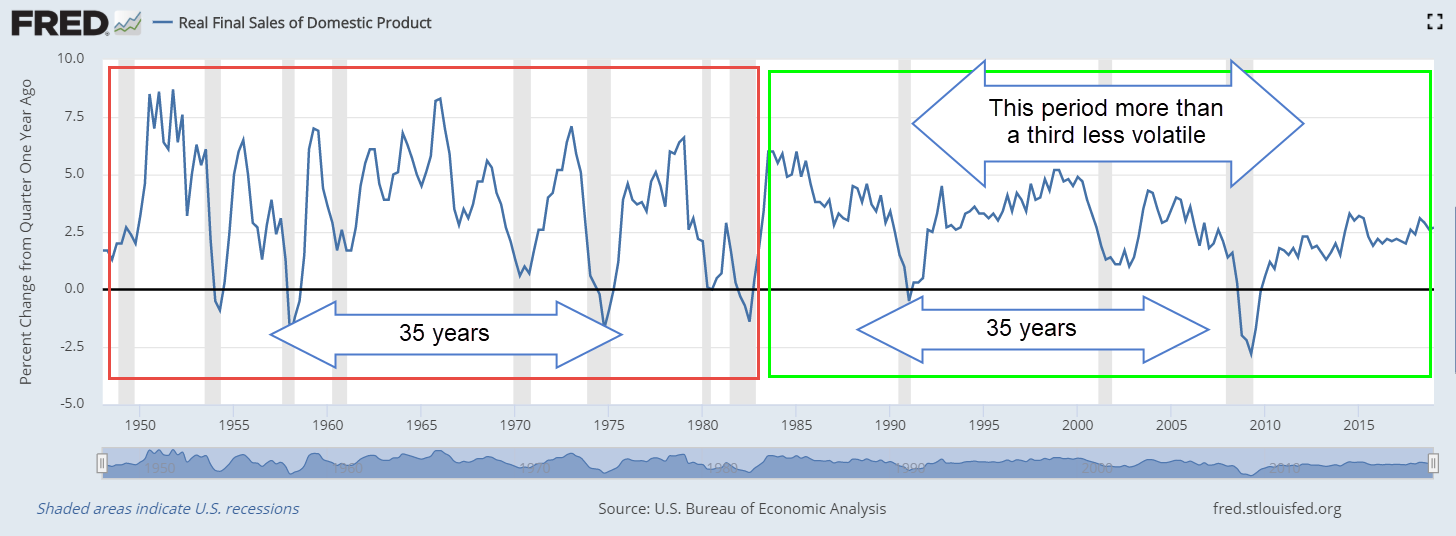
GDP is the most frequently used measure of the nation’s
economic activity. Another measure, Final Sales of Domestic Product excludes
changes in business inventories. In the graph below is a chart of the annual
change in Final Sales after adjusting for inflation (Note #1). Compare the
right and left rectangles. The economy of post-WW2 America was more erratic
than the economy of the past thirty-five years (Note #2).
The two paces of growth
In the first 35 years following WW2, growth averaged 3.6%.
Since the Financial Crisis there have only been five quarters with growth above
3%. Let’s include the annual change in disposable personal income (Note #3).
That’s our income after taxes. Much of the time, the two series move in
lockstep and the volatility in each series is similar.
However, sometimes the change in personal income holds steady while the larger economy drops into recession. A moderate recession in 1970 is a good example of this pattern.
1982 was the worst recession since the 1930s Great
Depression. Unemployment soared to more than 10% but personal incomes remained
relatively steady during the downturn.
In the 1990, 2000 and 2008 recessions, personal incomes did
not fall as much as the larger economy. Here’s the 2008 recession. While the
economy declined almost 3%, personal income growth barely dipped below zero.
In the last 35 years, annual growth in Final Sales has
averaged only 2.8%, far below the 3.6% average of the first 35-year period.
After the recession, the growth of the larger economy stabilized but the change
in personal incomes became very erratic. In the past eight years, income growth
has been 2.5 times more volatile than economic growth (Note #4). Usually the
two series have similar volatility. In the space of one year – 2013 – income
growth fell from 5% to -2.5%, a spread of 7.5%. In the past sixty years, only
the oil crisis and recession of 1974 had a greater swing in income growth
during a year! (Note #5)
When income growth is erratic, people grow cautious about starting new businesses. Banks are reluctant to lend. Despite the rise in home prices in many cities, home equity loans – a popular source of start-up capital for small businesses – are about half of what they were at the end of the financial crisis (Note #6). The Census Bureau tracks several data series for new business applications. One of these tracks business start-ups which are planning to become job creators and pay wages. That number has been flat after falling during the Great Recession (Note #7).
Census Bureau – see Link in Notes
Businesses borrow to increase their capacity to meet
expected demand. Since the beginning of 2016, banks have reported lackluster
demand for loans from large and medium businesses as well as small firms (Note
#8). For a few quarters in 2018, small firms showed stronger loan demand but
that has turned negative this year. This indicates that business owners are not
betting on growth. Here’s a survey of bank loan officers who report strong
demand for loans from mid-size and larger firms. While few economists predicted
the last two recessions, the lack of demand for business loans forecast the
coming downturns.
There is an upside to slow growth – less chance of a recession. Periods of strong growth promote excess investment into one sector of the economy. In the early 2000s, the economy took several years to recover from the money poured into the internet sector. The Great Financial Crisis of 2008 and the recession of 2007-2009 was a reaction to over-investment and lax underwriting in the housing sector. On the other hand, weak growth can leave our economy vulnerable to a shock like the heightening of the trade war with China, or a military conflict with Iran.
Can a President, a party or the Federal Reserve undo several
decades of slow to moderate growth? None of us want a return to the crippling
inflation of the 1970s and early 1980s, but we may long for certain aspects of
those yesteryears. An older gentleman from North Carolina called into C-Span’s
Washington Journal and lamented the shuttering of the furniture and textile
plants in that area many decades ago (Note #9). Many of those areas have still
not recovered. Another caller commented that the Democratic Party long ago stopped
caring about the jobs of rural folks in the south. Contrast those sentiments about
the lack of opportunity in rural America with those who live in crowded urban
corridors and struggle to keep up with the feverish pace and high costs of
urban housing, insurance and other necessities.
Two different realities but a similar human struggle.
/////////////////
Notes:
Real Final Sales of Domestic Product FRED series A190RO1Q156NBEA
Standard Deviation of first 35 years was 2.44. In the second 35-year period it was only 1.56.
Real Disposable Personal Income FRED series DPIC96
Since 2010, the standard deviation of economic growth has been .7 vs 1.75 for income growth.
In the decade following WW2, people had similar large swings in income growth as the country and the Federal Reserve adjusted to an economy dominated by domestic consumption.
Home Equity Loans FRED series RHEACBW027SBOG totaled $610 billion in the spring of 2009. It was $341 billion in the spring of 2019, ten years later
I spent the past week traveling with my sister to a family reunion near Dallas, Texas. In our travels, we passed through rural counties in southeast Colorado, western Oklahoma, and northwest and central Texas. In contrast to the signs of a brisk economy in the larger cities, some rural communities show signs of stress. Some roads leading off the main route need repair; some houses could use a fresh coat of paint; some stores have delayed maintenance. In some small towns most of the stores remain boarded up ten years after the financial crisis.
Candidates for the 2020 Presidential election must speak to
the two Americas. The Americans who produce the food we eat and the power that
lights our businesses and homes are not doing as well as those in the urban
corridors. Young people in rural America leave for the larger cities to find a
job or pursue an education. Older people with medical needs must move to larger
cities with hospital facilities available in an emergency.
Let’s turn to a proposal on the list of issues for the 2020 election – an increase in the Federal minimum wage. A person making a minimum wage of $15 an hour in Los Angeles earns a bit more than half of L.A.’s median household income (MHI). She may work 2-1/2 weeks to pay the rent on a one-bedroom apartment (Note #1). The MHI in rural America is about 20% less than the national average. In Limon, Colorado (population less than 1500), the MHI is about half of the national average (Note #2). $15 an hour in Limon is the MHI.
In 2009 and 2010, the Democrats controlled the Presidency, the
House and had a filibuster proof majority in the Senate. They could have enacted
a federal minimum wage that was indexed to the living costs in each county or
state. Why didn’t they fix the problem then? Because Democrats use the minimum
wage as an issue to help win elections. If Congress passes a minimum wage of
$15 an hour this year, they will have something new to run on in five years – a
raise in the minimum wage to $17 an hour. Voters must begin asking their
elected representatives for practical and flexible solutions, not political
banners like a federal mandated one-size-fits-all $15 minimum wage.
For decades after World War 2, Democratic Party politicians
who controlled the House refused to allow legislation that would index tax
rates to inflation. This resulted in “bracket creep” where cost of
living wage increases put working people in higher tax brackets automatically
(Note #3). The problem became acute during the high inflation decade of the
1970s and the issue helped Ronald Reagan take the White House on a promise to
fix the problem.
A week ago, I heard a Democratic Senator running for President say that they knew all along that Obamacare was just a start. The program was poorly drafted and poorly implemented and now we learn that Democrats knew all along that it was bad legislation? Will Medicare For All also be built on poor foundations and require a constant stream of legislative and agency fixes? This provides a lot of work for the folks in Washington who draft a lot of agency rules that require a lot of administrative cost to implement. Democrats are fond of federal solutions but show little expertise in managing the inevitable bloated bureaucracy that such solutions entail.
Some Democratic Party candidates are promising to fix the harsh
sentencing guidelines that they themselves passed in the 1990s, which fixed sentencing
guidelines enacted 25 years earlier by Democratic politicians in the 1960s and
1970s. This party’s platform consists of fixing its earlier mistakes.
According to a Washington Post analysis of election issues
(Note #4), some candidates are concerned about corporate power. A Democratic
president would have to work with the Senate’s Democratic Leader Chuck Schumer
whose main support comes from large financial corporations based in his home
state, New York. While a President Elizabeth Warren might propose regulatory
curbs on corporate power, Mr. Schumer would be gathering campaign donations
from the large banks who needed protection from those same regulations.
Large scale industrial power production has a significant effect on the climate. The few blue states that supported a Democratic candidate for President in the 2016 election also consume most of the final product of that power production. Have any candidates proposed solutions that lower the demand for power? Temperature control systems in commercial buildings could be set to a few degrees warmer in the summer and a few degrees cooler in the winter. That would have a significant impact on carbon production. Some candidates propose solutions that regulate the production and supply of power – not the demand for power. Most of that production occurs in states that supported a Republican candidate in the 2016 election. Proposals to install wind and wave generating stations in Democratic leaning coastal states in the northeast and northwest have been met with local resistance. Voters in the blue states want green solutions to be implemented in the red states, but not inconvenience residents of the blue states. Voters in the red states see through that hypocrisy.
A viable Democratic candidate must convince independent voters who are wary of political solutions from either party. Donald Trump won the Presidency without visiting rural folks on their home turf. He landed his plane near a staged rally and the folks came from miles around to hear him. Compare that approach with former Republican candidate Rick Santorum who visited many small towns in Iowa in the months before the 2012 Iowa primary. In small restaurants and rural post offices, Santorum listened to the concerns of voters. Trump’s approach was successful. Santorum was not. Go figure.
Trump convinced rural folks that he was going to go to Washington and drain the swamp. This in turn would help the economy in small town America so that those folks could get themselves a new roof, or a new pickup truck, fix the fence or get a few potholes patched. From what I saw, those folks are still waiting. Some rural folks may run out of patience with Trump by next year. The success of any Democratic candidate depends on that.
//////////////////////
Notes:
One week’s take home pay of $550 x 2.5 weeks = $1375. A 1 BR in L.A. averages $1350 L.A. Curbed
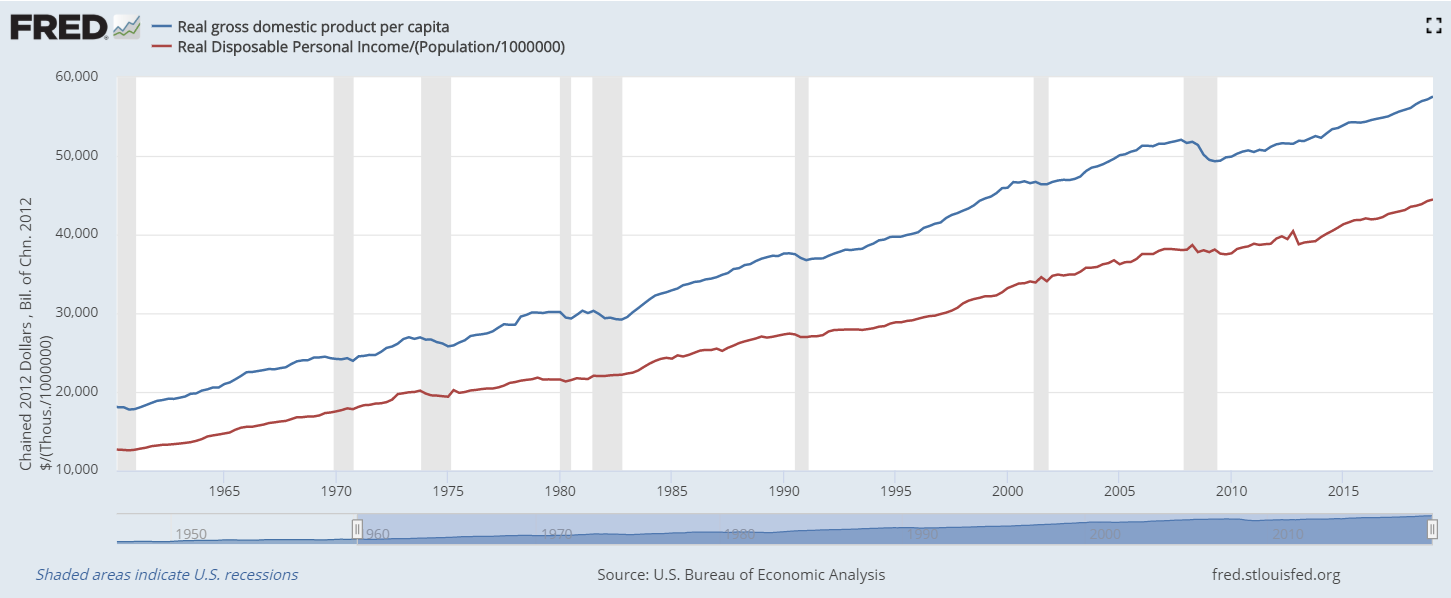
This week I’ll review several decades of trends in productivity. How much output do we get out of labor, land, and capital inputs? Capital can include new equipment, computers, buildings, etc. In the graph below, the blue line is real GDP (output) per person. The red line is disposable (after-tax) income per person. That’s the labor share of that output after taxes.
As you can see, labor is the majority input. In the
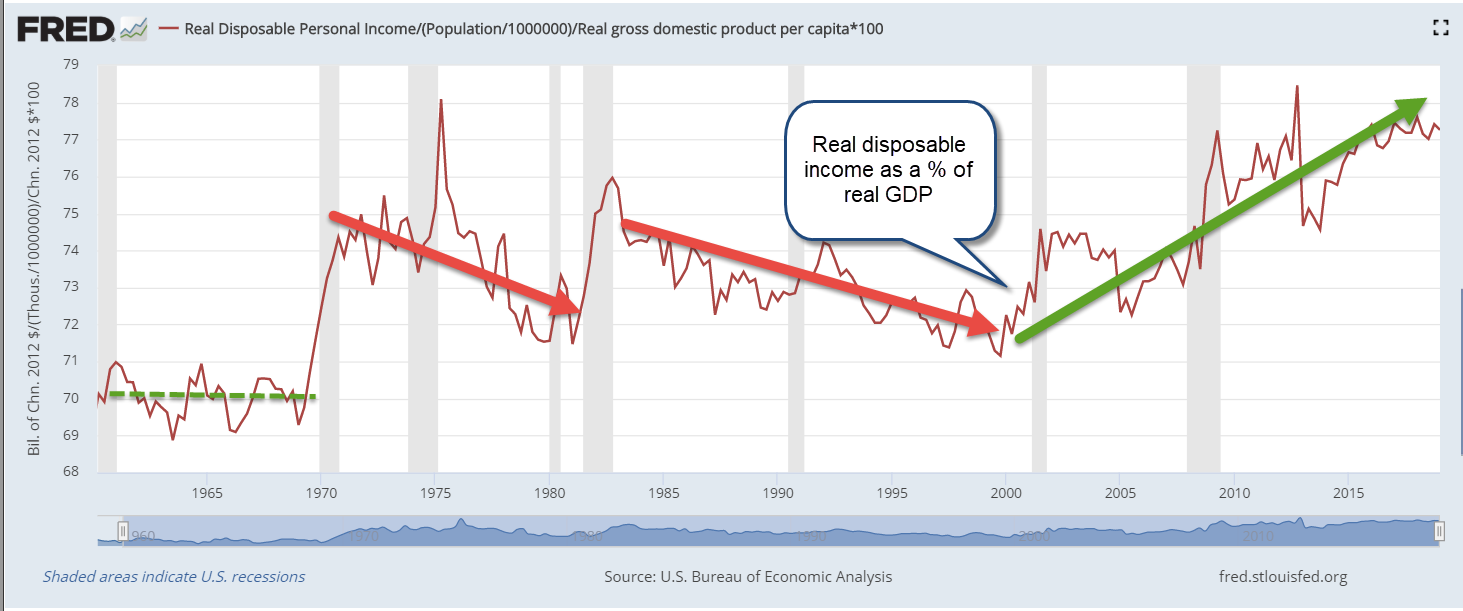
following graph is the share of real GDP going to disposable income. In the past two decades, labor has been
getting a larger share.
That might look good but it’s not. Since 2000, the economy
has shifted toward service industries where labor does not produce as much GDP
per hour. The chart below shows the efficiency of labor, or how much GDP is
being produced by labor.
If labor were being underpaid, the amount of GDP produced
per dollar of disposable income would be higher, not lower. On average, service
jobs do not have as much leverage as manufacturing jobs.
A century ago, agricultural jobs were inefficient in
comparison to manufacturing jobs. The share of labor to total output was high.
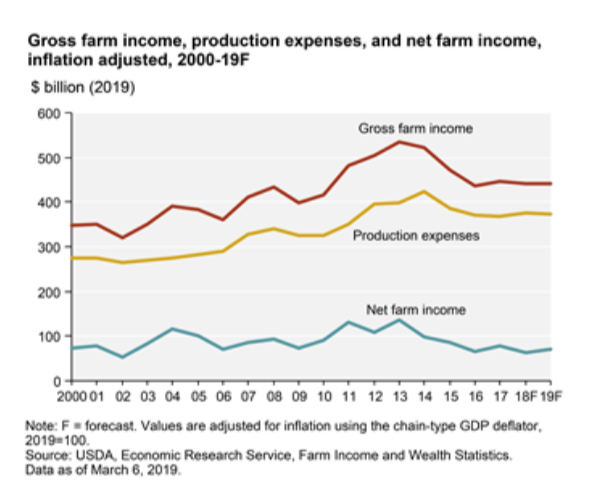
In the past seventy years, the agricultural industry has transformed. Today’s
farms resemble large outdoor manufacturing plants without walls and
productivity continues to grow. In the past five years, steep price declines in
the prices of many agricultural products have put extraordinary pressures on
today’s smaller farmers. The increased productivity of larger farms has allowed
them to maintain real net farm income at the same level as twenty years ago
(Note #1). Here’s a graph from the USDA.
Although agriculture related industries contribute more than
5% of the nation’s GDP, farm output is only 1% of the nation’s total output. The
productivity gains in agriculture have not been shared by the rest of the
economy. Labor productivity has plunged from 2.8% annual growth in the years
2000-2007 to 1.3% in the past eleven years (Note #2). Here’s an earlier report from the Bureau of
Labor Statistics with a chart that illustrates the trends (Note #3). The report
notes “Sluggish productivity growth has implications
for worker compensation. As stated earlier, real hourly compensation growth
depends upon gains in labor productivity.”
Productivity growth in this past decade is comparable to the
two years of deep recession, high unemployment and sky-high interest rates in
the early 1980s. The report notes “although
both hours and output grew at below-average rates during this cycle [2008
through 2016], the fact that output grew notably slower than its historical
average is what yields the historically low labor productivity growth.”
Today we have low unemployment and very low interest rates – the exact opposite
of that earlier period. Why do the two periods have similar productivity gains?
It’s a head scratcher.
Simple answers? No, but hats
off to Donald Trump who has called attention to the need for a greater shift to
manufacturing in the U.S. economy. He and then Wisconsin governor Scott Walker negotiated
with FoxConn Chairman Terry Gou to get a huge factory built in Mount Pleasant,
Wisconsin to manufacture LCD displays, but progress has slowed. An article this
week in the Wall St. Journal exposed the tensions that erupt among residents of
an area which has made a major commitment to economic growth (Note #4).
If we don’t shift toward more
manufacturing, American economic growth will slow to match that of the
Eurozone. Along with that will come negative interest rates from the central
bank and little or no interest on CDs and savings accounts. We already had a
taste of that for several years after the recession. No thanks. Low interest
rates are a hidden tax on savers. They lower the amount of interest the
government pays at the expense of individuals who are saving for education or
retirement. Interest income not received is a reduction in disposable income
and has the same effect as a tax. Low interest rates encourage an unhealthy
growth in corporate debt and drive up both stock and housing prices.
FoxConn LCD factory (March article – no paywall). Also, a recent article from WSJ (paywall) – Foxconn Tore Up a Small Town to Build a Big Factory—Then Retreated