Good Times

January 28, 2018

by Steve Stofka

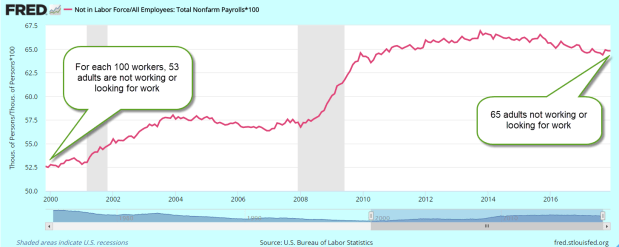
Since the passage of the tax bill about a month ago, the stock market has risen 8%. Some people are convinced that only those at the top own stocks. Any market gains go only to the rich, they say. In the most recent of an annual Gallup survey, 54% of households reported that they directly owned stocks and stock mutual funds (Gallup).  Before the financial crisis, 65% reported direct ownership of stocks.

Private and public pension plans, as well as variable annuity life insurance plans, invest a great deal in stocks. When indirect ownership is added to the mix, a whopping 80% of the stock market is owned by households (Business Insider ). The fortunes of the stock market affect most people, even those on the margins of our economy.

A quarter of companies in the SP500 have reported earnings this month. Annual earnings growth is 12% (FactSet ). In response to the new tax law, companies are bringing home their overseas cash profits and paying Federal taxes on the repatriated profits. Most are predicting strong profit growth for the coming year. Home Depot announced that they are paying bonuses to all their employees.

Since the tax law was signed, the dollar has dropped 5% against the euro. This will make U.S. exports cheaper and more attractive to overseas markets. A euro of profit earned in the Eurozone market was worth $1.07 a year ago when Donald Trump took the oath of office. That same euro is now worth $1.24. Half of the profits of SP500 companies come from overseas, and investors are betting that the dollar will not strengthen substantially in the coming year, despite Trump’s insistence that he likes a strong dollar.

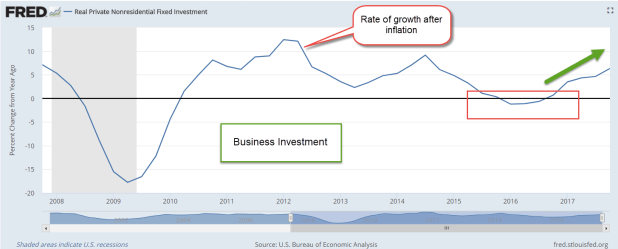
The first estimate of GDP growth, announced Friday, was 2.6%, down from the above 3% performance of the 2nd and 3rd quarters but much better than the 2% and lower rate of growth during 2015 and 2016. The growth of business investment has accelerated over the past four quarters and is nearing 7%.

NonResInvest

Consumer spending grew by 3.8% in the final quarter of 2017, and confidence is near twenty-year highs. Accelerating business investment and a rising stock market help those on the margins of the economy. Unemployment is low. As companies struggle to find employees, they turn to those that they might have turned away a few years ago.

My checker at Target last week had a slight speech defect.  A few years earlier, Target management might have put this person on some duty that did not have such frequent contact with the public, if they hired such a person at all.  Unless there is a specific outreach program, many companies are reluctant to hire those with impediments when there are many able-bodied candidates to choose from.  I was glad to see this twenty-something man employed.

At my local Home Depot a few weeks ago, a guy in a motorized wheelchair helped me locate an item. I got my question answered. Good for him, good for me, good for Home Depot.

A rising tide lifts all boats.  Every day the ever-upward stock market convinces scores of people that they are really smart investors. Many who buy “on the dip” are rewarded as they take advantage of a short term price decline. Some who timidly stayed in cash become convinced that they were too conservative.  They may listen to the market gains enjoyed by their co-workers, family and friends, and feel left out.  How to catch up?  They could take out a home equity loan and use the cash to buy stocks, some leveraged ETFs, or maybe some bitcoin.  Some of those have been on a tear lately.  Hmmmm…

Here’s the thing about a rising tide. A lot of ideas make sense while riding a good tide.


Free Stuff

January 21, 2018

by Steve Stofka

I like the 21st century. I get a lot of free stuff. Opinions, news and information, and directions to anywhere on the planet. Free apps and games for my phone. Free porno and free sermons.

I get so much free stuff that I can afford to pay for fancy coffee and smart phones, television and internet access. I can now afford a personal guru to align my chakras. My personal assistant, Alexa, listens to me and answers my questions.

Goodbye and good riddance to the 20th century with its clunky records, cassettes and DVDs. I say “Alexa, play me blankety-blank song,” and millions of tiny electrons do my bidding, and out comes my song!

My real personal income has doubled since 1973 (Average per capita income ) so I got all this extra free money. I’m getting paid more at work than 45 years ago. My total compensation has gone up 44% (Total real compensation per employee ). My employer provided benefits have doubled (Real employee benefits ). My employer kicks in more free money into my retirement program, and into my health care insurance. That’s real dollars, after inflation.

I got so much extra free money coming in that I’m living like royalty. My income has gone up 100% in 45 years, but my spending has increased 137% because I’m a first class 21st century person that banks want to loan money to.

Outlays1973-2017

Since 2000, I eat out a lot more – like 75% more (Real restaurant sales ). I deserve it cause I’m making all this extra money and I’m too busy to cook. In 2000, I was spending $11.50 a day for shelter but I needed more personal room and modern conveniences. Now I got more room but I’m spending $16 a day.

HousingCostRealPerCap2000-2017

Living first class means that I’m saving a lot less of my free extra money.  45 years ago, I was saving 12% of my income.  Now it’s 3%. But there’s an easy fix to that. More free stuff!
//////////////////////////////

Farming Communities

This past summer, my wife and I joined the many thousands of solar eclipse watchers who visited western Nebraska, where the totality and length of the eclipse was near its peak.  At hotels, shops and restaurants we were greeted with a cordiality that is typical of Nebraskans.  They worked extra hours to accommodate the influx of visitors. At one restaurant, our waitress remarked that the extra business would make up for the slack earlier in the year.  The reason?  Not the food and service, which were both excellent. The locals weren’t eating out as much. And why was that?

Last week, I wrote about the seven-year downturn in commodity prices that has affected many rural communities.  Although agriculture contributes about 6% to GDP (USDA) the changing fortunes of the people who produce our food gets little attention in urban areas.

A few hundred miles away, Denver is booming.  Gentrification and rising housing costs have stressed the pocketbooks of some families.  In Nebraska, it is declining prices that have caused stress fractures in the community (Denver Post ). Land values declined 4% in 2015, and another 9% in 2016 (U. of Nebraska-Lincoln report).

Despite a strong export market for corn, soybeans and other agricultural products, Iowa has had falling land prices for three years. In a recent survey, 40% of responding Iowa farmers reported lower sales in 2017.  However, there was a slight uptick in land values this past year and the hope is that the Iowa agricultural community may be turning a corner.

As land values decline, banks lower lending limits, refinancing terms become more strict.  Families sit at the kitchen table and try to pay higher bills with less money.  Property taxes decline so that there is less money for schools and other public infrastructure.  Seeing the stress that their parents face, younger folks are attracted to urban areas where there is more economic opportunity.  Farms that have been in the family for several generations get sold to large farm management companies.

The governors of western states must understand that they serve all the people of their state.  As people concentrate in the urban centers, they demand more resources from the state.  Those in rural areas feel as though they are being left out.  They will form elective coalitions within state legislatures to offset the growing urban power.

To those in the dense population centers of the coastal states, the shifting political and economic alliances in the fly-over states might earn a shrug.  Our federalist system of voting was a grand bargain to offset the dominance of high population states.  The 2016 election was a good lesson in the power of electoral federalism.  State and federal politicians must build a bridge that crosses the divide between the fortunes of those in urban and rural areas.

Ten Year Review

January 14, 2018

by Steve Stofka

To ward off any illusions that I am an investing genius, I keep a spreadsheet summarizing the investments and cash flows of all my accounts, including savings and checking. Each year I compare my ten year returns to a simple allocation model using the free tool at Portfolio Visualizer. Below is a screen capture showing the ten-year returns for various balanced allocations during the past several years.

10YrReturn20180112
The two asset baskets are the total U.S. stock market and the total U.S. bond market. A person could closely replicate these index results with two ETFs from Vanguard: VTI and BND. Note that there is no exposure to global stocks because Portfolio Visualizer does not offer a Total World Stock Asset choice in this free tool. An investor who had invested in a world stock index (Vanguard’s VT, for example) could have increased their annual return about 1.3% using the 60/40 stock/bond mix.

I include my cash accounts to get a realistic baseline for later in life when my income needs will require that I keep a more conservative asset allocation. An asset allocation that includes 10% cash looks like this.

10YrReturnStkBondCash20180112
In the trade-off between return and risk, a balanced portfolio including cash earns a bit less. In 2017, the twenty-year return was not that different from the ten-year return. From 2009 through 2011, ten-year returns were impacted by two severe downturns in the stock market.

//////////////////////

The Hurt

Falling agricultural prices for seven years have put the hurt on many farmers. This decade may turn out to be as bad as the 1980s when many smaller farms went belly up because of declining prices. Remember the Farm Aid concerts?

The Bloomberg Agriculture Index has fallen about 40% over the past five years. While farmers get paid less for their produce, the companies who supply farmers with the tools and products to grow that produce are doing reasonably well. A comparison of two ETFs shows the divergence.

DBA is a basket of agricultural commodity contracts. It is down 33% over the past five years.
MOO is a basket of the stocks of leading agricultural suppliers. The five-year total return is 31%.

The large growers can afford to hedge falling prices. For family farmers, the decline in agricultural prices is a cut in pay. Imagine you were making $25 per hour at the beginning of 2017 and your employer started cutting your pay bit by bit as the year progressed? That’s what its like for many smaller farmers. They work just as hard and get paid less each year.

Long-Term Trends

January 7th, 2018

by Steve Stofka

This week I’ll look at a few long-term trends in the marketplace for goods and labor.  Millennials born between approximately 1982 – 2002 are now the largest generation alive. Their tastes will dominate the marketplace for the next twenty years at least.  In the first eighteen years of the new century, change has been a dominant theme.

Some businesses drowned in the rush of change. A former member of the Dow Jones Industrial Average, the film giant Eastman Kodak is a shadow of its former self after it emerged from bankruptcy in 2013.

Some in the music business complain that the younger generations don’t want to pay for music. Much of YouTube music is pirated material and yes, Google, the site’s owner, does remove content in response to complaints. There’s just so much of it. Album sales revenue in the U.S., both digital and physical, fell 40% in the five years from 2011 to 2016. Globally, the entire music business has lost 40% in revenues since the millennium and is just now starting to grow again (More).

Some in the porn industry make the same complaint as those in the music business. As online demand for porn grew, the industry helped pioneer digital payment security. Now there is too much free porn on the internet. Producers and distributors pirate each other’s content. Who wants to invest in good production values only to see their work ripped off? (Atlantic article/interview on the porn industry) Will the lack of quality reduce demand? ROFL!

An ever-diminishing number of city newspapers struggle to survive. Some complain that people don’t want to pay for local news. Local reporters have long been the bloodhounds who sniff out the corruption in city halls and state capitols around the country. There are fewer of them now.  Think that corruption has been reduced?  ROFL!

Surviving bookstores glance over their shoulders at Amazon’s growing physical presence in the marketplace. This year Amazon became the 4th largest chain of physical bookstores. The large book publishing houses try to preserve their hegemony as readers turn to a greater variety of alternatively published books.

As online sales grow, brick and mortar stores struggle to produce enough revenue growth to sustain the costs of a physical store.  During the past three years, an ETF basket of retail sector stocks (XRT) is down almost 10%.

Hip-hop music was a fad of the ‘80s and ’90 until It wasn’t. Rock ‘n Roll was a fad that has lasted sixty years. In the early 60s, the Beatles were told to make it rich while they could, and they worked hard to capitalize on their success before it fizzled. Never happened.

How are we going to predict the future if it is so unpredictable? Some standards fade while some fads become standards. We face the past, not the future, as the future sneaks up on us from behind.

//////////////////////////////

Employment

A few notes on what was the weakest employment report of the past year. Job gains were only 150K as reported to government surveyors but the percentage of businesses responding to the survey was particularly low. Expect the BLS to revise those job gains higher next month when more of the survey forms come in. I have long used an average of the BLS numbers and ADP’s estimate of private job gains. That average was 200K – a healthy number indicative of a growing economy.

The long-term trend remains positive. The annual growth of total employment should be at 1.5% or above. We are currently holding that threshold despite the loss of jobs to automation and the growing number of Boomers retiring.  Growth in construction jobs  remains at or above the growth in total employment – another healthy sign.

ConVsPayemsGrowth

The employment market faces a long-term challenge as the largest generation of workers in history is retiring. In January 2000, 69 million adults were out of the labor force. That figure now stands at 95 million. As a ratio, there were 53 adults not in the labor force for every 100 adults with a job. Now there are 65 adults for each 100 workers.

NotInLabForceVsPayems

Although growth in hourly wages is at 2.5%, weekly paychecks have grown 3% as part-time workers get more hours or find full-time jobs. Look for inflation to approach that growth in paychecks.

WeeklyEarnVsInflation

When inflation rises above paycheck growth, workers struggle more than usual to balance their income with spending.  I’ll use that same chart to highlight some stress points during the past decade.

WeeklyEarnStressPoints

As the economy continues to improve, the Fed is expected to continue increasing interest rates either two or three times in the coming year.  After a decade of zero interest rates (ZIRP), those with savings accounts may have noticed that their bank is paying 1% or more in interest.  It is still a far cry from the 4% to 5% rates paid on CDs in the ’90s and 2000s.  This past decade has been particularly worrisome for older folks trying to live off their savings.