Electoral Strategies

October 30, 2022

by Stephen Stofka

This week’s letter is a detour into political branding and public opinion. In interviews with voters, I often hear “I am a [‘Democrat’ or ‘Republican’ or ‘Independent’ here].” It is not unusual to hear the same association with a religion as in “I am a Lutheran” or “I am a Catholic.” These identifications begin when we are young, extending the reach of our sense of self outside the family (Miller & Shanks, 1996, 120). These party affiliations are not mental straitjackets by any means. As we come of age, we form a unique set of values and group identifications and may adopt a party affiliation different from our parents. This can make for some uncomfortable conversation at the Thanksgiving dinner table.

We may self-identify with a party because we are not like those people in that other party. Political and cultural scientists have a term for this process of stereotyping people – othering. We might identify as an Independent voter because we are not a crowd follower like those Democrats and Republicans. We are discerning voters who study the issues and candidates before we vote. That is also a form of othering.

Magleby et al. (2011, 247) found that many self-identified Independents are leaners, leaning toward one party or the other, and are more engaged in political issues. In Presidential elections from 1952 to 2008, Republican leaning Independents voted almost 78% of the time, about the same as Weakly Partisan Republicans. Democrat leaning Independents showed the same behavior. Truly Independent voters who are not leaners have less interest in politics and voted only 63% of the time. In recent years, that percentage has dropped to 53%.

Our party system treats people as though they were computer switches – on or off, left or right. Many of us have graduated value systems that cannot be simplified like a logic gate on a circuit board. Citizen initiated ballot measures reveal that complexity. Many states have citizen initiatives, allowing interest groups to put legislative proposals on the ballot after collecting a number of verified signatures. A voter might be for a proposal to provide free lunches for all students but does not like the way the program is funded and votes NO. The ballots contain only the two choices – YES or NO. Consider a ballot that allowed a voter to represent their actual opinion. A neutral position would be 0. A voter could vote for the proposal on a scale from 1 to 5, or against the proposal on a scale of -1 to -5. We have the technology. Why don’t we have the ballots?

Despite evidence to the contrary, some Republicans voice distrust with voting machines and want to return to the days when paper ballots were counted by hand. They ignore the extensive testing procedures that their own Republican state legislatures conduct (NCSL, 2021). Republican voters who say they doubt the integrity of the vote are, in effect, doubting the honesty of their own party’s legislators whom Republican voters elected. The story is so illogical that Democrats have been unable to tell a narrative that would replace the Republican fairy tale. That is the genius of the Republican political narrative.

In Colorado, a Republican candidate for governor is one of more than a dozen Republican candidates around the country who have been telling outlandish stories that the schools are teaching children to identify as cats and use litter boxes (Klamann, 2022). If the illogical story with the voting machines caught fire with some voters, particularly Q-Anon believers, why not adopt the same strategy and try other bizarre stories? The stories are political hornets, designed to keep Democrats occupied by reminding people of actual facts. In the early 1950s, Republican Senator Joe McCarthy kept Democrats preoccupied with tall tales of Communists lurking behind every bush in Washington and Hollywood. Alex Jones emulates that McCarthyite cruelty and craziness.  

Some Republican candidates celebrate othering and continue to build the Republican party on bias and exclusiveness. Southern Democrats successfully employed that strategy for 100 years after the Civil War. Former First Lady Michele Obama encouraged people to take the “high road” and not give into hate rhetoric. Lies, wild accusations of socialism and staged Tea Party rallies contributed to a historic loss of Democratic House seats in the 2010 midterms. In our winner-take-all electoral system, there is only one road to victory and political power. It is neither high nor low.

Democracy thrives on open distrust, on bold lies and the histrionics of political candidates and their supporters. Few Chinese dare to voice distrust with their leader, Xi Jinping. At the gathering of the CCP Congress this month, there was no wild gesticulating or shouting like there is at American political conventions and sometimes at State of the Union addresses. Americans treat politics like a rodeo, swooping and hollering. Chinese leaders look profoundly serious. In both countries, people are getting hurt, jailed and isolated but the American system is entertaining.

//////////////////////

Photo by Nelson Ndongala on Unsplash

Klamann, Seth. 2022. “‘Incredibly Frustrating’: Colorado Schools Reject Ganahl’s Claims That Students Identify as Cats.” The Denver Post. https://www.denverpost.com/2022/10/04/colorado-schools-heidi-ganahl-students-cat-claims/ (October 28, 2022).

Magleby, David B, Candice J. Nelson, and Mark C. Westlye. 2011. “The Myth of the Independent Voter Revisited.” In Facing the Challenge of Democracy: Explorations in the Analysis of Public Opinion and Political Participation, eds. Benjamin Highton and Paul M. Sniderman. Princeton, NJ: Princeton University Press. essay, 238–64.

Miller, Warren Edward, and J. Merrill Shanks. 1996. The New American Voter. Cambridge (Mass.): Harvard University Press.

NCSL: National Conference of State Legislatures. 2021. “Voting System Standards, Testing and Certification.” National Conference of State Legislatures. https://www.ncsl.org/research/elections-and-campaigns/voting-system-standards-testing-and-certification.aspx (October 28, 2022).

Tower of Babel

October 23, 2022

by Stephen Stofka

This week’s letter is about taxes and income. Each month, the Federal Reserve (2022) releases an estimate detailing how people spend their money and the sources of their income. I was surprised that 17% of personal income is from government transfers like Social Security and other programs. This is 2% more than the income people receive on their assets. A bit of history for context.

In the 1960s, 2/3 of income was from wages and salaries. Each decade, the wages and salaries component declined 5% until this past decade when wages and salaries were just 50 cents out of every dollar of income.

A greater portion of employee compensation shifted from discretionary income to dedicated non-taxable benefits like health care insurance and pensions. In the early 1960s employer benefits were 10% of wages and salaries. Now they are 21%. Despite the rise in the non-taxable share of compensation, workers give up more out of their paychecks to taxes.

A growing share of income goes to FICA taxes

In 1960, workers paid 6% of their paychecks to FICA taxes. The Medicare program, about 20% of our FICA taxes today, would not be enacted until 1965 when President Johnson ushered in his Great Society programs. Within five years analysts realized that lawmakers had wildly underestimated the costs of the program. By 1980, increases in Social Security and Medicare taxes increased the FICA portion to 12% of paychecks. Today, workers pay 15% of their paychecks in FICA taxes (see note).

In 1960, all other taxes were 11% of total income in 1960, had climbed to almost 13% in 1980 then to over 14% by the year 2000 and are now 15% of total income. In the past twenty years, the rich have paid a growing share of income taxes but their effective tax rate has changed little. Why? When lawmakers put a heavier burden on rich people, they lobby for legal income exclusions and Congress obliges.

Top 10% pay a growing share of income tax

In 2001, the top 1% paid 33% of income taxes. In 2019, they paid 39% (IRS, 2022). In 2001, the top 10% (the Tennies, I’ll call them) paid 64% of personal income taxes. In 2019, they paid 71%. Whether it is the super-rich or the rich, their share of income tax has grown by 6 -7%. That’s not the end of the story.

Growth in incomes of the top 10% is far higher

The Tennies have seen their share of gross income increase from 42.5% in 2001 to 47.3% in 2019, a gain of almost 5 percentage points. They have paid a rising share of the nation’s income taxes but the rise in taxes is less than the rise in personal income (BEA, 2022). In the 2001-2003 period the income tax paid by the Tennies averaged 5.6% of national personal income. In the 2017-2019 period, that tax share was 6.3%, a difference of just .7%. It is a cheap price to pay for a 5% gain in the nation’s total income.

Effective Tax Rate of the top 10% is steady despite rise in Income

In the 2001-3 period the Tennies averaged an effective tax rate of 13.5%. In the 2017-19 period, that effective rate had declined to 13.2% despite a 2% rise in the top marginal tax rate from 35% in 2001 to 37% in 2019. Raising the marginal tax rate on the highest income brackets has little net effect yet it was a campaign issue for Mr. Biden and many Democrats. Political scientists call it position-taking.

The party of no taxes produces higher deficits

Despite their rhetoric about reducing the deficit, Republicans have adopted a no new taxes on anyone pledge that ensures the deficit will get worse. True to form, the budget deficit has grown more under Republican administrations over the past four decades. The party also has a record of slower economic growth but that is mostly due to the two terms of the George Bush administration. Mr. Bush’s failures caused many Republicans to abandon more mainstream Republican values and adopt a mean spirited attitude of radical defiance exemplified by the Tea Party and the Republican Study Committee.

Action requires Compromise

The “Just Say No” Republican factions permit little compromise so the party cannot get significant legislation passed. In the first year of Mr. Trump’s Presidency, Republicans held all three legislative bodies but were stymied by their internal squabbles. In November of 2017, they hastily assembled the corporate tax reform package, TCJA, to show their constituents that they were capable of legislating and to give Mr. Trump some accomplishment that he could tweet  about.

A look ahead

If Republicans take control of the House after the upcoming elections, we can expect more of the same dysfunction under Speaker Kevin McCarthy. Libertarians in the Republican Party want a limited role for the federal government as specified in Article 1, Section 8 of the Constitution. They have little tolerance for national abortion laws and other bullying social legislation that Republicans have promised. The uncompromising factions within the Republican Party ensure that the party cannot govern. They are like drivers in a car with a manual transmission who don’t know how to clutch and shift. Democratic lawmakers, on the other hand, drive down the road, focused on staying perfectly centered between the white lane markers of equality and equity. The rich benefit when party leaders cannot assemble a cohesive coalition of interest groups and voters. The economic interests of the top 10% are protected when voters remain fragmented. Party elites and partisan interest groups speak in languages that are understandable only to a narrow constituency. By promoting dissension, social media has helped create a Tower of Babel.

/////////////////////

Photo by Osman Rana on Unsplash

BEA: U.S. Bureau of Economic Analysis, Personal Income [PI], retrieved from FRED, Federal Reserve Bank of St. Louis; https://fred.stlouisfed.org/series/PI, October 19, 2022.

Federal Reserve. (2022). Personal income and its disposition. FRED. Retrieved October 19, 2022, from https://fred.stlouisfed.org/release/tables?rid=54&eid=155443&od=#. The FICA tax percentage includes the employer and employee portion of the tax. The employee effectively bears the burden of the entire tax.

IRS. (2022). SOI tax stats – individual income tax rates and tax shares. Internal Revenue Service. Retrieved October 19, 2022, from https://www.irs.gov/statistics/soi-tax-stats-individual-income-tax-rates-and-tax-shares#Early%20Release. Table 4.2, Selected Descending Cumulative Percentiles of Returns Based on Income Size Using the Definition of AGI for Each Year.

A Global Wave

October 16, 2022

by Stephen Stofka

On Thursday, September’s CPI came out, showing an annual price increase of 8.2%. A quarter of that increase was housing costs – rent and owner equivalent rent. Price increases have decelerated this quarter. Remember that inflation is the change in prices. Acceleration (+) or deceleration (-) is the change of that change. Inflation is like the speed in a car. Acceleration is the change in speed. The graph below shows the acceleration for the past five years.

Notice the regular up and down in small increments before the pandemic. When we drive down the highway without cruise control, we experience the same minor variations in speed. After the pandemic, price acceleration became more erratic. Why?

Usually, we do not synchronize our spending and saving. During the pandemic in 2020, we began to coordinate our buying habits. The first round of stimulus checks went out in April 2020, shortly after the economy was locked down. We bought workout equipment, computers and peripherals, appliances for the home. The second round of stimulus went out in December 2020 and January 2021. President Biden was sworn into office in January 2021 and immediately began discussions of a third stimulus payment, part of the American Rescue Plan.

Critics say the third stimulus payment was too much, that it was the impetus to the recent inflationary surge. That is an ex-post or hindsight criticism. On December 18, 2020, Moderna was granted emergency approval by the FDA (2020) for its MRNA vaccine, a relatively new vaccine manufacturing technology. The Pfizer vaccine was the first to get such approval but its vaccine required a temperature of -94F. Moderna’s vaccine required a temperature of only -4F, about the same level as the freezer temperature in a home refrigerator. The vaccine was deemed safe but the drug makers did not know how long the vaccines would last. Secondly, they needed a booster shot as well. Moderna promised 100 million doses by March of 2021. What if the vaccines lasted only a few months and development of a better formulation was delayed another year? The third stimulus would have been entirely appropriate. Policymakers must make ex-ante decisions – before all the evidence is known or evaluated.

In 2021, some economists predicted higher inflation in 2022. They turned out to be right. Ten years ago, those same economists predicted higher inflation after the 2009 ARRA stimulus. They were wrong. Economists, like traders, are right sometimes and wrong sometimes. Like traders, the winning prediction rate is closer to 50-50 or pure chance. Others are likening this to the inflation of the 1970s. However, there is a big difference. In the 1970s, price acceleration kept rising like a car which is speeding up. Currently it is falling, like a car slowing down. Here’s a look price acceleration in the 1970s.

As I mentioned last week the Social Security Administration announces the yearly COLA for Social Security recipients after the September CPI figure is reported. The 2023 COLA adjustment will be 8.7%, adding $146 to the average $1673 monthly payment for retirees. As I discussed last week, worker’s wages have not kept up with inflation. They are more on a fixed income than retirees at this point.

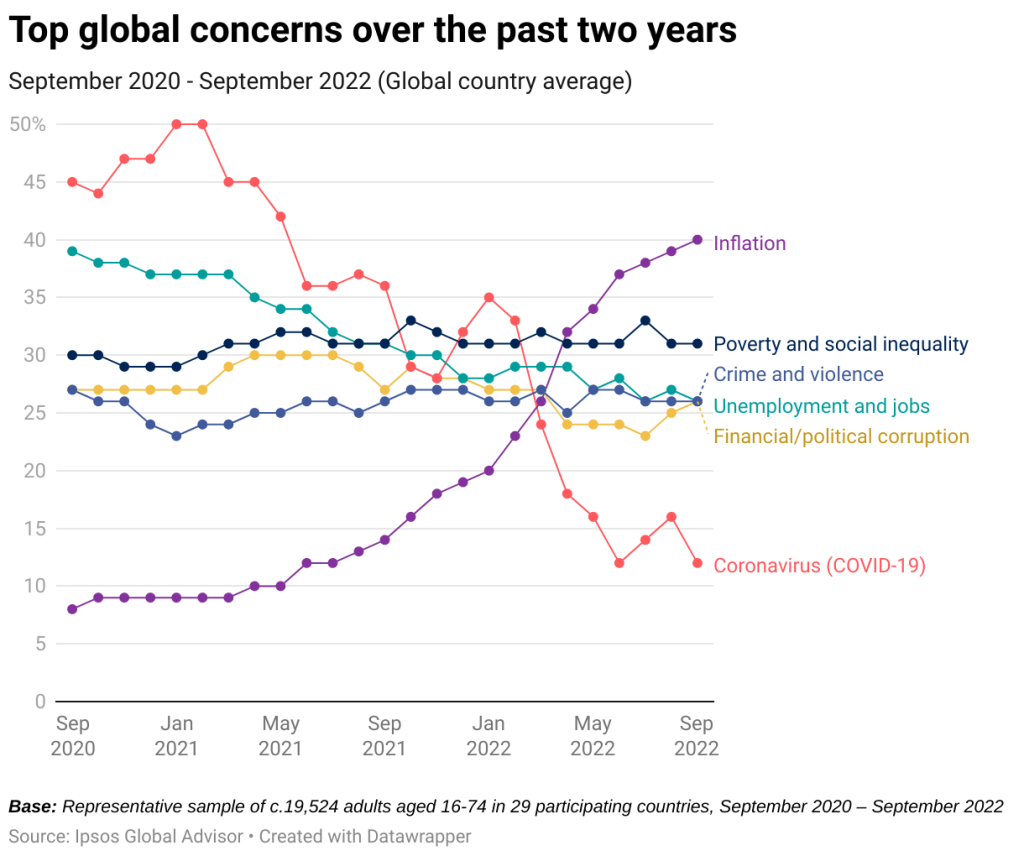
The inflation is global – a first in economic history. Global market research company Ipsos (2022) survey people in 29 countries. Inflation has become the top concern for 40% of respondents. Here’s the chart I downloaded from their page. Look at the surge in inflation as a concern over the past year. Unemployment and Covid-19 were the top concerns in 2020. Stimulus assistance and monetary policy in the Eurozone countries helped relieve job concerns. Covid-19 became less worrying as more people got vaccinated and hospital admissions decreased. After Russia’s invasion of Ukraine, rising oil prices lifted inflation worries in many countries.

As the world becomes more integrated financially and economically, will we reach a self-destructive resonance? Our economic systems could become less stable as they synchronize. I hope not.

////////////////

Photo by Providence Doucet on Unsplash

FDA. (2020, December 18). FDA takes additional action in fight against COVID-19 by issuing emergency use authorization for second COVID-19 vaccine. U.S. Food and Drug Administration. Retrieved October 15, 2022, from https://www.fda.gov/news-events/press-announcements/fda-takes-additional-action-fight-against-covid-19-issuing-emergency-use-authorization-second-covid

Ipsos. (2022, September 22). What worries the world – September 2022 . Ipsos. Retrieved October 14, 2022, from https://www.ipsos.com/en-uk/what-worries-world-september-2022

The Old, Young and Middle

October 9, 2022

by Stephen Stofka

This week I’ll compare inflation-adjusted or real spending on Social Security and K-12 education with wage growth. I was surprised to learn that the number of people in both programs are the same. I’ll begin with Friday’s employment report because the market’s reaction to it indicates the erratic – but rational – thinking that higher inflation can trigger. Job gains of 263,000 were in line with expectations, but the unemployment rate went down by .1% because people stopped looking for jobs. Three years ago a .1% move would be discarded as a survey error. The unemployment rate is derived from a survey of households, not businesses, and often exaggerates any move up or down. In today’s volatile market, traders are skittish, employing algorithms that don’t care about the extent of a move, only whether it is up or down. Short term options trading leverages both money and time and they are now almost half of the options market. A minus sign might trigger a sell, a plus sign a buy. The number after that plus or minus is less important. A trader might have taken a position forecasting a slight uptick in the unemployment rate. No increase or a decrease = sell and minimize losses. This is reactive trading, not economic evaluation.

This week’s ADP report of private job gains showed a decline of 7,000. Averaged together job gains were only 116,000 in September and has shown a distinct downward response to the Fed’s raising of interest rates. The historical average of the two surveys has been the more accurate after revisions. More disappointing for workers is that wage growth has been more than 3% below the inflation rate.

While workers’ wages are not keeping up with inflation, social security recipients will likely get a COLA (cost-of-living-adjustment) raise of about 8.6% this year. By law, the COLA calculation compares this year’s average third quarter CPI to last year’s third quarter average. September’s CPI report will be released Thursday, October 13th, finalizing this year’s 3rd quarter and the final adjustment percentage. It will be the largest increase since 1981’s adjustment of 11.3%, according to the Social Security Administration (2022).

An eternal theme in the Republican platform is the privatization of Social Security before it goes broke. A few weeks before the election, some Republicans will undoubtedly use the COLA adjustment to call for Social Security privatization. They will claim that higher payments will inevitably lead to the insolvency of the fund. Retirees will get partial payments or no payments.

Former House Speaker and Republican Vice-Presidential candidate, Paul Ryan once asked Alan Greenspan, then Chairman of the Fed and a fellow conservative, a leading question meant to demonstrate the insolvency of Social Security. Wouldn’t personal retirement accounts (privatized Social Security accounts) make the retirement system more financially secure? In his dry tone, Greenspan answered that “there is nothing to prevent the Federal Government from creating as much money as it wants and paying it to somebody” (C-Span, 2005). Ryan, a champion of privatization, was disappointed in the answer.

Why then do we have the trust funds? The Social Security system is “Pay-Go.” The taxes of current workers pay for the benefits to retired workers. When the program was created almost 90 years ago, President Roosevelt (FDR) thought that Republicans – and some conservative southern Democrats – would be more hesitant to cancel the program if funds were – on paper at least – dedicated to the program and called “insurance.” Republicans challenged the program up to the Supreme Court on the basis that the Federal government had no Constitutional right to force people to pay into a retirement program. The Court ruled that, even if the program was called “insurance,” it was a tax and the government had the right to tax incomes. Read the 16th Amendment. The unfairness in the system was that the first generation of recipients paid little into the system for the benefits they received when they retired. Today, the average retiree receives $1673 a month, or $20K per year (SSA, 2022). Let’s compare that to spending on K-12 education.

The U.S. has about the same number of K-12 students as it does retirees who are collecting Social Security – a bit more than 50 million. Social Security is a federal program. K-12 education is funded at the state and local level with only 8% federal funding. The federal government has deep pockets. State and local governments have shallow pockets with many demands from their constituents. In 2019, federal, state and local governments spent $765B, or $15,120 per pupil in 2019 (Hanson, 2022). That’s 75% of what we spend on retirees. Have we shifted too many resources to seniors from children?

Retirees have paid Social Security taxes for their entire working lives and feel that those funds have been set aside for them. The federal government doesn’t have to provide goods and services to retirees. Even the task of computing and remitting Social Security taxes is done by businesses – by law and for free. The accounting is a business expense. State and local governments must provide real resources. These include schools and facilities, teachers and lunches, school nurses and security guards.

Education competes with other essential services. The 2008 financial crisis and the slow recovery “put a hurt” in most state and local budgets. Since 2008, the national average of real per pupil funding has increased only 6% (Hanson, 2022). For most of that time, inflation has been low. Imagine what a sustained period of high inflation might do. Let’s look back at the last period – the 1970s and early 1980s.

Higher inflation wakes us up. Even when inflation is low, workers are squeezed, having to support children and retirees. Inflation increases the budget squeeze so workers pay closer attention to personal budgets and public policies. In the high inflation decade of the 1970s the public discovered that income and real estate taxes were not indexed to inflation. Rising wages caused people to go into higher tax brackets even when their real wages had barely moved. Tax laws were changed in the 1980s.

Ever rising real estate taxes in California made it difficult for retired homeowners on fixed incomes to stay in their homes. A growing taxpayer revolt rose up in many states. In 1978, California voters approved Proposition 13 which limited annual increases in taxes. Real estate taxes are the largest source of funding for schools so today California spends 10% less than the national average on K-12 students. Will today’s higher inflation provoke some sweeping policy changes?

Knowing past history, the Fed can’t let high inflation get entrenched in the economy for long. People will demand policy and institutional changes. Next week I’ll look at consumer psychology during high inflation periods.

////////////////////////

Photo by CDC on Unsplash

C-Span. (2005, March 3). User Clip: Alan Greenspan answers Paul Ryan. C-Span. Retrieved October 7, 2022, from https://www.c-span.org/video/?c4923562%2Fuser-clip-alan-greenspan-answers-paul-ryan

Hanson, Melanie. “U.S. Public Education Spending Statistics” EducationData.org, June 15, 2022, https://educationdata.org/public-education-spending-statistics

Social Security Administration. (2022). Cost of Living Adjustments. Cost-Of-Living Adjustments. Retrieved October 7, 2022, from https://www.ssa.gov/oact/cola/colaseries.html

SSA: Social Security Administration. (2022, August). Monthly Statistical Snapshot, August 2022. Research, Statistics & Policy Analysis. Retrieved October 7, 2022, from https://www.ssa.gov/policy/docs/quickfacts/stat_snapshot/

////////////////////////

50595238

The Fed’s Toll Booth

October 2, 2022

by Stephen Stofka

The dollar is the world’s reserve currency and its strength – its price relative to other currencies – is straining both the economies and the financial expectations of other countries. Businesses in developing countries with an unreliable currency regime often have to borrow in dollars – what is called “dollar denominated debt.” Businesses must make their loan payments in dollars so they must trade in ever more of their local currency to get the dollars to make the payment. European nations stocking up on liquified natural gas (LNG) from the U.S. are feeling the pinch as well. Why is the dollar strengthening?

In international finance there are two equations that model the relationship between expected inflation, exchange rates and interest rates. Currency traders are expecting inflation to moderate more quickly in the U.S. than in other countries. Because the U.S. has a better supply of natural gas, its energy prices will be less affected by the war in Ukraine. Secondly, the Fed has been increasing interest rates, enticing investors in other countries to invest their money in U.S. debt. The dollar-euro exchange rate has not been this low since 1999 when the Eurozone countries began using a common currency, the euro.

When the dollar gets stronger, exports decrease because American goods are more expensive to buyers in foreign countries. Imports become cheaper so Americans buy more stuff from other countries. However, if the U.S. is sliding into a recession, Americans are less likely to buy enough European imports to offset the LNG that European countries will buy from the U.S.  This will increase the demand for dollars relative to the euro, further driving up the price of dollars in other currencies.

The dollar has been strengthening against other forms of currency like gold and digital exchange mechanisms like Bitcoin. Priced in dollars, gold has lost about 16% of its value in the past six months. Bitcoin has lost 60% since March. Gold is both a commodity and a currency. Gold holds a store of work that it can do in the future. It has cosmetic and industrial uses.

Bitcoin is the product of past work only – a “proof of work” done in the past. It stores no capability of future work. It takes a lot of electricity and computing power to mine Bitcoin but it cannot store electricity for future use. If it could do so, the price of Bitcoin would go up when electricity prices went up.

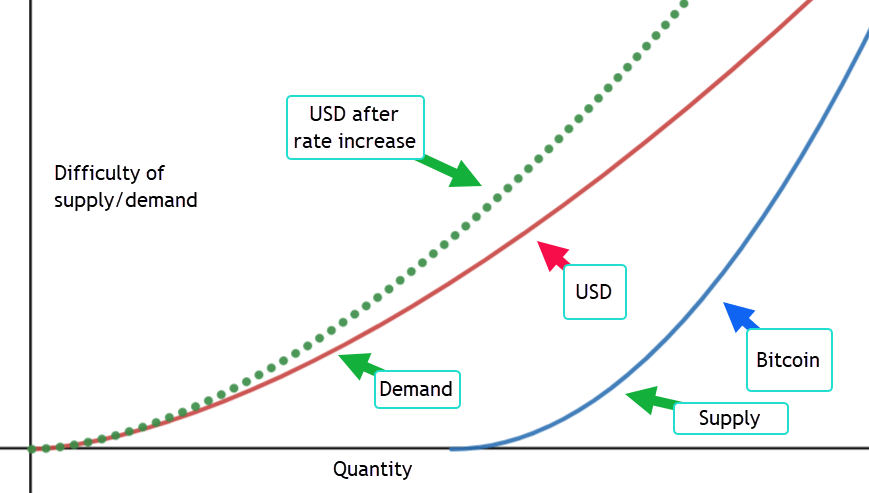
In the graph below I’ve illustrated a key difference between the dollar and Bitcoin. On the right is Bitcoin. Its algorithm incorporates a “diseconomies of scale.” As more Bitcoin is mined, it takes more effort to mine Bitcoin. Bitcoin focuses on the difficulty of supply.

On the left is the fiat dollar. There is no difficulty in supplying it. The Fed focuses on the demand for the dollar by adjusting the interest rate, the bend in the curve. It is currently tightening that bend – the dotted green curve – and increasing the difficulty of getting more dollars. The dollar can respond to changing demand more easily than gold or Bitcoin because it targets demand.

Like Bitcoin, the dollar stores no future work. In an article earlier this year (2022), I wrote that America’s store of wealth was both a proof-of-work, proof-of-stability and proof-of-trust. The dollar itself is only a sign of trust in American institutions. The checks and balances of our system of government ensures that most policymaking is incremental. While that frustrates Americans, the relative predictability of U.S. policy is reassuring to foreign investors. Americans often run around like crazy monkeys on the deck of a cruise boat but the ship is unlikely to make a large course correction.  

Think of the bend in the curve as a toll for using the highway to the future. Bitcoin’s curve is rigid. The toll remains the same. Bitcoin enthusiasts would maintain that this rigidity should shift the curve to the right over time, increasing the buying power supplied by Bitcoin.

Let’s look at three approaches.
1) Bitcoin limits the length of highway that will be built. Enthusiasts claim that this will make each “mile” of the bitcoin highway more valuable.

2) MMT advocates offer a different solution. As long as there are resources – both labor and material – available, build more highway. By targeting the supply available, congestion will ease.

3) The Fed offers an approach that targets demand, not supply. The Fed raises and lowers the interest rate – the toll – to get onto the highway to the future. Raising interest rates is a form of congestion pricing. High inflation means that there are too many people using the available length of highway. The Fed has promised that it will keep raising the toll until fewer people are using the highway. As demand declines, some of those working on the highway may lose their jobs. Unemployment will increase but historically it is very low.

The strength of the dollar against other currencies, including Bitcoin and gold, indicates increasing demand for the Fed’s approach. What is the morality of an international floating rate regime where businesses in a developing country have to work even harder to pay their dollar-denominated loans? Bitcoin advocates claim that global adoption of Bitcoin will make a more even playing field, reducing the advantage that developed countries have over developing countries. That can be the subject of another article.

////////////

Photo by kyler trautner on Unsplash

Stofka, S. (2022, April 16). Fortress of Trust. Innocent Investor. Retrieved October 1, 2022, from https://innocentinvestor.com/2022/04/17/fortress-of-trust/