Grandma’s Kids

May 27, 2018

by Steve Stofka

The birth rate has touched a 30-year low, repeating a cycle of generational boom and bust since World War 2. The first boom was the Boomer generation born in the years 1946-1964 (approx). They were followed by the baby bust Generation X, born 1964-1982. The Millennials, sometimes called Generation Y and born 1982 – 2001, surpassed even the Boomers in numbers. Based on the latest census data, Generation Z, born 2002- 2020, will be another low birth rate cohort.

These numbers matter. They form the population tide that keeps the entitlement system afloat. Social Security and Medicare are “pay as you go” systems. Older generations who receive the benefits depend on taxes from younger generations for those benefits. As the population surge of Boomers draws benefits, the surge of Millennials is entering their peak earning years.

To maintain a steady population level, each woman needs to average 2.1 births. During the Great Recession, the birth rate for native-born Hispanic and Black women fell below that replacement level. White and Asian women fell below that level during the recession following the dot-com boom in the early 2000s. Foreign born Hispanic and Black women are averaging a bit more than 2-1/2 births. The average of foreign born White and Asian women is just about replacement rate.

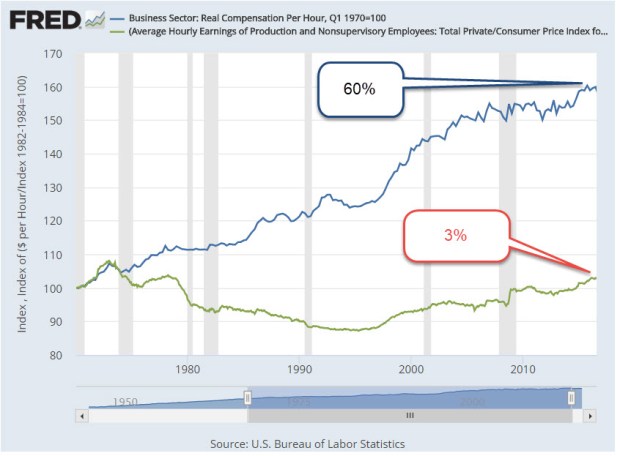
Around the world, birth rates are falling. Social welfare programs depend on inter-generational transfers of income. When a smaller and younger generation must pay for a larger and older cohort, there is an inevitable stress.

I will distinguish between social welfare programs and socialist welfare programs with one rule: the former require that a person pay into the program before being entitled to the benefits from the program. In this regard, they are like insurance programs except that private insurance policies are funded by asset reserves held by an insurance company. Government “insurance” programs are “pay as you go” systems. Current taxes pay for current benefits. The Social Security “reserve” is an accounting fiction that the Federal government uses to track how much it has borrowed from itself.

Examples of social welfare programs that require the previous payment of dues are: Social Security, Medicare, Unemployment and Workmen’s Compensation Insurance. Although the latter two are paid directly by employers, they are effectively taken out of an employee’s pay by reducing the wage or salary that the employer pays the employee. Employers who fail to understand this go out of business early in the life of the business. I have known some.

Examples of socialist welfare programs that are based on income, or need: Medicaid, TANF (Welfare), WIC, Food Stamps, Housing and Education Subsidies. There is no requirement that a person pays “dues” into a specific program before receiving benefits.

Health care in America is primarily a social welfare program with socialist elements. The Federal government does subsidize all employer provided health insurance and most private insurance through the tax system or the Affordable Care Act. However, most beneficiaries must pay some kind of insurance to access benefits. Under the 1986 EMTALA act, emergency rooms are notable exceptions to this policy. They are required to treat, or medically stabilize, all patients insured or not.

As Grandma begins to draw benefits from Social Security and Medicare, she relies on the earnings of her kids who form the core work force aged 25 – 54. Grandma has paid a lifetime of dues into the social welfare programs and wants her benefits. Grandma votes.

Her grandkids want government subsidies for educational needs and job training. They depend on socialist welfare programs with no dues. The grandkids don’t vote.

The kids are caught in a generational squeeze.  Their taxes are paying for both their parent’s benefits and their kid’s benefits.

/////////////////////////

Housing Trends

In the spring of 2008, there was an eleven month supply of existing homes on the market.
2010 – 8-1/2 months
2012 – 6-1/2 months
2014 – 5-1/2 months
2016 – 4-1/2 months
2018 – 4 months

In some cities, a median priced home stays on the market less than 24 hours.

Here is another generational shift.  Grandma and Grandpa now own 40% percent of home equity, up from 24% in 2006. Their kids, the age cohort 45 – 60, own 45%. Those under 45 have only 14% of home equity, down from 24% in 2006.

//////////////////////

Brave New World

E-Commerce is now 9.5% of all retail sales, almost triple the percentage ten years ago. (Fed Reserve series ECOMPCTSA). In 2000, the percentage was less than 1%.

The Big Picture

May 19, 2018

by Steve Stofka

Here is a simple and elegant animation model of the economy in a thirty-minute video from Bridgewater Associates, the world’s largest hedge fund. The video illustrates the spending – income – credit cycle in easy to understand terms. The video includes an insight first noted eighty years ago by the economist John Maynard Keynes, who pointed out that one person’s spending is another person’s income. Sounds obvious, doesn’t it?  I spend money on a pizza which increases the income of the pizza store.

When Keynes explored this simple idea, he revealed a glitch in the traditional model of savings and investment. In a simplified version, money not spent is saved in a bank. The bank loans out those savings to a business.  A business invests that loan into production for future spending. When economists model the whole economy, Savings = Investment. It is an accounting identity like a mathematical definition. The financial industry transforms one into the other.

During the Depression, something was obviously broken, and economists debated various aspects of their models. Keynes asked a question: what happens to the merchant where the money was not spent? Let’s say the Jones family decides not to buy a new TV and puts the money in a savings account at the Acme Bank.  The local Bigg TV store sells one less TV and has a corresponding decline in its income. Because Bigg had less income, they must withdraw money from their Acme Bank savings account to meet payroll. The money that the family saves is withdrawn by the business. The money Saved never makes it to the Investment side of the equation.  There is no increase in investment.

Most of the time, those who are saving and those who are spending funds from saving balances out. But there were times, Keynes proposed, when everyone is saving. Keynes attributed the phenomenon to “animal spirits.” As incomes fall, people start using up their savings to make up for the lost income.

During a crisis like this, Keynes proposed that government increase its spending, even if it needed to borrow, to boost incomes and break the vicious cycle. When the crisis was over, the government could raise taxes to pay back the money it borrowed. In Keynes’ model, government spending acted as a balancing force to the animal spirits of the capitalist economy. In the real world, politicians win votes by spending money but find that raising taxes does not win them favor with voters. Without legislative debt controls, government borrowing to counterbalance declines in income only produces greater government debt.

Turning from government debt to personal debt, the average credit card rate has risen to 15.3%, an eighteen year record. As an economy continues to expand and credit is extended to those with marginal creditworthiness, the default rate grows. The percent of credit card balances that have been charged off in default has risen from 1.5% several years ago to 3.6% in the 4th quarter of 2017.

Mortgage rates have risen to about 4.9% on thirty-year loans, and about a half percent less on fifteen-year loans. That half percent difference is close to the average for the past twenty-five years and adds up to an extra $1.60 in interest paid during the life of the loan on every $100 of mortgage principal. The graph below shows the difference between the two rates.

MortRatesDiff

Because shorter-term mortgages require higher monthly payments, they are more feasible for those with stable financial situations and above average incomes. When the difference in rates is less than average, there is a smaller advantage to getting a short-term mortgage.  At such times, the mortgage industry is reaching out to expand home ownership to lower income homeowners. When the difference is more than average, as it has been since the recession, the finance industry is cautious and not actively reaching out to lower income families.

Mortgages are secured by a physical asset, the house. U.S. Treasury bonds are secured by an intangible asset, the full faith and credit of the country. Just like us, the Treasury usually pays a higher interest rate for a longer-term loan.

A benchmark is the difference between a 10-year Treasury bond and a 2-year bond. As this difference declines toward zero, economists call it a “flattening of the yield curve.” At zero, there is no reward for loaning the government money for a longer term. Knowing only that, a casual investor would sense that something is wrong, and they are right. Periods when this difference falls below zero usually occur about a year before a recession starts. In the graph below, I’ve shaded in pink those negative periods. In gray are the ensuing recessions.

10YRLess2Yr

Before that negative pink period comes another phenomenon. Above was the 10 year – 2 year difference in interest rates. Let’s call that the medium difference. There’s also the difference between two long term periods, the 20-year minus 10-year difference. I’ll call that the long difference. When we subtract the medium difference from the long, we get a difference in long term outlook. In a healthy economy, that difference should be positive, meaning that investors are being paid for taking risks over a longer period. When that difference turns negative, it shows that there are underlying distortions in the risks and rewards of loaning money. That distortion will show first before the flattening of the yield curve.

DiffRates1995-2018

As you can see, the difference today is positive, a welcome sign that a recession is not likely within the year.

//////////////////////////

Tidbits

The actuaries for Social Security and Medicare use an assumption that our average life expectancy will increase .77% per year (Reuters article)  If you are expected to live till 85 this year, then that expectation will grow to 85 years and eight months next year. That’s a nice birthday present!

U.S. lumber mills can supply only two-thirds of the lumber needed by homebuilders. The other third comes from Canada. Recent import tariffs now add about $6300 to the price of a new home (Albuquerque Journal).

Optical Illusions

May 12, 2018

by Steve Stofka

I have long enjoyed optical illusions. Is that a picture of a rabbit or a duck? Which way is the cube facing, right or left? (Some examples) Is that two people facing each other, or a vase? (Image page) These can be even more fun when shared with a friend or sibling. Can’t you see the rabbit? No, it’s a duck!!!

Moving images present a selective attention deception. When asked to count the number of basketball passes, we may not see the gorilla that walks across our field of view. (Video)

These examples excite our curiosity and fascination as children and carry important lessons for us as adults. We sometimes misinterpret the data our senses receive. Those with a strong ideological bent may focus narrowly on only that data that supports their view of the world, or that makes them feel comfortable.

Let’s look at an example. Real (inflation-adjusted) median (middle of the pack) household income peaked in 1999 at $58,665. In 2016, income climbed to $59,039. However, personal income did not peak till 2007, at $30,821. Like household income, personal income finally rose above that peak in 2016.

PersVsHouseholdIncome

In the household series, the past twenty years have been especially tough. In the personal series, only the past ten years have been that difficult. What accounts for the difference in the two series? Households have grown faster than the population. Population Income / Households will be lower when households increase.

But what is income? Household income is money income received and does not include employer-provided benefits and retirement contributions (Census Bureau Defs). The BLS does track total compensation costs which do include these benefits, and those costs are 67% higher today than they were in 2001.

Benefits

If an employer gave an employee $500 a month for health care expenses and the employee sent the money to the health insurance company, that would be counted as income in the data. But because the employer sends the money directly to the insurance company, that income is not counted. Because of World War 2 wage and price controls, and to avoid being taxed under the income tax system, most employee benefits never touch the employee’s pocket, and are not counted as income. This becomes important when something not counted, benefits, grows much quicker than the income that is counted, or money received.

Since 1970, real hourly wages have grown only 3%. Bernie Sanders and other Democrats use a similar figure to press for more social welfare programs. Total hourly compensation has grown 60% (Fed Reserve blog) and most of that is not included in household income.

HourlyWagesVsTotalComp

Is it a rabbit or a duck?

////////////////////////

Do Millennials have it worse than Boomers did at this age?

I’ll call them the Mills and the Booms, so I don’t wear out my fingers. The Mills were born about 1982-2001 so they are 17 – 36 years old today.  A decade after the worst recession since the Great Depression, home and apartment prices are rising fast in many urban areas.  Mills are now the largest generation alive and are at an age when a majority of  them are independent and increasing the demand for housing.

Some Mills are trying to provide shelter for their families when the competition for housing puts constant upward pressure on prices. Some Mills are paying off student loans, while paying $800 to $1000, or more in California, to share a 3 bedroom house with  two other people. It is stressful.

The Booms were born approximately 1946 – 1964. The youngest are 54; the oldest are 72. When the Booms were 17-36, the year was 1982, and oh, what a year it was. The Booms had just endured a decade of double-digit inflation rates (it is now less than 2%), four recessions, mortgage rates that were considered a “bargain” at 9% (4% today), and high housing and apartment prices because there was so much demand for living space from this post war baby boom.

Oh, and tax increases. Tax rates were not indexed for inflation till 1985, so higher wages each year to keep up with that double-digit inflation meant that many workers were kicked up into a higher tax bracket each year. One of Ronald Reagan’s campaign promises was to stop the sneaky practice of dipping deeper into worker’s pockets every year. He got elected President, beating President Jimmy Carter who had told workers to turn the heat down and put a sweater on.

How do today’s monthly debt payments compare? Household Debt Service Payments as a percent of disposable personal income are 5.8% today compared to 5.6% in 1982. The 37-year average is 5.7% (Federal Reserve).

What are those average debt service payments buying? Better cars, more education, more square footage of housing space per person, and computers and electronics that didn’t exist in the 1980s. People are paying more for housing but are enjoying 30% more square footage per person (Bloomberg). In 1982, 17% of the population 25 years and older had a college degree. Today, it is double that percentage (Census Bureau table A-1), an achievement that the Mills can be proud of.

The Mills do have it better than the Booms, who had it better than the generations before them. That “good old days” talk that we heard from Bernie Sanders on the campaign trail are based on some foggy memories. The reality was way tougher than Sanders remembers or talks about because his perception is clouded by his ideology. He only sees the data that tells him it’s a rabbit. He doesn’t see the duck.

Could Trump Be Right On Trade?

May 6, 2018

by Steve Stofka

On Tuesday morning I had an epiphany. Some background first. I disagree with Donald Trump about many things. One of them is his fundamental tenet of international trade: it creates winners and losers. This violates an established principle of economics: comparative advantage. Trade between countries benefits the people of both countries, or a win-win. That is Principle #5 in Greg Mankiw’s Principles of Economics taught in many colleges and universities. From the textbook (6th Ed): “Trade allows countries to specialize in what they do best and to enjoy a greater variety of goods and services.”

Here’s Professor Trump on trade with the Japanese during their boom years in the late 1980s: “First [the Japanese] take all our money with their consumer goods, then they put it back in buying all of Manhattan. So either way, we lose.” (1990 Playboy interview quoted in National Review).

As I put my dishes in the dishwasher, a memory from a 1989 Christmas party in Los Angeles flashed through my mind. I was visiting from Colorado, doing more listening than talking. At the party were several people in real estate, construction and software development.

One guy complained that the Japanese were buying up chunks of California and there should be a law limiting their ownership. The comment began a spirited discussion and I sensed the resentment in the group. I asked if the Japanese owned that much California real estate. They were able to name landmark office buildings and vineyards.

As was my habit, I made a note to find out how much California real estate the Japanese did own. The Japanese had bought a few headline grabbing commercial properties, but they owned less than 1/10th of 1% of California real estate. The number of Japanese investors who bought homes did affect ordinary Californians, however. The percentage of homes bought was small but helped drive up prices, and fueled resentment of the Japanese.

The principle of comparative advantage is modeled on trade in goods. Real estate is different. That’s the point that I missed at the Christmas Party almost thirty years ago. Real estate is an investment whose present value is based on an estimate of future cash flows. A common refrain is “location, location, location.” Unlike an investment in a plant or machinery, real estate often consists of two types of asset: 1) a building, which has a limited, depreciable life; and 2) la location that has an unlimited, and appreciable, life. The first part is like a bond. The second part is like a stock. Real estate is a hybrid product of both asset types.

Let’s go to the first part of Trump’s statement: “First [the Japanese] take all our money with their consumer goods.” Let’s follow the money with an example. A company called Taro has a factory in Japan (not financed with U.S. dollars) that makes computers which it sells to U.S. consumers. Because Taro is making so many of these computers, people and peripheral businesses move near the factory.  This drives up the value of the factory’s real estate in Japan.

Taro’s capital is better deployed at making computers, so it sells the factory and land to a private equity firm, from which it leases back the factory. Taro then invests the U.S. dollars it has accumulated from computer sales, plus part of the proceeds from the sale of its real estate in Japan, to buy an office building on 5th Ave in Manhattan, that I’ll call Fifth.

To buy Fifth, Taro must outbid another buyer for the property, a U.S. investor I’ll call Bulldog. The higher price that Taro pays implies that the future cash flows from Fifth will be more than Bulldog’s estimate. If those future cash flows are mis-estimated by Taro, then Taro has introduced a form of bad money into the economic system of New York real estate. Gresham’s law states that bad money tends to drive good money out of circulation. We’ll see that the principle applies here.

There are two parts to Taro’s equity in Fifth. The first is the profits in U.S. dollars from selling computers to U.S. customers, a re-bundling of U.S. dollars. The second part is the profits from the real estate frenzy in Japan. What fueled the lofty sales price in Japan? Rosy estimates of future economic activity, robust cash flows, and a limited supply of property in desirable areas of Japan. Taro has transferred that frenzy, and risk, from a property in Japan to a property in the U.S.

Banks and other credit institutions, both U.S. and foreign, fund the rest of the sale. Because Taro has more equity to put into the property than Bulldog, the ratio of financed principle to Taro’s equity may be nearly the same as Bulldog’s proposal (the numbers are at the end below).  The rosy estimates that drove the Japanese valuation now influence, or infect, the wider international finance community as well.

Because the U.S. is not in a boom, Bulldog may not have access to the same funds and credit that Taro does.  This puts Bulldog at a disadvantage. Bulldog does not buy the building. No big deal, right? He’ll just buy another property with a more reasonable evaluation. But, wait. At any one time, only a fixed amount of credit money is available at a particular interest rate. The money that a bank lent to Taro for its acquisition is no longer available to Bulldog at the same interest rate for his buy of another property. Taro’s purchase, fueled by speculation in Japan and agressive estimates of cash flow in New York, will cost Bulldog money.

Economic models of comparative advantage tend to ignore the financing aspect for two reasons. Money is regarded as neutral in economic models, and the machinations of international finance are difficult to model.  The competition for credit is global and fierce, fought by vast private and public pools of capital and policy.  Those who buy and sell premium real estate in markets like New York City are regularly reminded of the fact.  They put their textbooks down and come out fighting.

//////////////////////

The numbers:  For every $100 in price that Bulldog offers, Taro offers $110. To finance Bulldog’s offer, he can put up $20 for every $100, or 20%. Taro can put in $27.50 for every $110 of its offer. In Bulldog’s case, $80 is financed. In Taro’s offer, $82.50 is financed. Taro has a leverage of 4-1 ($110 / $27.50), compared to Bulldog’s leverage of 5–1 ($100 / $20). Taro’s leverage looks safer. Its future cash flow estimates are 10% higher, but the finance ratio on the deal is only 3.1% higher ($82.50 / $80). If Taro’s cash flow projections are 5% too high, a lender calculates that Taro can still make payments.