Debt Equity Ratio

June 28, 2015

Ding, ding, ding!  I was surprised to see that this is my 500th blog article!

As I noted last week, the stock market has traded in a fairly tight range for the past six months.  Some market seers see this as a topping pattern before either a crash or a serious correction.

Money not spent on current consumption can be invested in past spending – debt – or tomorrow’s spending – equity.  Stocks rise when more people shift money toward tomorrow’s spending in the hopes of better corporate profits.

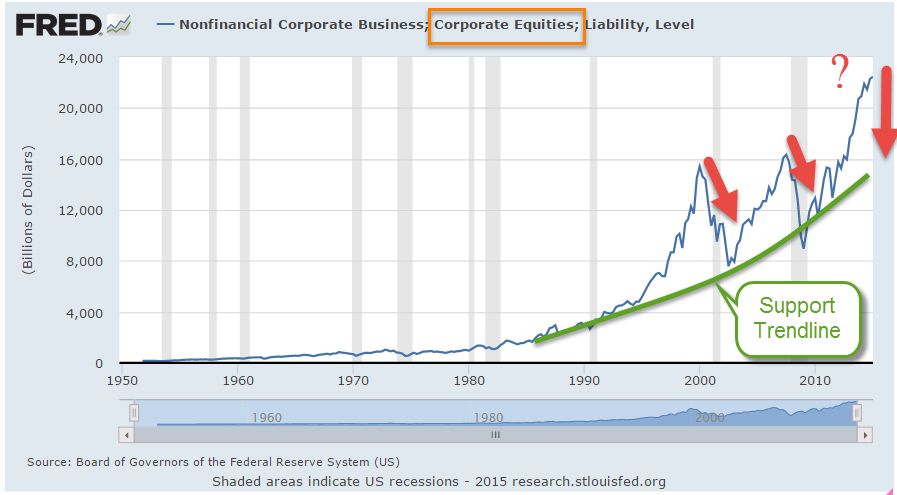
Last week I estimated the equity market at about $25 trillion.  The latest Federal Reserve Flow of Funds report puts the value of corporate equities at $22.5 trillion at the end of March.  A time series graph of the Fed’s valuation of non-financial corporate equity might give an investor some pause as it is 50% above the worst case scenario base trend line.

Using a middle of the road trend line, we see a market valuation that is 20% above trend.

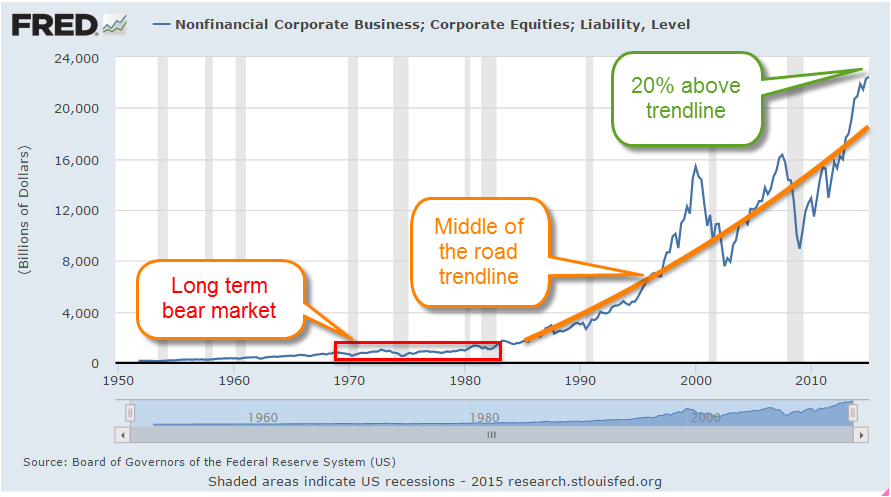
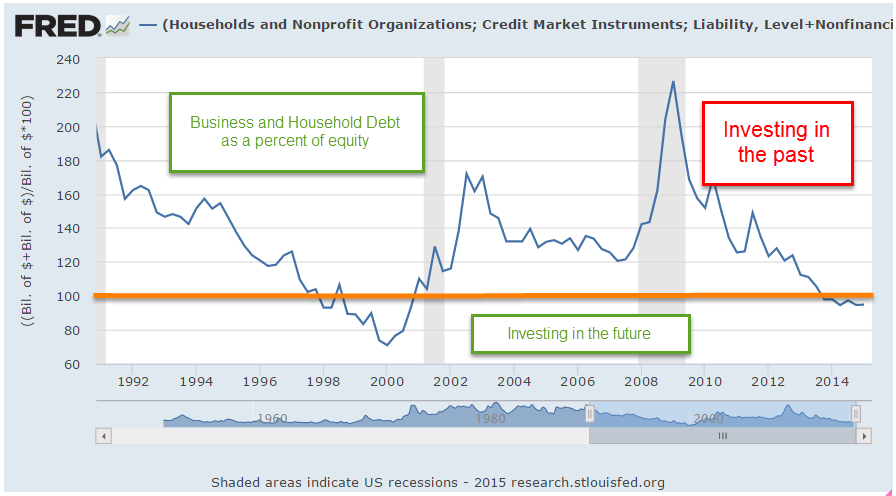
On the chart above, I have outlined the long term bear market from 1968 – 1982.  That 14 year period of negativity might be a poor starting point for a trend line for the following thirty years.  Let’s take government debt out of the picture for a minute and look at the ratio of household and non-financial business debt to corporate equity valuations.  As the graph below shows, climbing stock prices (the divisor in the ratio) lower the ratio of debt to equity and signal a growing confidence in the future- or does it signal an overheated market?

 Let’s add in government credit market debt, which will shift the ratio of debt to equity up.

We can see the stock market peaks in 1968 and 2000 when the market entered a long term decline called a secular bear market.  Notice that the ratio at the start of the financial crisis in 2008 is about the same as today but that neither was at a peak or trough level.  Now let’s add in the credit market debt of the financial sector.

This again raises the percentage of debt to equity and subtly changes the pattern of the ratio.  We see the go-go years of the 1960s as a decade of confidence, perhaps too much confidence fed by an upsurge in defense spending.  Rising inflation, debt and the slog of war began to erode that confidence and lead into the secular bear market that started in 1968.

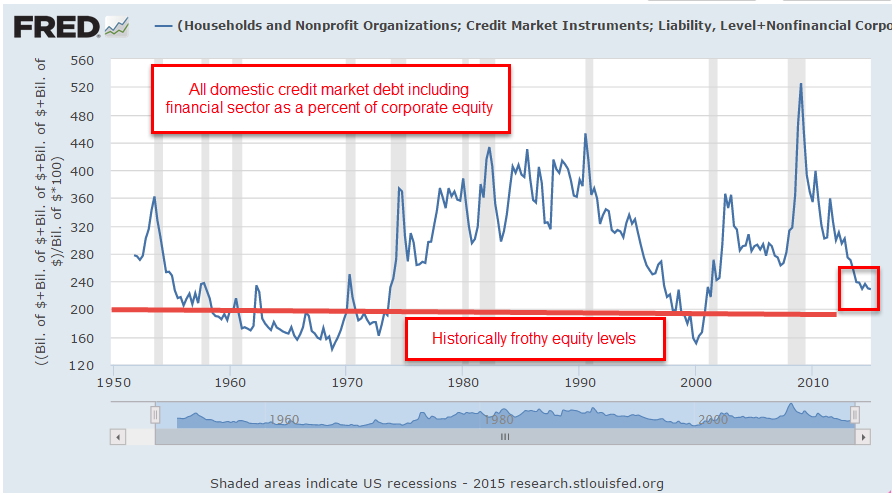
In the late 1990s we can see the ratio approach the same levels as in the late 1960s.   It is in this chart that we see a revealing characteristic that marked the period before the financial crisis.  Although stock market prices were rising, housing market debt was rising as well so that the ratio of debt to equity stopped falling after the recession of 2001 and the start of the Iraq war.  That halt in the debt-equity ratio signaled an uncertainty in future profits, tugging new investment dollars toward the past.

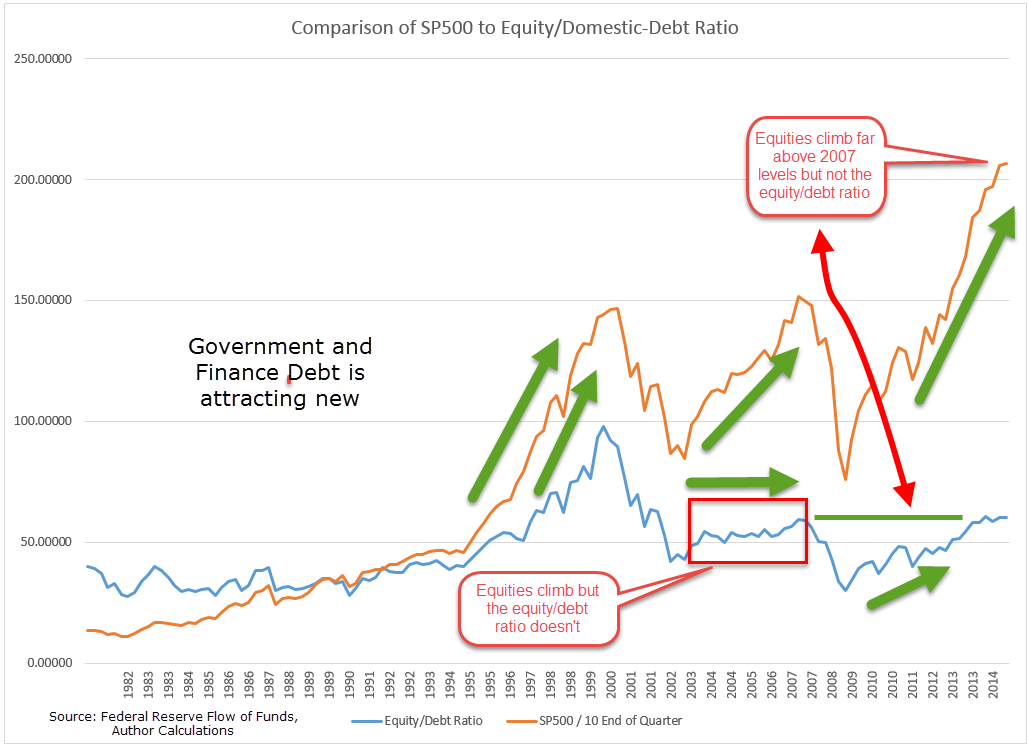
This trend of accumulated debt attracting new investment dollars is clearer if we reverse the ratio, showing the equity/debt ratio.  In the 1990s, equities climbed and the equity/debt ratio climbed as well.  In the mid-2000s, equities again rallied but the equity/debt ratio stayed relatively flat, indicating that investors were putting dollars into debt instruments as well as the stock market.  Since the financial crisis, equities have climbed far above the market levels of 2007 but the debt/equity ratio has recovered at a much slower rate.  Despite historically low interest rates, high government debt and finance debt continues to attract investors’ money.

Current stock market valuations are moving the ratio toward the future but investment in the spending of the past continues – until the 30+ year bull market in bonds reverses and investors abandon a falling bond market for the equity market.

The Future is Past

June 21, 2015

Returning to our Heaven On Earth scenario: why can’t the government just print up a bunch of money and give it to people?  Centuries of historical data shows that inflation inevitably results when governments do this.  However, the Federal Reserve has pumped in almost $4 trillion dollars in the past seven years and no inflation has resulted.  We saw that the Federal Reserve has been offsetting the lack of private spending, particularly the lack of savings that is devoted to investment.

Whatever we don’t consume is called savings.  Savings can be put to two different uses:

1) Invest in Yesterday’s spending, or debt.  This can be either our own debt or the debt of others.  We might pay down a credit card balance we owe or a mortgage.  We might buy a corporate or government bond.  Savings, checking and money market accounts are an investment in debt.

Household and business non-financial credit market debt is more than $21 trillion.  Included in that amount is $9.3 trillion in home mortgages.  Most of us who buy a home don’t think of it as “yesterday” spending.  To us it is an investment in our future.  However, the purchase of a home consists of two components:
1) the transfer of the replacement cost of the dwelling – yesterday’s spending adjusted for the change in price of the labor and material to build the home.
2) Someone else’s profit, and this is the key component of these two types of spending, yesterday and tomorrow.  Whether buying a new home or existing home, we are buying the costs and profit of the builder or previous owner.

Below is a chart of household and business non-financial credit market debt as a percentage of GDP.  From 1980 through the end of 1994, the SP500 index quadrupled from 110 to 470, an annual gain of a bit over 9.5% per year.   In the mid-1990s, household and business debt started a steep climb to 140% of GDP by 2007 and this probably pulled in more savings to service that debt. In the next 15 years, the SP500 grew by only 233%.

But wait!  That’s not all! – as the late night commercials remind us.  Governments at all levels borrow savings from private households and businesses.  The current total is about $16 trillion.

Adding the $16 trillion government debt to the non-fianncial debt of the private sector totals $37 trillion of yesterday’s spending that needs to be fed with today’s savings..

2) The other option for savings is to invest in equities – Tomorrow spending – and the profits generated from that spending.  We might buy stocks, real estate or some other physical asset which will generate some production, a profit, or a capital gain from an appreciation in the value of that asset.  The World Bank estimated the total market capitalization in the U.S. in 2012 at $18.7 trillion.  Add on 33% or so since then to get an updated total of about $25 trillion.  We could debate the valuation but it is clear that debt – investment in yesterday’s spending – is clearly winning the race against investment in the profits of tomorrow’s spending.

If future growth looks modest it is because we are still in a defensive posture – weight on our back foot, so to speak. Low interest rates encourage investment in Tomorrow spending and the Federal Reserve has kept rates low to encourage us to lean in, to shift the weight, the energy of our investment from the past to the future.

Wage Growth Rings

June 14, 2015

The broader stock market has been on a continuous upswing since November 2012 when the weekly close of the SP500 index briefly broke below the 48 week average.  The past six months is one of those periods when investors seem undecided.  Even though the market is above its 24 week average, a positive sign, it closed at the same level that it was just before Christmas.  Earlier this week came the news that Greece might avoid default on its June payment to the ECB and the market surged upwards. At the end of the week, news that talks had broken down caused a small wave of selling on Friday morning. Investor reaction to what, in perspective, is a relatively small event, indicates an underlying nervousness in the market.

As the SP500 began a broad upswing in late 2012, the bond market began a downswing.  A broad aggregate of bonds, AGG, fell about 5% over the following ten months before rising up again to those late 2012 levels this January.  In the past five months, this bond index has declined almost 4% as investors anticipate higher rates. A writer at Bloomberg notes a worrisome trend of concentrated ownership of corporate bonds.

Retail sales in May showed strong gains across many sectors in the economy. As the chart shows, growth below 2.5% is weak, indicating some pressures in household budgets that could be a precursor to recession.  Current year-over-year growth in retail sales excluding food and gas is up almost 5% – a healthy sign of a growing economy.

*************************

Wage Growth

“Since 2009, when the great monetary experiment began, global bond markets have increased in value by about $17 trillion. Global equity markets have increased by about $40 trillion. The average worker has seen wages increase by about $722 billion, which means about 2% of the benefit of QE (quantitative easing) went to workers. The rest went to asset prices.” (Source)

A cross section of a tree shows a historical pattern of rainfall, temperature and volcanic activity.  Wage and salary income across a population can provide a similar historical picture of the economic climate of a people.  The recovery from the recent recession has been marked by slow growth in wage and salary income relative to the growth rates of previous recoveries.

Economists find it difficult to reach a consensus to explain the muted growth.  A WSJ blog summarized a number of explanations.  I have noted several of these in past blogs.  They include:

Slack in the job market.  However, the labor dept reports that the number of job openings is at a 15 year high. (BLS Report)

Some economists point to the large number of involuntary part timers, those who want a full time job but can’t find one, as an indication of slack in the labor market.

The number of people quitting their jobs for another job is improving but is still weak by historical standards.

Sluggish productivity growth. Multi-factorial productivity growth estimates by the labor dept show that productivity gains in the past 15 years are chiefly from capital investment, not labor productivity.  Capital productivity during the recovery has been slow but labor productivity has been terrible, according to multi-factorial productivity assessments by the BLS.  As the century turned, we applauded the transition toward a more service oriented economy.  Less pollution from manufacturing industries, we told ourselves.  “The service sector is less cyclic,” economists reminded us.  It is much more difficult to wrest productivity gains from many service sector jobs. The cutting of a lawn, the making of a latte – there is a minimum threshold of time to do these things.

The sticky wages theory: namely, that companies withhold raises during the recovery because they couldn’t cut wages during the recession.

Let’s compare income growth to retail sales growth, using the data for retail sales less  food and gas whose prices are more volatile.  Periods when both growth rates decline set the stage for recessions.  Periods when both rates increase mark recoveries.

Simultaneous declines in 2011 and 2012 prompted stock market corrections.  The upswing of the past two years has contributed to the rising stock market.

Sugar Daddy

June 7, 2015

Older readers may remember Bizarro Superman, the mirror image of Superman, who did things backwards, or in reverse.  That’s the world we live in today; good news is bad, and vice versa.  The employment news was doubly good.  Job gains were stronger than expected at 280,000 but more importantly the unemployment rate went up a smidge, and for the right reasons.  As people become more confident in the job market, they re-enter the labor force, actively looking for work.  Discouraged job applicants have fallen 20% in the past twelve months.  The civilian labor force, the sum of employed and the unemployed, has grown.

Is good news good or bad?  If only the news would wear a hat, white or black, so we could tell. In Friday’s trading, investors bet on the timing of the Fed’s first interest rate increase.  September of this year or the beginning of 2016? When will Sugar Daddy, the Fed, take away the punch bowl of easy money?

The core work force, those aged 25 – 54 who drive the economy, continues to show growth greater than 1%.

Although hourly wage growth for all private employees has been modest at 2.3% annual growth, weekly earnings for production and non-supervisory employees have risen 30%, or 2.7% per year in the past decade, a period which has included the worst downturn since the 1930s depression.  This more positive outlook on wage growth does not fit well with some political narratives.

The decade from 1995 – 2005 had 36% gains, or 3.1% annual growth, only slightly above the gains of the past decade and yet this period included the go-go years of the dot-com bubble and the housing boom. Inflation was higher in that decade, and in inflation adjusted dollars, the earlier period was only slightly stronger than this past decade.  In short, we are doing suprisingly well considering the negative impacts of the financial crisis.

************************

CWPI

Every month I update the Constant Weighted Purchasing Index, a composite of the Purchasing Manager’s monthly index published by the Institute for Supply Management.  This month’s reading was similar to last month’s, continuing a trough in the strong growth region of this index.

**************************

Heaven On Earth

Last week I asked the question: Why can’t a government with a fiat money system simply give everyone a lot of money and create a heaven on earth?  The standard answer is that it would cause inflation.  For several millennia, when a government injects money into an economy, inflation soon follows as the supply of purchasing power increases without a concurrent increase in the supply of goods and services.  In the 18th century philosophers David Hume (On Money) and Adam Smith (Wealth of Nations) noted the phenomenon.  Peter Bernstein’s Power of Gold recounts ancient examples of kings and governments debasing metal monies and the inflation that ensued.

In the seven years since the recession began in late 2007, the government has borrowed and spent $27,000 per person and there has not been the slightest hint of inflation. Why? There are several reasons.  If a government borrows money from the private sector, there is no net injection of money into the system, no printing of money. A Federal Reserve FAQ on printing money is careful to note that “printing money” is the permanent financing of a government’s debt by a central bank.  Whatever people want to call it, when the Federal Reserve buys government debt, new money is injected into the system.  Since 2007, the Fed has injected almost $4 trillion (Balance Sheet), or about $12,000 per person, of new money without an uptick in inflation.  How is this possible?

There are two types of spending – today and tomorrow.  Spending for today is consumption.  Spending for tomorrow is investment.  Both types of spending drive demand for goods and services.  The paucity of private investment since 2007 is at levels not seen since the years immediately following World War 2.

Although government investment is a relatively small percentage of GDP, that has also fallen to historically low levels.

The sum of private and government investment as a percentage of GDP is shockingly low.

If we use 2007 investment levels as a base, the accumulated lack of investment is far more than the $4 trillion that the Fed has pumped into the economy.

The Fed’s injection of money into the system is primarily spent on government consumption, or today spending, which is helping to offset the lack of investment spending.  As investment spending rises, the Fed has been able to stop adding to its portfolio, although this “tomorrow” spending is still so low that the Fed can not begin to lighten its portfolio of government debt.

Advocates – economist Paul Krugman for one – of greater government investment spending, even if it borrowed money, hope to offset the lack of private confidence in the future.  Previous government stimulus spending did have little effect on overall economic growth simply because it did little more than offset the lack of long term confidence by those in the private sector.