The Ghost of the Past

December 25, 2022

by Stephen Stofka

Merry Christmas and Happy Holidays! This last letter of the year will be about choices and wishes, about means and ends. Aristotle distinguished between choice as a means and a wish as an end. A wish can be an illusion of choice, but it is not a choice. A choice is a path toward a wish. A wish is the reason for making a choice. Understanding the role of choice and wish in our lives can help us become more prudent investors.

A principle of economics is that choice involves an opportunity cost, the giving up of one thing for another. A child who wishes to be a basketball star soon learns that this requires many hours of layups and passing drills, shooting foul shots and other exercises that are the means to achieve that wish. The time spent doing those activities cannot be spent on some other activity and is an opportunity cost. An opportunity cost is a sunk cost that should not factor into our next decision but people have a natural aversion to loss. Investors are cautioned not to “marry” their investments, meaning that we shouldn’t stick with an investment simply because we don’t like taking a loss.

A post hoc analysis of a series of events may yield little useful information that will guide us in future choices because the pattern of events and choices will likely not be repeated. A seasoned executive of a bankrupt company may make a post-mortem comment, “We expanded too fast for our target market.” When we spend time analyzing a chain of decisions within a unique set of circumstances we do not spend time doing something else. We are lured by the illusion that the ghosts of past events can communicate with the ghosts from our future, that we can learn from the past. Most of the time, we can’t.

“I should have sold this spring when it was near 50 and rates were low,” a guy in front of me in the checkout line remarked to his friend, then they stepped forward to one of the self-checkout machines. I guessed they were talking about Bitcoin and mortgage rates. We judge the quality or accuracy of our choices by the information or insight we gain later. We can drive ourselves crazy with this type of time travel.

During the past two decades, the median sales price of a home has increased 4.7% per year. Disposable (after tax) personal income has risen only 4.1% per year. House prices in relation to disposable income is near the height of the 2000s housing bubble, as shown in the chart below.

A 20% down payment on a conventional house mortgage is a wish that takes a long reach. Choices include an FHA loan with a smaller down payment, cutting back on expenses or working an extra job for additional income. To some, Bitcoin was another choice, an asset whose value would increase faster than the average 10% annual gain in stocks or the paltry interest paid by savings accounts during the past decade. A $10,000 purchase of Bitcoin might grow to the size of a conventional down payment in just a few years. Even though Bitcoin’s price has fallen dramatically from the heady levels of $65,000 in November 2021, the price is still double its $8,000 price in January 2020. That is an annualized gain of almost 20%, double the 9.45% average annual gain of the SP500 total return (2022).

Each year is an unfolding narrative with no dress rehearsals. To alleviate the uncertainty, we look to the past and extrapolate into a future guaranteed to be unlike the past in significant ways. We wish we could predict the future, but our choices help construct our future. We can only look in front of us.

/////////////////////////

Photo by Kalen Emsley on Unsplash

S&P 500 Total Return Index, [SP500TR], retrieved from https://finance.yahoo.com/quote/%5ESP500TR/history?period1=1041292800&period2=1671753600&interval=1mo&filter=history&frequency=1mo&includeAdjustedClose=true, December 23, 2022.

U.S. Census Bureau and U.S. Department of Housing and Urban Development, Median Sales Price of Houses Sold for the United States [MSPUS], retrieved from FRED, Federal Reserve Bank of St. Louis; https://fred.stlouisfed.org/series/MSPUS, December 24, 2022.

U.S. Bureau of Economic Analysis, Disposable household income [W388RC1A027NBEA], retrieved from FRED, Federal Reserve Bank of St. Louis; https://fred.stlouisfed.org/series/W388RC1A027NBEA, December 24, 2022.

U.S. Census Bureau, Household Estimates [TTLHHM156N], retrieved from FRED, Federal Reserve Bank of St. Louis; https://fred.stlouisfed.org/series/TTLHHM156N, December 24, 2022.

The Misery Index

December 18, 2022

By Stephen Stofka

This week’s letter is about a measure of economic discomfort that economist Arthur Okun developed in the 1960s. In the early 1980s President Reagan renamed it the “misery index.” Weather forecasters calculate a misery index of temperature and humidity. Okun’s measure of discomfort added the inflation rate and the unemployment rate. How reliable is this weathervane of human misery? Let’s focus on those points where the index touched a medium term low.

We can begin in the mid-60s as society began to rupture. Young people protested the restrictive norms of the post-war society when employers regarded a man whose hair was longer than “collar length” as unkempt. Polite women wore white gloves to church and formal affairs. In northern cities black people rioted over the prejudice that prevented them from access to business loans in their own neighborhoods. By law, federal home loans were not available to people who lived in “redlined” majority black neighborhoods. The courts and Indian agencies disregarded the property and civil rights of Native American families. There was a lot of misery that was not measured by the misery index.

The late 1990s – another relative low in the misery index – were a heady time. The internet and Windows 95 was but a few years old and investors were exuberant about the “new internet economy.” Fed chairman Alan Greenspan warned of “irrational exuberance” and economist Robert Shiller (2015) wrote a book of that same name, introducing his cyclically adjusted price earnings, or CAPE, ratio. Investors based their valuations on revenues, not profits. In a rush to dominate a market space, companies spent more to acquire a new customer than the revenue the customer brought in. Investors rejected “old economy” manufacturing companies like Ford and GE and turned to the new economy stocks like  Microsoft, Sun Microsystems, CompuServe, AOL and Netscape, companies that connected computers and people. Neither Google nor Facebook existed. Amazon was a company that sold books online. Pets.com raised $83 million at its IPO on the promise of convenient pet food delivery. In the summer of 2000, the air started leaking from the “dot-com” bubble. By the spring of 2003, the SP500 was down 42% from its high. None of that investor misery was captured by the misery index.

The index touched another low in early 2007, a year before the beginning of the 2007-09 recession and the Great Financial Crisis. This time investors were exuberant over both housing and stocks. The top bond ratings companies, like Moody’s and S&P, dependent on the fees they collected from Wall Street firms, slapped Grade AAA stickers on the subprime mortgage backed securities their customers wanted to underwrite. Financial companies played regulatory agencies against each other, choosing the one with the most relaxed standards and supervision. Whiz kids in the back rooms of major financial firms developed trading models that blew up within a few years. Some of the largest companies in the world, champions of the free market who consistently fought regulations, ran to the government with their hands out, pleading for bailouts.  In the 3rd quarter of 2008, Lehman Brothers collapsed and threatened to take down the rest of the financial system. The misery index rose to 11.25%, slightly below our current reading of 11.88%. If the misery index were a tape measure, a carpenter would throw it in the garbage as an unreliable tool.

The collapse of oil prices in 2014 shifted the misery index to another low in 2015. After a decade of near zero interest rates, housing and stock prices had again reached nosebleed levels and the index dropped to another low in late 2019. Was that a harbinger of a coming financial crisis? We never did find out. Within six months, the pandemic crisis struck.  

The misery index is an unreliable measure of discomfort but a good measure of investor exuberance. Medium term lows are an indicator that investor optimism and asset valuations are too high. Relative index highs like the current 12% mark a period of excess investor pessimism. Sometimes a lousy tape measure can be useful after all.

///////////////////////////

Photo by patricia serna on Unsplash

Shiller, R. J. (2015). Irrational Exuberance: Revised and Expanded Third Edition. Princeton University Press.

//////////////////////////

A Money Evolution

December 11, 2022

by Stephen Stofka

This week’s letter is about biological and monetary evolution. Darwin proposed that biological evolution is a process of adaptation to one’s environment. Herbert Spencer, a contemporary, coined the phrase “survival of the fittest” and Darwin adopted it but came to regret it. His theory argued that species survived not because they were the strongest or most able but because they fit the environment. Sean Carrol (2006) titled his book The Making of the Fittest but his book could have been more appropriately titled The Making of What Fits. The genetic process does not produce a series of super species because such a species would overwhelm or consume its environment. A species develops attributes that help it cope with its genetic defects and this adaptation helps it find a niche within its environment. 

As an example, the skin of dogs and cats cannot synthesize Vitamin D from sunlight. They must get it from their diet, from other creatures who can store Vitamin D (Zafalon et al., 2020). Dogs and cats partnered with a species who provides a steady diet of meat directly or indirectly. People store grain which attracts rodents and small mammals, a source of Vitamin D for cats and dogs. Cats and dogs have a far greater range and sensitivity of hearing and seeing, making them excellent sentries and hunters of small animals. Money is not a species, but a direct mechanism of exchange and an indirect property relationship. Still it has and continues to evolve.

Gold and other “hard” currencies have survived for centuries. Gold is durable yet malleable but so is iron which people have made into tools since the first cities and towns formed many millennia ago. Iron is a common element but in metal form, it oxidizes. Gold does not, but it is found in few places on earth, a characteristic defect that humans adopted as a money. However, the inflexible supply of gold produces deflation, a rise in its exchange value and a fall in the price of goods. Because of this, gold does not adapt well to growing economies. Investors are hesitant to support new ventures if the price of their produced goods are likely to fall. In Part 2, Chapter 2 of the Wealth of Nations Adam Smith noted the critical shortage of hard currency in the growing economies of the American colonies. In 1764 Parliament had passed a law making the issue of paper money illegal and this rightly angered the colonists. Because they were unrepresented in Britain’s Parliament, they had no say in policymaking.

Paper or fiat money solves the supply problem of hard currency. However, it’s characteristic defect is the opposite of hard currency – inflation brought on by the supply of too much money. That apparent ease of supply is deceptive. Fiat money requires a framework of financial institutions, a number of supervisory institutions to monitor the system and an enforcement force to punish counterfeiters. These institutional costs offset the relatively inexpensive cost of fiat money. To respond to inflation a central bank can increase the price of future money or credit. A sixty year regression of a key interest rate, the Federal Funds rate, and inflation shows that they respond to each other.

The model for Bitcoin (specifically, not just any digital currency) is more organic, exhibiting an S-curve growth path like rabbit populations and anything that is bounded by the resources of its environment. Bitcoin enthusiasts tout its strength as an exchange mechanism without the enabling framework of central bank and a network of financial institutions. It is democratic and trustless. Critics point out that the broader digital currency market is riddled with manipulators like Sam Bankman-Fried, the CEO of FTX and co-owner of Alameda Research, both of which owe billions to depositors. SBF has agreed to testify this coming Wednesday at both House and Senate committee hearings. Bitcoin advocates counterargue that crises unfold regularly in the current fractional reserve banking system because it is subject to fraud and poor risk management.

 Unlike fiat money, Bitcoin and gold share the characteristic defect of deflation. A rising exchange value of gold or Bitcoin attracts investors who support mining ventures for more gold or Bitcoin. When supply meets or exceeds demand, the exchange value falls and the miners may not be able to repay their loans.  Robert Stevens (2022) at Yahoo! Finance details the debt crisis of several Bitcoin miners who borrowed heavily to finance the purchase of mining machines during the crypto bull market but held onto what they mined. Clean Spark is a miner that sold more than two-thirds of what they mined. While the more aggressive firms may default on their loans, those like Clean Spark with cash can buy a mining machine for 10 cents on the dollar.

Like fiat money, Bitcoin exchange requires a global electronic and communications network. The mining of Bitcoin requires a vast network of suppliers of mining machines and a less expensive supply of electricity like hydropower or nuclear, both of which are in far greater supply than gold. Although Bitcoin is not physical, its shared location means that it is impervious to fire and easily portable. Like the U.S. Constitution, the rigidity of Bitcoin’s supply model gives it stability but makes it an inflexible instrument to address economic or social change.

Fiat money and gold have evolved together because they have opposite defects that complement each other. Fiat money depends on a trust in a government authority, is easily portable and tends toward inflation. Gold is physical and durable, does not rely on trust and tends toward deflation. Bitcoin is a mule, sharing characteristic defects with both fiat money and gold. Bitcoin shares gold’s tendency toward deflation, but is not physical. Bitcoin cannot replace gold until it can be made durable like gold. Bitcoin is more easily transported than fiat money but does not rely on trust in an authority. Bitcoin cannot replace fiat money unless it can be made to tend toward inflation. In the next century, fiat money, Bitcoin and gold may evolve together without replacing each other.

///////////////

Photo by Krista Mangulsone on Unsplash

Stevens, R. (2022, December 9). Bitcoin miners took on billions in debt to “pump their stock,” leading to a crypto catastrophe. Yahoo! Finance. Retrieved December 9, 2022, from https://finance.yahoo.com/news/bitcoin-miners-took-billions-debt-113000061.html

Zafalon, R. V., Ruberti, B., Rentas, M. F., Amaral, A. R., Vendramini, T. H., Chacar, F. C., Kogika, M. M., & Brunetto, M. A. (2020). The role of vitamin D in small animal bone metabolism. Metabolites, 10(12), 496. https://doi.org/10.3390/metabo10120496

Wages and Services

December 4, 2022

by Stephen Stofka

This week’s letter is about the effect of wages on inflation. In an address this week, Fed (2022) chair Jerome Powell explained the Fed’s view of the latest trends and signaled that the Fed might ease up slightly on a rate increase at its December 13-14th meeting. Friday’s jobs report had stronger than expected gains so that may temper the Fed’s willingness to ease up on the “rate brake.” In his speech, Powell cautioned that “nominal wages have been growing at a pace well above what would be consistent with 2 percent inflation over time.”

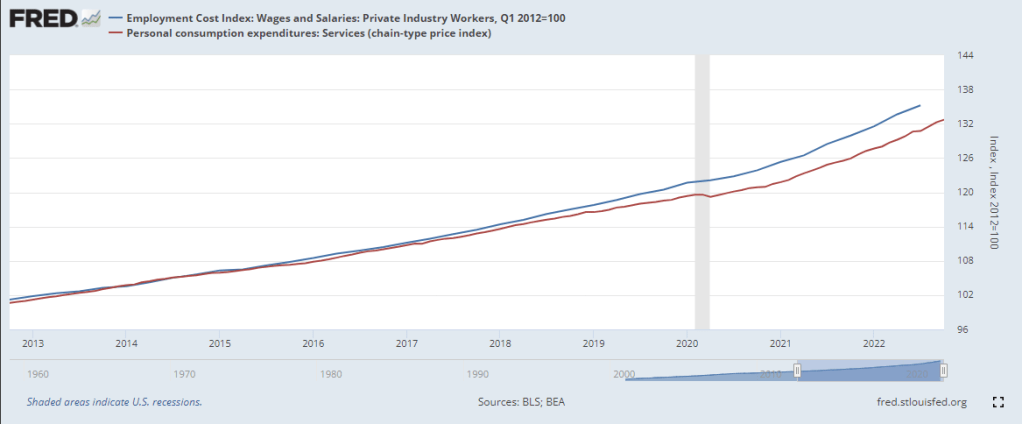
The services portion of the economy consists of mostly labor so the Fed focuses on just that sector to gauge the underlying demand for labor. In the graph below are total wages and salaries (blue line) and the services sector (red line). Both series bent upward from their pre-pandemic trends but the Fed is focused on the upward momentum of wage increases (blue line) as an underlying driver of “core” inflation.

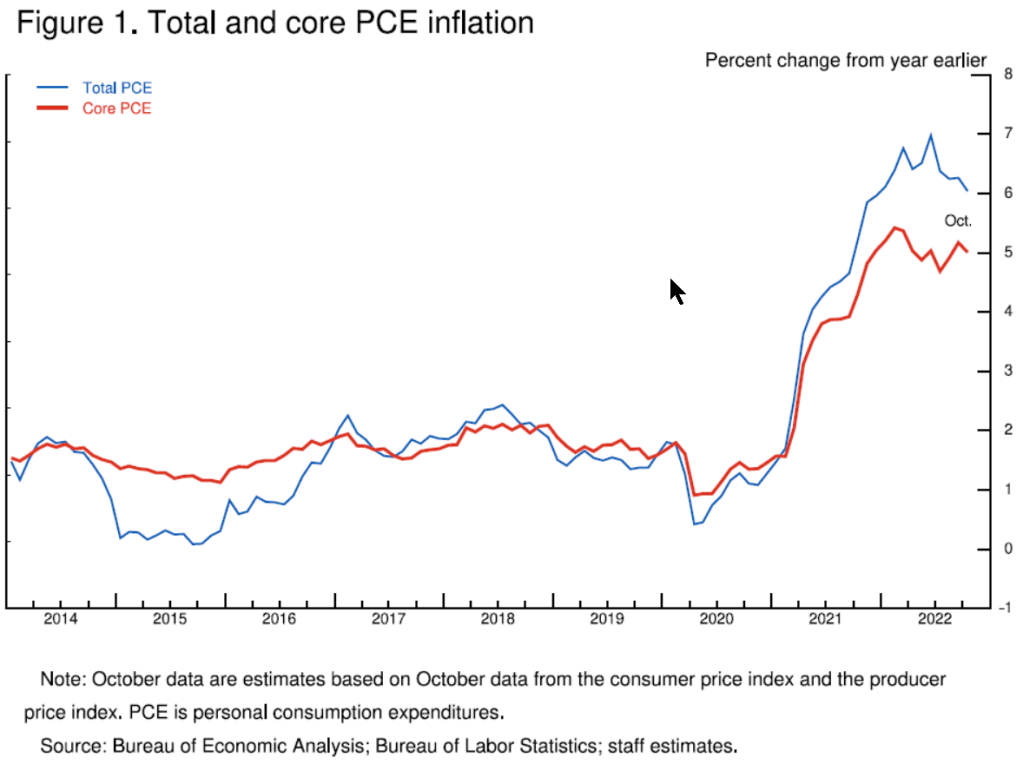
Core inflation does not include volatile food and energy prices. Those matter a great deal to consumers but the variance makes it more difficult to predict a future price path. Imagine walking a dog on a leash down a park path. The dog might dart from side to side to sample the smells along the path but the walker stays more centered on the path. An observer who could not see the path would likely watch the person rather than the dog to predict the direction they were taking. Below is a chart from Powell’s presentation.

On a long-term basis there are two trends that are likely to produce upward wage pressures. Growth in the working age population has slowed and the participation rate has declined. Since the beginning of 2021, wages have increased 11%. The labor force has increased only 3%, partly due to demographics and partly due to a participation rate that is 1% less than the pre-pandemic level. Should the trend continue, it will affect the supply of workers, causing employers to compete by paying higher wages or give up and abandon expansion plans. The first leads to persistent inflation. The second leads to a recession.  

While the Fed might moderate their rate increases, history has warned not to ease up on rate increases at the first sign of slowing inflation. In the early and late 1970s, the Fed eased and inflation resumed its upward climb. It’s like relaxing the tension on a leash and the dog immediately rushes ahead. The Fed’s tools are blunt instruments, relatively easy to deploy, but lack any surgical precision. Increasing rates dampen inflation, but both have the hardest impact on low income families who will welcome the relief of lower inflation. They can expect little help from a divided Congress as it struggles to enact any fiscal policy.

I worry about the next two years. Republicans have been out of power for a century. By that I mean that voters rarely given them the full reins of power, a trifecta where the same party controls the Presidency, the Senate and the House. They held power in the 83rd Congress from 1953-1955 and again in the two years of the 115th Congress, from 2017-2019. Their longest stint was the four years 2003-2007, a time of repeated failure and scandal – the mismanagement of the Iraq war, Hurricane Katrina, the accounting and energy scandals. They are not a party that governs well because they do not respect governing, only the political power that accompanies governing. They have become a reactionary party whose strategy is a “Lost Cause” narrative familiar to the southern Democrats they absorbed into the party over the past five decades. Party leaders and conservative talk show hosts echo a constant refrain that Republicans are the last standing guardians of traditional American values. I worry because Republicans are a party who breaks things and people are more breakable in the aftermath of the pandemic.

/////////////////

Photo by Justin Lawrence on Unsplash

Federal Reserve. (2022, November 30). Speech by chair Powell on inflation and the labor market. Board of Governors of the Federal Reserve System. Retrieved December 3, 2022, from https://www.federalreserve.gov/newsevents/speech/powell20221130a.htm

U.S. Bureau of Labor Statistics, Employment Cost Index: Wages and Salaries: Private Industry Workers [ECIWAG], retrieved from FRED, Federal Reserve Bank of St. Louis; https://fred.stlouisfed.org/series/ECIWAG, December 2, 2022.

U.S. Bureau of Economic Analysis, Personal consumption expenditures: Services (chain-type price index) [DSERRG3M086SBEA], retrieved from FRED, Federal Reserve Bank of St. Louis; https://fred.stlouisfed.org/series/DSERRG3M086SBEA, December 2, 2022.

///////////////////////