Credit Patterns

July 28, 2013

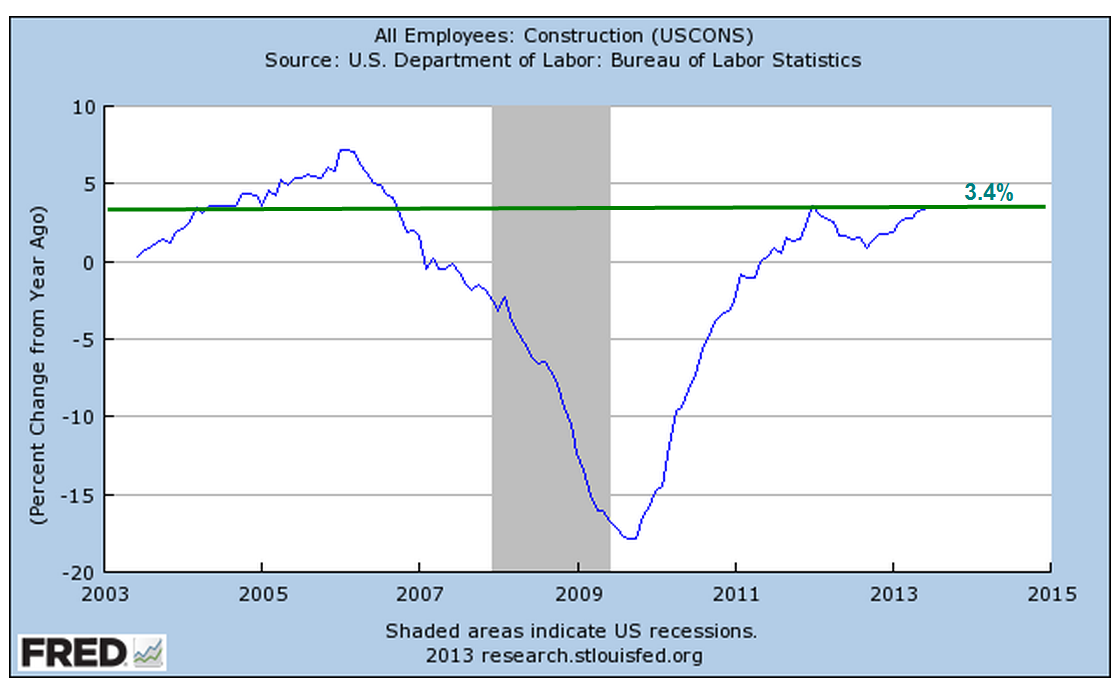
Economic growth is hampered when credit growth declines.  In 2008, we experienced a sharp decline in confidence and lending that has only now reached the levels before the decline.

When we look at the big picture, we can see that we are now at more sustainable growth trends.

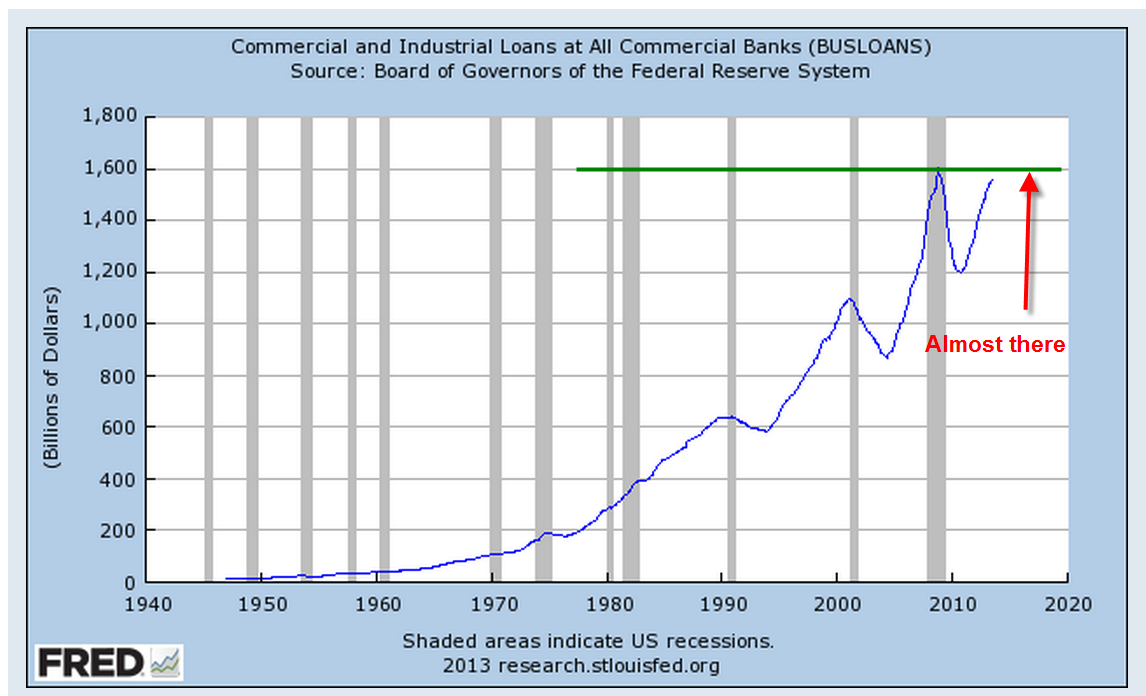
The amount of outstanding commercial and industrial loans is almost at the level last seen in 2008.

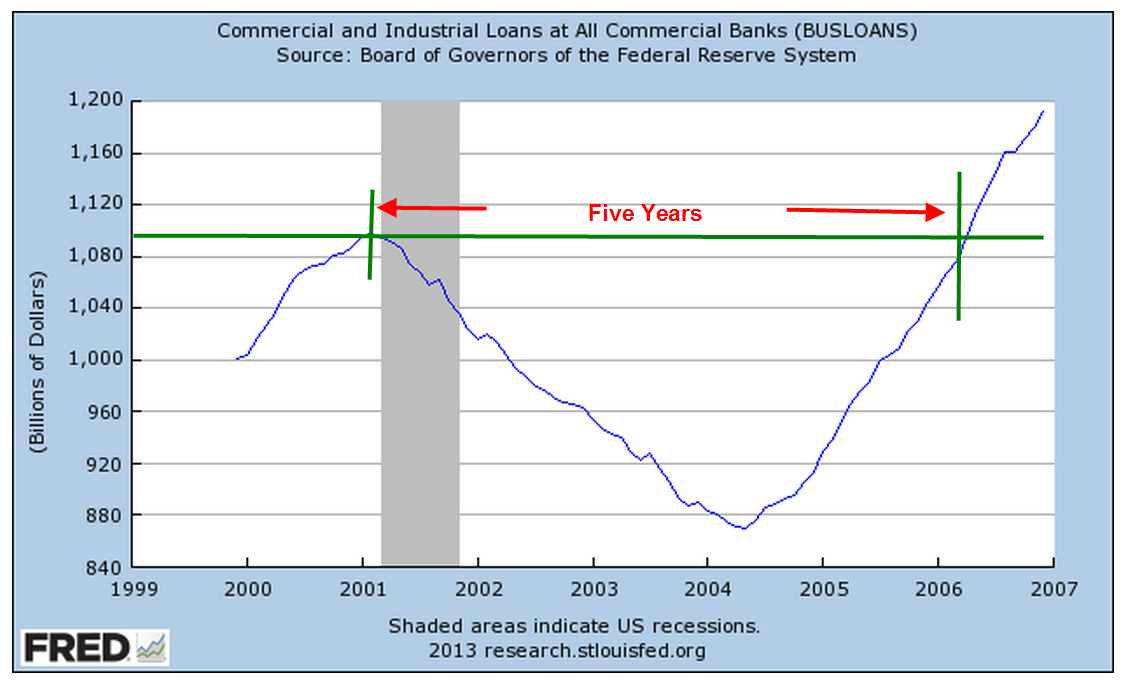
A smiliar slow recovery in business loans occurred during the 2001 recession.

Although housing evaluations have been rising, the amount of revolving equity lines of credit (HELOC) continues to decline.  The total outstanding is still high but approaching a more reasonable trendline of growth.

Recently rising bond yields have contributed to banks’  operating profit margins but the corresponding value of banks’ bond portfolios has fallen quite dramatically.

This decline in asset value affects bank capital ratios, which makes them less likely to increase their lending. which will be an impediment to economic growth.

This Wednesday the first estimate of 2nd quarter GDP will be released.  Real GDP growth is expected to be about 1.1%, less than the meager 1.8% growth of the 1st quarter.  Slowing growth may revive interest in bonds.  The recent sell off in bonds has probably been an over reaction incited by fears that the Federal Reserve will reduce its bond buying program dubbed “Quantitative Easing.”  While there are positive signs in the economy, they do not indicate any impending robust growth.

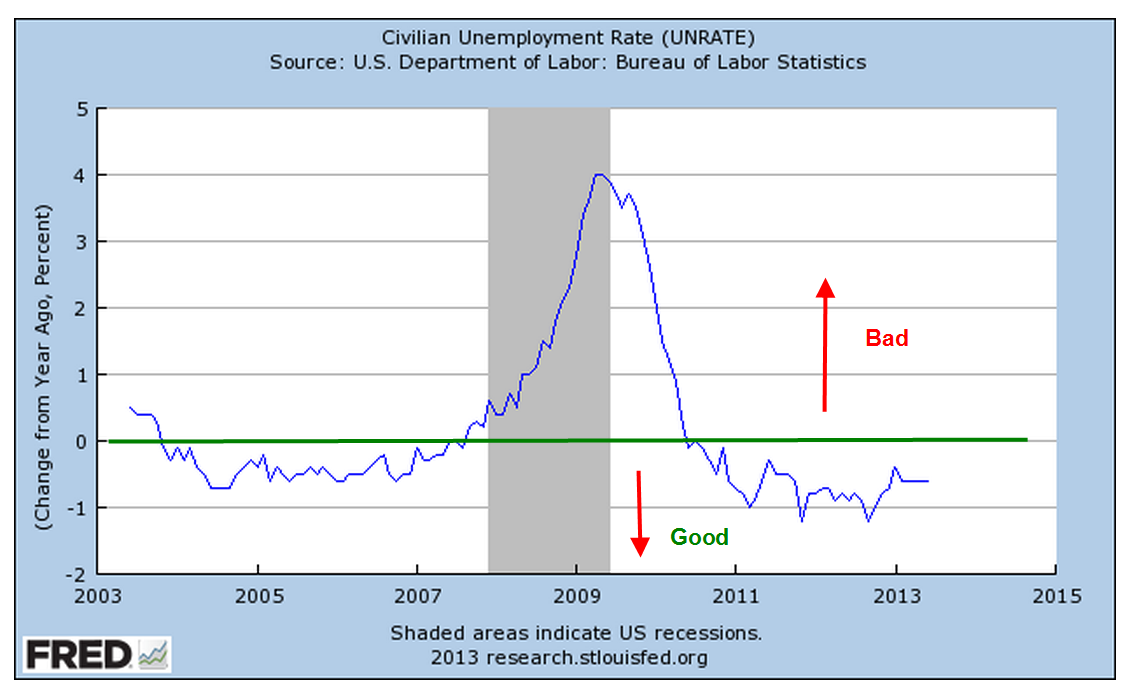
In addition to Wednesday’s release of GDP figures, the payroll firm ADP will show their monthly report of private employment growth, guesstimated to be slightly below the 188,000 gain predicted for June.  The BLS monthly labor report follows on Friday and will be watched closely.  Unemployment has been stuck in the mid-7% range since March and reductions in unemployment have been largely due to people either leaving the work force or taking part time jobs because they could not find full time work.

The Federal Reserve has said that its target for withdrawing its quantitative easing program is an unemployment target of 6.5%, with a caveat that inflation remains tame. A slow economy will naturally reduce inflationary pressures and improvements in the labor market are slowing as well.  In short, the Fed is likely to continue its monetary support for another year at least.

For a month now, the stock market has risen steadily in small increments, making up the losses that began in the third week of May.  Volume typically declines during summer months but this year’s volume of trading in SPY, the ETF that tracks the SP500 index, is 20% lower than this same time last year.  This week, we may see a market hesitation before the release of both the GDP and labor reports.

Continuing Unemployment Claims

July 21st, 2013

Since I’m on the road this will be a short piece.  Every week the Bureau of Labor Statistics (BLS) releases their estimate of new unemployment claims based on a compilation of state filings for unemployment.  Labor market analysts pay more attention to the 4 week moving average of this series because the weekly numbers can be volatile or affected by weather and holidays.

Each month the BLS releases their estimate of the number of unemployed and the percent of unemployment but this figure comes from a survey of households.  People surveyed report that they are unemployed and BLS interviewers substantiate responses by asking additional questions. However, there really is no independent verification that someone who says they are unemployed is actually unemployed.

As the states update their tally of those unemployed who continue to claim benefits, the BLS reports the number as Continuing Unemployment Claims.  While no number is entirely accurate, there is a greater degree of accuracy in this number of unemployed.  It does not include those who have not filed for unemployment or those who have run out their benefit period and are no longer eligible for benefits.

I wanted to compare this fairly reliable number with another somewhat reliable number – the number of employed from the Establishment survey.  This total is based on a survey of companies who report the number of employees on their payroll.  While this total has some problems it has proven to be more reliable than the employed number from the Household Survey.

Below is the number of continuing unemployment claims.  Four years after the official end of the recession in June 2009, continuing claims are still at levels seen in the earlier two recessions.  This indicates the persistent underlying weakness in the labor market.

Comparing continuing claims to the total employed reveals some surprises.

This metric shows the severity of unemployment in the recession of the early 1980s; the percentage surpassed the peak in this past recession.  We can see that current levels are high but not dangerously so.  We have seen higher levels during periods of robust growth in the mid to late 1980s and in the recovery years in the mid 1990s.  What we want to see is a continued decline in this percentage.

Economic Activity Indexes

July 14th, 2013

A few weeks ago I wrote about a constant weighted index (CWI) of the monthly Purchasing Managers survey. Presented by economist Rolando Pelaez in a 2003 paper, the CWI assigned various fixed weights to the separate components of the survey.

The Purchasing Managers Index, or PMI, covers manufacturing industries, now a relatively small part of economy.  In the past thirty years, our economy has become dominated by service industries which are surveyed separately each month.  The composite of the non-manufacturing survey is the Business Activity Index, or BAI.

Two weeks ago, June surveys for both sectors indicated a very slight expansion.  The service sector edged up but is hardly robust.

Wanting to see what a composite Manufacturing, Non-Manufacturing index would look using Mr. Pelaez methodology, I combined the components of each survey, assigning 70% to the service sector and 30% to the manufacturing sector.  Did I get out my R statistics program and run multiple regressions to find the combination of percentages that fit the historical data best?  No.  While the manufacturing sector is less than 20% of the economy, it has powerful influences on the service industries in a community.  How much effect?  Using my gut, I came up with 30%.

The results surprised me.  The graph below starts in 1997 and includes the latest June figures.  It compares this composite index, labelled M+NM (manufacturing and non-manufacturing), with the service sector BAI and the SP500 stock market index.  The composite index loosely follows the  BAI, which is an easily available index that an investor can find by typing in “Fred Business Activity Index” into Dr. Google.

The chart shows a divergence between the recent rise in the stock market and the recent decline in business activity.

Let’s take away the clutter and look at the BAI itself.  Growth has slowed but this may just be a normal dip in the business cycle – nothing to be alarmed about.

For the past month the stock market has been trading on whether the Fed, and China, can keep holding up the world’s economy.  Corporate earnings this past quarter are expected to show lackluster growth, economic activity indexes are showing a somewhat lackluster expansion – and the stock market makes new highs.

It’s a head scratcher.

Job Trends

July 7th, 2013
A better than expected June labor report released this week prompted some speculation that the Federal Reserve may begin tapering its quantitative easing program as early as this fall.  The employer survey reported a net gain of 195,000 jobs and the gains of earlier months were revised up 70,000.  Government workers continue to decline. We will see that the modest strength in the labor market is part of a mixed employment picture.    The unemployment rate remained steady at 7.6%; the year over year percent change in this headline index continues to chug along in the “good” territory.

70% of workers – about 95 million – are employed in private service jobs, most of which showed strong gains in the past quarter.

14% of workers are government employees; federal, local and state governments continue to shed workers.

As the number of workers declines, the number of people served by each worker continues to rise, approaching levels last seen in the early 1980s and mid-1970s.  The government work force would need to decline a further two million, or 10%, to reach the level of 15 people per government worker.  That level is still far below the comparatively lean government worker levels of the 1960s and earlier.

The major part of the attrition in government jobs seems to be over.  Local governments are adding employees while the federal government continues to shed employees.

Job gains continue to come in lower paying retail and food service jobs.  In 2013, employment finally surpassed early 2008 levels.  The average wage of $14 to $17 per hour in these industries is far below the $24 average of all workers and the $20 average of private production and non-supervisory workers.

Much higher paying jobs in Professional and Business Service industries continued to show strong gains and have also climbed above 2008 levels.  The average wage in this category is 15% higher than that of all workers.

Over seven million people not counted in the labor force or in the headline unemployment rate say they want a job now.  Four years after the official end of the recession, the number of “kind of unemployed” remains high.

The number of involuntary part-time workers increased by 322,000, or about 4%, to 8.2 million, over 5% of the total labor force.  These are workers who are working part time but want full time jobs.  A healthier labor market would have about 3% of these unwilling part timers.

As the number of housing starts increases, the unemployment rate among construction workers continues to decline and dipped below 10% this month.  Lower lows in this unseasonally adjusted index of unemployment is a good sign.

But the year-over-year percent change in construction employment is still not robust enough to reverse the heavy job losses since the onset of the recession.

The core work force aged 25 – 54 dropped by 100,000 and continues its slight upward struggle above the recession depths.

A decline in this prime working age population is partly responsible, but the 1.6 million decline in population is but a third of the 5 million plus decline in employment for this age group.

A 2004 paper by a BLS economist, Jessica Sincavage, provides an interesting historical perspective on multi-decade generational trends in the unemployment rate.  She noted “The characteristics of today’s younger workers differ from those of their baby-boomer counterparts in several ways that may affect the former group’s impact on the labor force and the unemployment rate now and in the future. Among the relevant characteristics affecting both groups are school enrollment patterns, race and Hispanic origin, and women’s labor force participation.”

In 1979, over 42% of the last of the boomer generation aged 20 – 24 were enrolled in school.  In 2002, under 37% of the “echo boomer” generation aged 20 -24 were enrolled.  Easy job availability, the growth of the internet and the sustained rise of the stock market during the 1990s persuaded many younger workers that the opportunity cost of going to college was simply not worth it.

The onset of this recession has divided the prime work force into two groups.  For those with a degree unemployment has remained low.  For those without the higher education, unemployment is almost double.  In a curious correlation, the unemployment rate for three groups is about the same – the general labor force,  workers above 25 years with a high school only education, and Hispanics.

The third factor noted by Ms. Sincavage is the participation rate of women in the labor force. In her 2004 paper she observed “In 1979, the participation rate of women 16 to 34 years was about 63 percent; by 1999, it was 70 percent.” By the mid 2000s, this cultural and demographic bulge began to decline.  The rate for all women has now declined below the levels of the early 1990s.

Although there was a lot to like about this month’s labor report, recent job gains are swimming against an undertow of shifting demographics and labor demands from employers.  A casual reading of the headline numbers might lead one to discount these long term negative trends.