This past Friday, the Bureau of Labor Statistics (BLS) released their monthly assessment of the labor market, reporting a net increase of 227,000 jobs during the month of February. This marked the third consecutive monthly increase of more than 200,000 jobs, giving many hope that the tepid economic recovery is gaining a firmer foothold. Consumer spending accounts for more than 2/3 of the economy. Any improvements in the overall economy are fragile without a strengthening labor market. Almost 1/2 million people who had previously given up looking for work became available for work again. This influx of job seekers offset the rise in jobs, causing the unemployment rate to remain unchanged at 8.3%.
The monthly survey of businesses showed job gains in many industries: Business services, leisure and hospitality, health care, mining and manufacturing. In 2011, government jobs disappeared at the rate of 22,000 per month. That job attrition has slowed to zero, indicating that the cut backs in government are largely over and will no longer weigh down any growth in the private sector.
The bad news is that there are many critical elements of the jobs report that were unchanged. The long term unemployed remained about the same at 5.4 million. The participation rate of the 155 million civilian labor force is a bit less than what it was a year ago but the employment population ratio is slightly above Feb. 2011’s rate. The average workweek remained unchanged at 34.5 hours. Involuntary part time workers, those who would like a full time job but can’t find one, remained the same at 8.1 million.
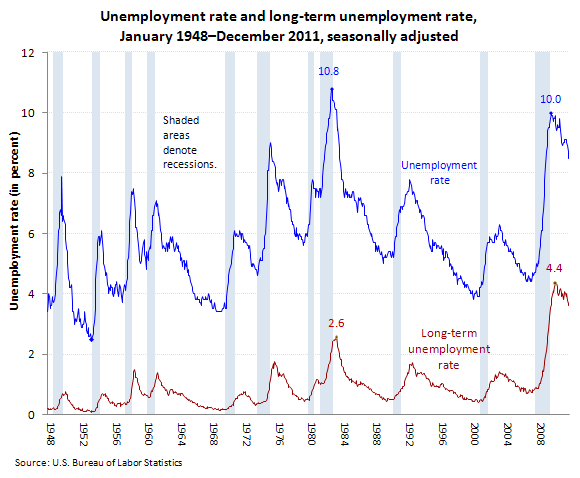
As encouraging as February’s data is, the 5.4 million who have been unemployed for 27 weeks or more is a troubling sign of the underlying weakness of the job market. Below is a BLS historical comparison of the unemployment rate and the long term unemployment rate. The 70 year timeline of the graph illustrates the ongoing crisis levels of long term unemployment.
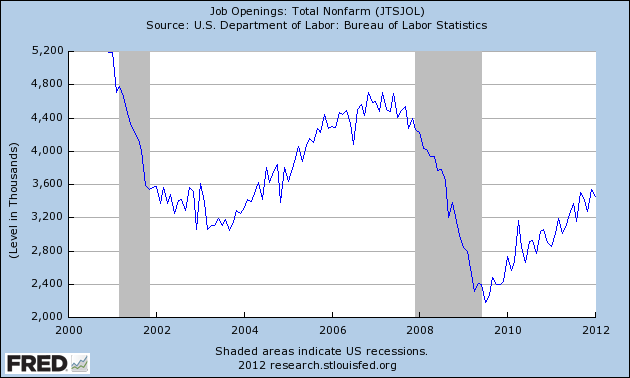
On Monday, March 12th, the BLS will release the monthly JOLTS job openings report for January 2012. In December, there were 3.4 million seasonally adjusted job openings, an increase of almost 10% from the previous month. This is better but – always that but – the graph below shows non-seasonally adjusted (NSA) December job openings from the previous ten years to show the improving but still weak number of job openings.

As I have mentioned in past blog posts, there is some concern that the seasonal adjustments that the BLS uses may have some weaknesses due to the severe downturn in the fall of 2008 which affected the winter seasonal adjustments. The BLS makes one set of seasonal adjustments for the six months from May through October and another set of adjustments for the November through April period. With advances in statistical modeling that the Census Bureau has introduced over the past 50 years, the BLS has refined their methodology of making seasonal adjustments. The concern is not with their methodology but with the data itself of late 2008 and early 2009, an “outlier” that was so extreme that it “contaminates” the data set in subsequent years. The BLS incorporates 5 years of data in their projections of seasonal adjustments, so this “hangover” will last into the spring of 2014. You can read an overview of the adjustment methodology used by the BLS here. Without seasonal monthly adjustments, January’s job data each year would look dismal, with job losses regularly in the 2.5 to 3 million range, as employers lay off workers who were hired for the Christmas season.
A comparison of the raw numbers for job gains in February of each year do give an indication of labor market momentum. As the chart below shows, the gains in February have been one of the strongest of the past decade.
But we saw strong gains last year throughout the spring only to see the momentum fade, explaining why the reaction to this month’s gains have been one of “cautious optimism”. Some attribute the loss of momentum last year to the tsunami, the unrest of the Arab spring and rising gas prices, the ongoing sovereign debt problems in Europe, and the embarrassing budget battle. But there may be more to it than the events of last year. I contend that there is a structural weakness in our labor market that makes us more susceptible to the “winds” of current events.
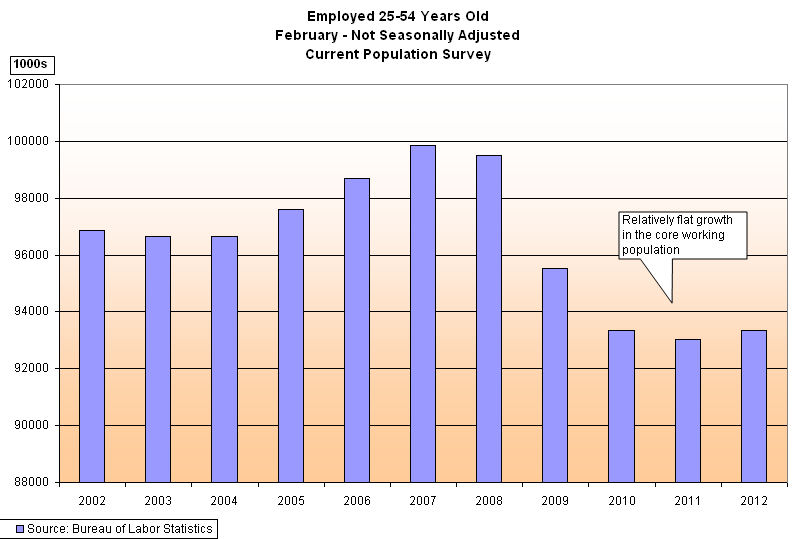
As I have done before, let’s look at the core working population, 25 – 54 years old. These are non-seasonally adjusted figures for February in each of the past ten years.
These are the “middlers”, those of us who are buying homes for the first time, raising families, buying appliances and cars and they are the backbone of a consumer economy. The job growth of this population backbone has been flat and remains at levels below those of the early part of the decade, as this country pulled out of the 2001 – 2003 downturn.
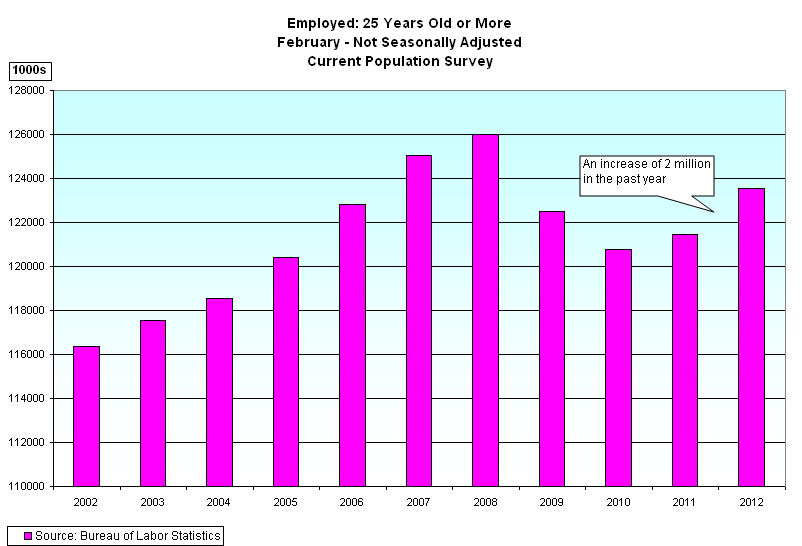
The largest part of the increase in employment have come from those who are older than 54, as shown in the chart below of the larger data set of those 25 and older who are employed. Partially this is due to an aging population – the graying of the Boomers – but it shows a structural weakness in the labor market which undercuts the resilience of the economic recovery.

The takeaway is that we are once again seeing improvement but our economy and labor force suffers from a brittleness that the labor data exposes. Part of that brittleness is due to an aging population; part is due to the continued de-leveraging and slow recovery typical of major financial crises; part is due to political indecision in government which reflects the indecision and disagreement among the voters; part is due to a very “accommodating” (translation: low interest rates) Federal Reserve policy that attempts to distribute financial pain, reward and risk throughout the economy using the few monetary tools that it has.
The stock market is encouraged but stuck. After rising for the past two years, the 200 day moving average of the SP500 has leveled off for the past 6 months, a phenomenon not seen since April to October of 1994. October 1971 to March 1972 and May through September 1957 saw a similar 6 month plateau. The Indians in the market are hunched over with their ears to the ground, not certain whether the distant sounds they hear are buffalo or thunderstorms.