Job Openings – March

A couple of weeks ago, the Bureau of Labor Statistics (BLS) issued their March JOLTS (Job Opening and Labor Turnover Survey) report showing a continuing increase in job openings. Below is a Federal Reserve historical graph incorporating the latest March data.

Graphing the quarterly data evens out the monthly fluctuations and shows the upward trend.

While the trend is upward, we have come from a deep trough and we still have a long way to go to get to a healthy job market.  The number of job openings is about the same as in 2004 but the population has grown by 20 million since 2004.

The stock market is inextricably chained to the labor market.  In the graph below, we can see the similarity in trends between the S&P500 and the job openings.

The stock market attempts to anticipate the health of the job market.  In the spring of 2006, job openings halted their decline then rose and the market resumed upward in anticipation of a continued climb in job openings.  As job openings reversed and resumed their decline in 2007, it was a harbinger of the coming economic cliff.

Obama’s Fiscal Prudence

Two months ago I compared federal debt by Presidential administration.  Obama’s administration leads the pack.  This would lead one to assume that President Obama is a big spender.  He’s not.  In a WSJ MarketWatch article (I don’t think you need a subscription to see this article), Rex Nutting examined the historical data of federal spending from the Office of Management and Budget (OMB) and Congressional Budget Office (CBO). The data shows that the big spenders were Reagan and G.W. Bush.  What has plagued the Obama administration is a lack of revenue, particularly income tax revenue, because of the recession. 

In a balanced approach, Nutting gives proper due to the role Republicans in Congress have played, checking Congressional spending approvals.

Regardless of the data, we can expect that Republican pundits and political ads will continue to paint the Obama administration as the big daddy of  “tax and spend” Democratic Presidents.  To partisans of either party, when facts don’t conform to their ideology or preconceived notions, there must be something wrong with the facts.  Both parties rely on the fact that many voters vote with their guts, not their heads.

JPMorgan Hedge Update

This weekend the Wall St. Journal had more details about the large gamble/hedge that JPMorgan (JPM) has taken in a derivative index called IG9 that tracks the overall health of corporate bonds. The full value of JPM’s position is about $100 billion or about 78% of the firm’s entire market cap.  Other hedge funds are waiting for JPM to start unwinding their position, aiming to profit at JPM’s expense.  Some estimates are that JPM’s losses could run as high as $6 – $7 billion.

In my blog yesterday, I stated that JPM had about 150 regulators working on site, supposedly supervising JPM’s operations to ensure the public safety.  The Office of the Comptroller of the Currency (OCC) revealed that they had 60 regulators who did nothing but monitor JPM’s trades and were aware of these highly aggressive trades.  As of late April, those regulators evidently saw nothing unsafe in JPM’s trading positions.  Do those regulators still have their jobs?  Probably.

The Federal Reserve and the FDIC also have onsite regulators who monitor JPM’s activities.  So many regulators and no cause for alarm before this blew up?  The Senate Banking Committee has started an investigation into this debacle.  In the political merry-go-round, we can expect more hearings, more regulations, more regulators, more cost to the taxpayer and less safety, less effectiveness from our government.

JPMorgan Hedge

The recent scandal involving JP Morgan’s hedging loss of $2.3 billion (and is growing by $100 to $150 million per day),  has refocused attention on the Volcker rule, a key provision of the 2010 Dodd-Frank bill that initiated a new set of regulatory restrictions on the banking industry.  At more than 800 pages, the law spawns millions of new regulations, many of which won’t be finalized until July of this year, when the Federal Reserve is to start supervising the banking industry to bring them into full compliance with all the regulations by 2014.  The Volcker rule was ostensibly designed to curb the gambling type of hedging that brought the banking industry and the economy to its knees in 2008.  The JPMorgan fiasco has ignited a debate among politicians and pundits, bankers and regulators as to whether this trading strategy would have fallen under the purview of the Volcker rule.

As always, the devil is in the details.  Section 619 of a draft version of the bill stated that banks might initiate hedging trades “in connection with and related to individual positions.”  The banking lobby wanted to insert two small words “or aggregated” so that the final version of the bill would read “in connection with and related to individual or aggregated positions.”  They may have argued that banking and/or investment firms do aggregate a position over time through a series of trades, a common practice to avoid “moving the market” with a single large trade.  This, in fact, is the final language of the Dodd-Frank law (pg. 249)
Some argue that these two simple words effectively negates the effect of the Volcker rule because it allows an investment bank to engage in any hedging strategy as a tool to ameliorate the risk of any portion of the banks portfolio of investments.  The entire bank’s portfolio is, after all, an aggregated position in the market.  In effect, the language of the law allows investment banks to engage in the same kind of risky bets that the Dodd-Frank law is supposed to curtail. Jamie Dimon, the Chairman and CEO of JP Morgan, insists that the failed hedge would not have fallen under the Volcker rule.  There are about 150 bank regulators who work in the home offices of JP Morgan, constantly monitoring the operations of the largest bank in the U.S.  Either those regulators did not know of the hedge or did not understand the risks involved.  The trades were initiated in London so it might be feasible that the regulators did not know of the trades – except that both Bloomberg and the Wall St. Journal had called attention to the risky trades in April and Jamie Dimon had dismissed any concerns about the risks.  This example should refute the arguments of those who champion ever more regulation and more regulators of all business activity as the solution to keep the public safe.  The housing, securities, banking and insurance industries are all heavily regulated yet the confluence of poor risk management in these industries led to the debacle of 2008.  Regulations too often morph into a job programs for regulators and lawyers without achieving the desired goal of protecting the public from grievous harm.

The voters elect representatives to go to Washington to write competent laws.  Instead, the voters get poorly written laws written by a mish-mosh of inexperienced lawyers, industry lobbyists and passionate but impractical partisans.

JPMorgan gives the impression that Bruno Iksil, the London trader responsible for these aggressive trades, was a rogue trader  –  that the bank’s risk management team should have supervised him more closely.  What JPMorgan doesn’t readily disclose is that Mr. Iksil made the bank almost a half billion in profit just six months ago using equally aggressive trades.  Why supervise someone who apparently has the golden touch?

Where does JPMorgan get the money to engage in this risky gambling?  Your money.  JPMorgan had about $1.3 trillion in deposits from small depositors and large customers on its books but only about $700 billion in loans, leaving it with a lot of extra money, insured by the taxpayer, to gamble with.  They lost.  For now, the stockholders are the ones who have paid the price.  The stock has lost 24% of its value since the trading loss was confirmed by Jaime Dimon.  The amount of money lost so far is less than 1% of JPMorgan’s assets.  But it raises the question raised so alarmingly just a few years ago:  WTF????!!!  When I put my money in a bank, I expect them to keep it safe.  I don’t want the bank to take my money and gamble it.

Employment – April 2012

This past friday, the Bureau of Labor Statistics (BLS) released their monthly assessment of labor conditions in this country and the headline figure was a disappointment.  The survey of businesses showed a seasonally adjusted 115,000 net jobs added in April, below the 150,000 expected by economists.  The unemployment rate dropped to 8.1% as almost 350,000 people simply dropped out.  Some of this was due no doubt to early retirees but the Federal Reserve estimates that retirees account for about 25% of the drop out rate.

As I have done in the past, I’ll take a deeper look at some numbers behind the headline numbers.  The core work force of people aged 25 – 54 continues to show gains but the chart below shows the comparative weakness of this segment of the work force.  This age demographic is the “middle”, when people accumulate both earning and buying power and form the primary demand of a consumer economy like the U.S.

The year over year job gains continue to climb upwards.

Late last summer, the larger work force of those aged 25 and older began showing year over year job gains several months before the core work force, revealing an underlying structural weakness of both the workforce and the recovery.

Some of the workforce is graying, moving from the core 25 – 54 age demographic into the older 55+ demographic, where workers are trying to save for retirement or taking jobs because their social security and retirement income is not adequate.  With a natural propensity for saving, older workers do not create the needed demand for the economy to grow strongly.  In the chart below is the year over year job gains for those aged 55+ and this is a key metric for it shows which age group have enjoyed the bulk of job gains in this recovery.

Throughout this recession and the massive loss of jobs, older workers have continued to show gains.  Strengths in the labor force statistics have been in retail, business services and health care.  Experienced older workers can be attractive to employers offering business services.  In retail and health care, it may be that older workers have less family responsibility, show a greater reliability and are thus more attractive to employers who enjoy a “buyers” market.  This past month was the first month that gains slowed while the gains of the core work force continued to climb.

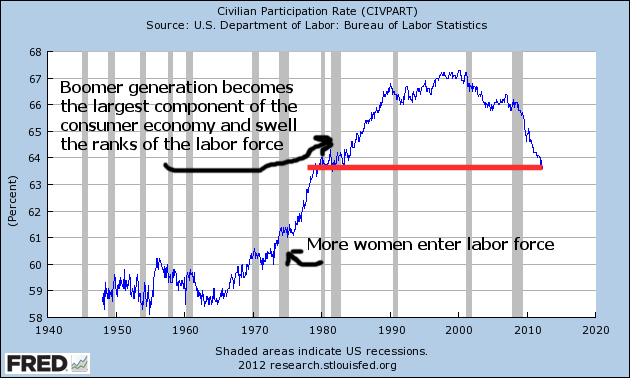
As I have noted before, the demographic bell curve of the past three decades is coming to a close.  The participation rate, the number of workers as a percent of the working age population, has declined to 1981 levels, nearing the closing of an upswell brought on as the post WW2 boomer generation entered their prime working years.

The 1980 Census shows that, there were 25.5 million people 65 and older in 1980 (11.3% of the total population), an increase of 5 million from the 20.0 million count (12.3% of total) in 1970.  While the numbers climbed, the percentage stayed stable in that 10 year period.  Those aged 50 – 64 numbered 33.4 million, or 14.7% of the population.  In 1970, it was 29.7 million or 14.6%.  Again, the numbers were stable.  The median age of the U.S. population was 30.

Fast forward to the 2010 census and the percentage of those aged 65+ is still relatively stable at 40.3 million or 13.0% of the population.  Despite all the medical advances of the past 30 years and the trillions of Medicare dollars spent on the elderly, the percentage of older people is still about the same as it was in 1970 and 1980.

But the juggernaut of Boomers is waiting in the wings.  The 2010 Census shows that those aged 50 – 64, the “meat” of the Boomer generation, numbered 58.8 million, or 19% of the total population.  In thirty years, they have increased from 15% to 19% of the population.  The median age of the population is now 37 years, an increase of seven years.

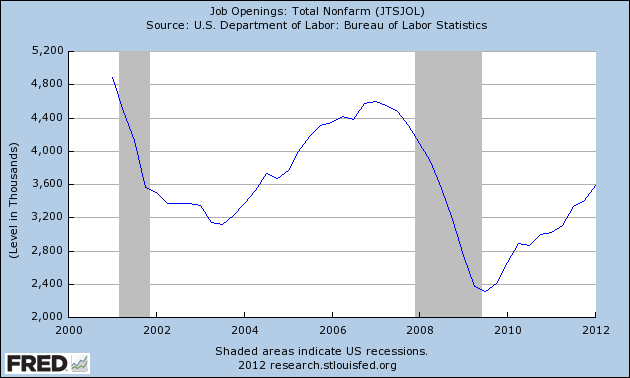
The 25 – 54 age group funds the social contract that provides health insurance and retirement income for older Americans.   For this core work force, the increasing job gains of the past four months have been a welcome sign but, as the chart above shows, this core has suffered huge job losses in the past 3+ years and are climbing out of a deep hole.  I hope that April is the beginning of new trend, where the job gains increasingly go to the core younger segment of the work force and not to older Americans.  Only then will we see sustainable economic growth.