February 17th, 2013
The spending sequester, or sequestration, set to take effect March 1st is a series of automatic and indiscriminate spending cuts that was part of the “Grand Bargain” compromise between President Obama, together with a Democratically led Senate, and the House Republicans in the Budget Control Act of August 2011. The agreeement was rather like a Sword of Damocles, a chopping of spending programs cherished by one party or the other. The term “sequester” means that there will be some actual spending cuts, not the usual budget and appropriations gimmicks that Congress is fond of. The unpalatable cuts to both defense spending and social programs were supposed to be an incentive for both parties in Congress to come to an agreement on deficit reduction as a condition of raising the debt limit. It was hoped that the 2012 election would decide which party’s priorities would take precedence and the dominant party could then pass legislation to avoid or modify the sequester. Instead, the election left the balance of power unchanged. Republicans had dismissed the probability of the Democrats winning a majority in the House. There were just too many seats that the Democrats need to gain to accomplish that. Hoping to take the Presidency and having a good chance of taking control of the Senate in the 2012 elections, Republican lawmakers agreed to the sequester. The 2010 post-census election had put Republicans in charge of crafting voting districts, which enabled them to retain a majority in the House despite losing the total popular vote for House seats in the 2012 election. Several key Senatorial races imploded when Republican candidates made ill-advised (to be charitable) remarks. Instead of gaining control of the Senate, Republicans lost two Senate seats. Despite the high unemployment rate and the poor to middling economy, President Obama won re-election.
After navigating a mind numbing maze of previous law and baseline budget projections to arrive at actual spending reduction goals, the sequester will reduce defense spending by $55 billion and non-defense spending by $38 billion in 2013. While this sounds like a lot of money, this is just 2.4% of the estimated $3.8 trillion in total federal spending in 2013 or a mere .6% of the estimated $16 trillion of this country’s GDP. This past week the Democratically controlled Senate revealed a plan that would avoid the sequester for 2013. The plan achieves deficit reduction goals with spending cuts and revenue increases but the revenue increases will probably be unwelcome to the Republican majority in the House. Despite the rhetoric of calamity coming from either side of the aisle, both parties are anticipating that the sequester will probably take effect in two weeks.
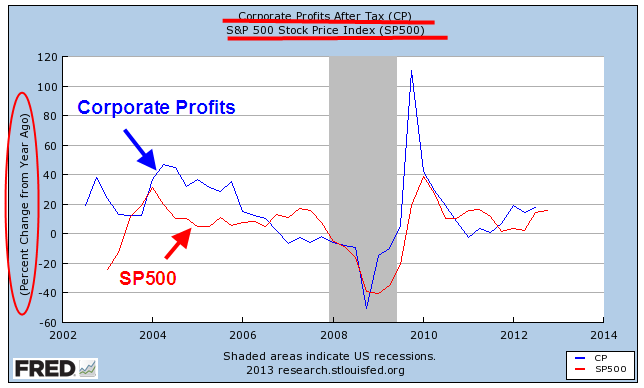
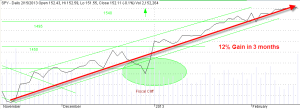
Since mid November the SP500 has risen 12%; except for a sharp decline in the last week of the year in response to fears of the fiscal cliff, the market has climbed steadily. The market has been largely ignoring the upcoming sequestration.
More concerning to some is the slowdown in Europe, where the Eurozone economy has contracted for 4 quarters in a row. Even Germany, the manufacturing and export stalwart of the Eurozone, saw a .6% contraction in the final quarter of 2012.
For many decades, the two prominent parties have been fighting an ideological battle over the role of the Federal government. The Democratic Party regards the Federal government as largely beneficial and wants a greater role for the Federal government. They have ushered in many social programs including Social Security, Medicare and Medicaid, programs that are largely on autopilot, beyond the reach of the Appropriations Committee in the House, where a select few can make the law by deciding which programs and federal agencies receive funding. The philosophy of the Republican Party is that the Federal government is intrinsically a burden and therefore deserves a smaller role. The Republican Party was out of power in the House for forty years until 1994; as a result, their role consisted largely of blocking or modifying Democratic Party ambitions. Except for four years from 2007 – 2011, they have controlled the House since 1994 yet often conduct themselves as the opposition party that they were for much of the latter part of the 20th century.
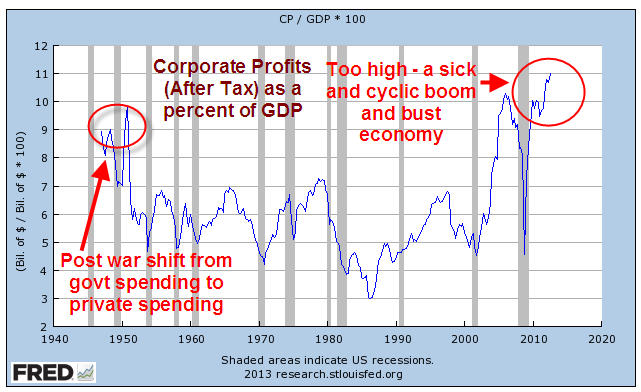
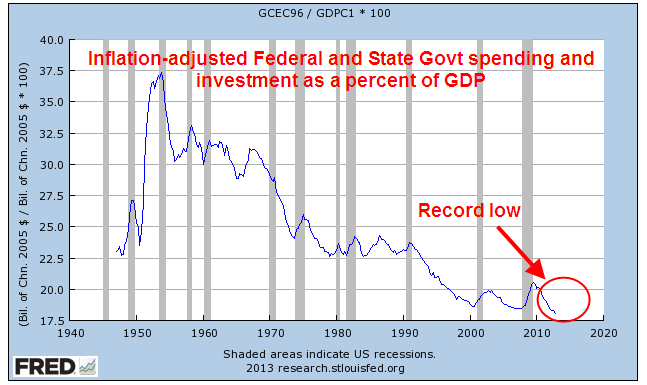
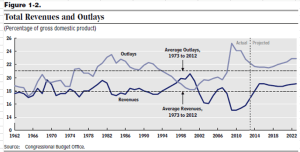
In the tug of war between these two ideologies, the budget has suffered. A recent report by the non-partisan Congressional Budget Office (CBO) contains a graph of Federal revenue and outlays and their long term averages which clearly pictures the “scrimmage” of ideologies between two yardlines, marked 18% and the 21%. Republican politicians, together with conservative talk show hosts and commentators, speak of the “traditional” role of the Federal government at 18% of GDP. This is simply the average of Federal revenues, not its role, for the past fifty years. Revenues have been, on average, 3% below that of Federal spending, which has averaged 21% of GDP. The “traditional” role of the federal government, then, is to have an average annual deficit of about 3% of GDP. In a $16 trillion economy, that average deficit is $500 billion.
Republicans simply can not say “no” to the Defense Dept; at times, they have forced spending programs on the Defense Dept that it doesn’t want. The Democratic Party has become the champion of a hodge podge of Federal social welfare programs. Neither party proposes taxes that will actually pay for the spending. For all the Democratic rhetoric about taxing the rich, there simply aren’t enough rich people to pay for that average $500 billion deficit. Large corporations continue to dominate both parties. Campaign laws in most states as well as the federal government permit no fundraising in government buildings. Almost every day, the members of the House and Senate must leave the government building where they work in order to do the daily drudgery of promising favorable legislation to corporations and associations in return for campaign contributions.
We are still way above the 3% deficit average of the past fifty years. The CBO projects that this year’s deficit will be 5.2% of GDP, almost half of the 10% deficit in 2009.

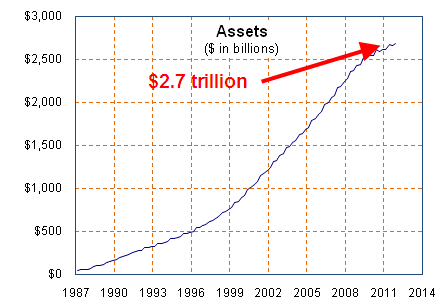
Over the next two decades, that 3% budget deficit average is about to grow larger. For the past fifty years, the demographic bulge known as the Boomers have been paying into Social Security. Those taxes have exceeded payments in most years, reducing overall Federal government deficits by .6% of GDP each year (Table 1.2 OMB historical tables, 2013 Budget). Those surpluses have masked the reality that average annual Federal deficits, excluding Social Security, have been about 3.6% of GDP. In a $16 trillion economy, that is close to $600 billion. As the Boomers retire over the next twenty years and are collecting Social Security payments, add in another $100 billion a year as the Boomers draw down the $2.7 trillion dollar Social Security surplus they have built up.

We’re now up to a $700 billion annual deficit based on revenue and spending patterns over the past fifty years. As the total Federal debt grows, so will the interest costs on that debt. Over the past seventy years, interest costs have averaged 1.8% of GDP, almost 30% higher than the 1.4% of the past few years (Table 3.1 OMB 2013 Budget) Ballooning debt levels and rising interest rates could easily add another $100 billion to annual deficits. We’re now up to $800 billion and growing, based on historical averages.
Republicans will continue to call for spending cuts – it’s their brand. Democrats will call for more programs and more taxes – but not on the poor and middle class – that’s their brand. The political and economic tug of war will continue, meaning that uncertainty will be the new normal. Uncertainty usually leads to lower economic growth which exacerbates social and political tensions which leads to more uncertainty until eventually there will be another crisis.
In preparation for a cycle of uncertainty and crisis, the prudent investor might ask “What’s my backup plan?” If you are lucky enough to have a defined benefit pension plan with the company you work for, what is your backup plan if that “defined” benefit is “redefined.” Well, you might be thinking, my company is so large and dominant in its market that such a possibility is unlikely. Tell that to the employees of United Airlines, a dominant player in its industry, who lost part, or in some cases, more than half of their benefits when United Airlines shed part of its pension obligations in bankruptcy court.
In the mid nineties, IBM converted its defined benefit plan to a “cash balance” plan, effectively lowering the pension amounts due older workers. After seven years, a contested lower court decision and a victorious appeal, IBM won their right to do this. IBM and other large companies have lots of lawyers and accountants trying to figure out legal ways to reduce their liabilities. How many lawyers and accountants do you have?
A March 6, 2012 article in the Wall St. Journal reported that “Business groups are urging Congress to let employers put less money into their pension funds, saying that exceptionally low interest rates are forcing them to set aside too much cash.” I’ll bet your company has more lobbyists in Washington than you do.
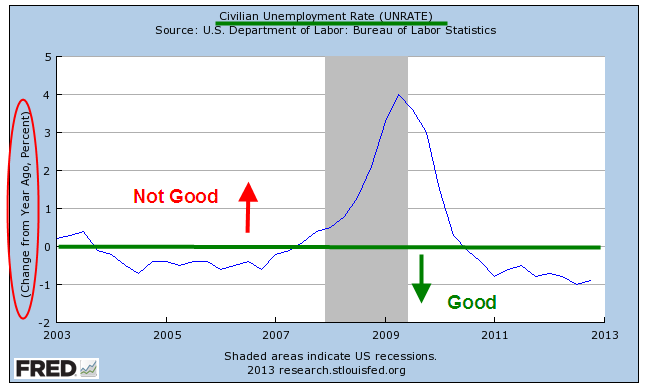
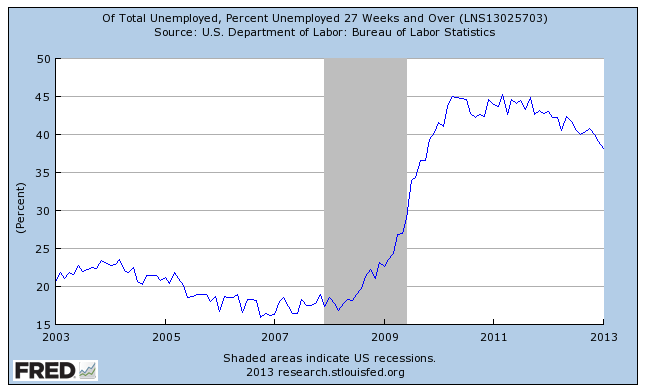
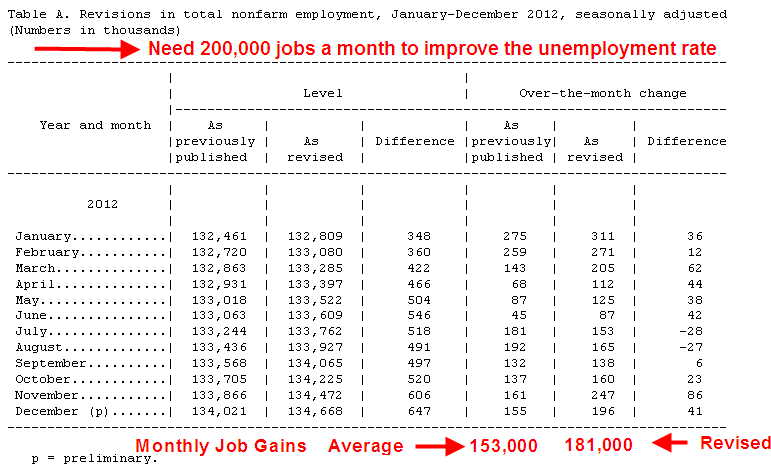
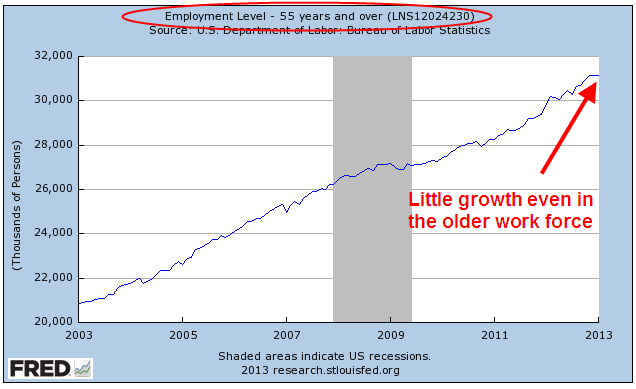
These past few years have been a wake up call for those who worked, diligently saved and invested, planning on a certain retirement income based on historical returns of various investments in the stock, bond and CD markets. Too many people discovered that their backup plan was either to keep working or go back to work, a fact supported by the monthly household survey from the Bureau of Labor Statistics.
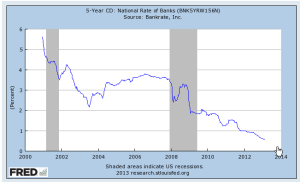
Many retirees built CD “ladders” in federally insured certificates of deposit that paid 4 – 5% interest or more, offering them the safety of their principal and a steady income. With interest rates for CDs at 1% or less, many retirees have either had to find more risky investments or simply spend less or – there’s that backup plan again – go back to work to make up the difference.
Then there are the folks who planned on selling their home, downsizing and using the difference as an income stream in their retirement years. Now they wait, hoping that housing values will return to the lofty levels of the mid-2000s or – backup plan again – keep working.
Some people think that the past few years have been an aberration and are waiting for things to get back to normal, or average. What I’ve tried to show is what those averages have been for the past fifty years and that those averages are better than what we can plan on for the next twenty years. We certainly can not plan on a vague hope that the folks in Washington will find either a solution or a compromise to a problem that has remained unresolved for the past half century and will continue to worsen in the next two decades.