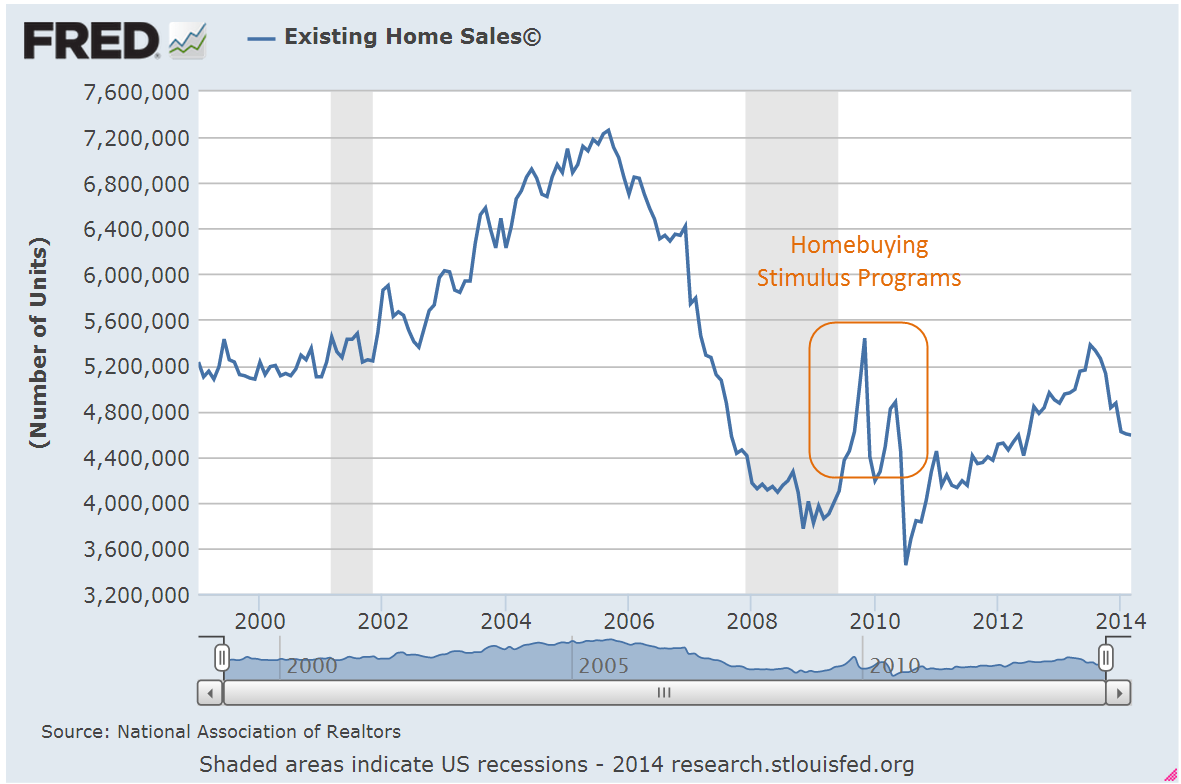
Spring Fever

April 27th, 2014

Existing Home Sales

Sales of existing homes in March were disappointing, dropping 7.5% year over year.  Some analysts use the 5 million mark as an indication of a healthy housing market.

As a percent of the population, the change in existing home sales is rather small, yet the change of ownership prompts remodeling projects and home furnishing purchases after the sale, spiff ups before the sale, and commissions and fees for real estate professionals at the time of the sale.

As a percent of the total stock of homes, sales are likewise small yet determine the valuation of everyone’s home.  There are concrete consequences: a lowered evaluation of a home’s value might mean that a person cannot get a home equity loan to help start a new business.  As we discovered in this last recession, lowered valuations of a  home can mean that homeowners are upside down on their mortgages.  Low valuations “box in” a homeowner’s choices so that they may feel that they can not move to a nearby town to be closer to a new job.  These cumulative effects can promote a defeatist attitude among homeowners.  In the past several years, many of us recently found that we were worth less – $50K, $100K, $200K – because the value of our homes had dropped.  Even though many of us had no intention of moving, we felt poorer.

The methodology underlying the calculation of the Consumer Price Index (CPI) involves the concept of Owner Equivalent Rent (OER).  The CPI treats home ownership as though the family who owns the home is renting the home to themselves.  In this sense, owning a home is like a owning a U.S. Treasury bond that pays regular interest payments, or coupons.  Until the recent recession, many regarded home ownership as though it were a Treasury bond, unlikely to ever lose value.  Even better than a Treasury bond, a house was likely to gain in value.

Most of us, however, do not think in  terms of OER.  We feel poorer when the value of our home drops by 20%. Likewise, a stock market drop of 20% has a significant effect on the value of our retirement funds.  Even if we do not need that money for 10 years or more, we are poorer on paper and this affects many other buying decisions.

***********************************

Spring Fever

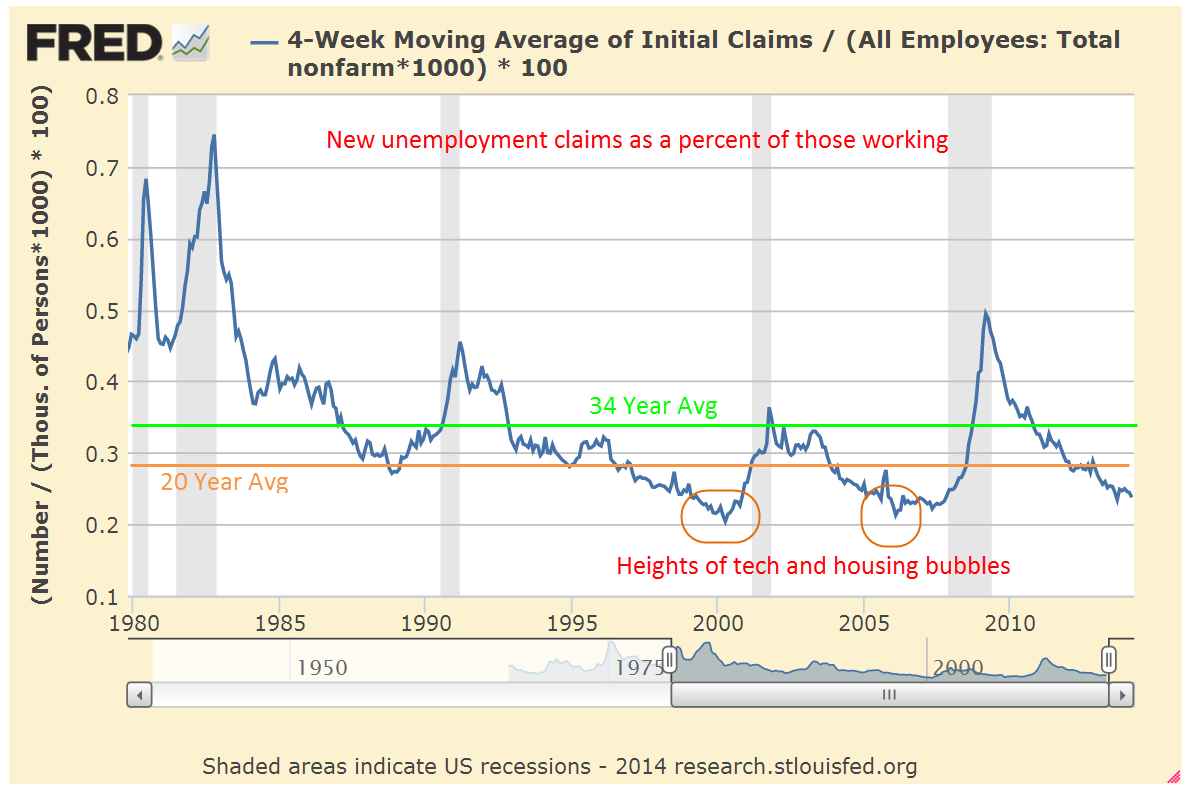
Other economic reports this week offset the negative news on home sales.  The flash, or preliminary, index of manufacturing activity indicates a positive report next week on the sector.  Durable goods orders were strong, reinforcing the signs that manufacturing is on a spring upswing.  New claims for unemployment were a bit above expectations but nothing significant and the 4 week moving average of claims indicates a much improved labor market.

Although UPS and 3M had disappointing earnings or forecasts, industrial giants GM and Caterpillar surprised to the upside, as did tech giants Microsoft and Apple.  Expectations for this earnings season were rather lukewarm but the aggregate earnings growth of the SP500 may come in below 1%.  Some attribute Friday’s drop in the market to accelerating tensions in Ukraine but the market was essentially flat this past week, reflecting a general lack of enthusiasm or worry.

************************************

Buffet Investing Advice

In mid March Warren Buffet got the attention of many when he made a surprising recommendation:

Put 10% of the cash in short-term government bonds and 90% in a very low-cost S&P 500 index fund. I suggest Vanguard’s. (VFINX) I believe the trust’s long-term results from this policy will be superior to those attained by most investors – whether pension funds, institutions, or individuals – who employ high-fee managers.

Doughroller presented some good observations on Buffet’s recommendation.  Also at the same site Rob Berger offers a fresh perspective on the stock – bond allocation mix.

**********************************

Consumer Price Index and College Tuition

In a recent analysis of trends in the various components of the Consumer Price Index, Doug Short presented several graphs of the annualized growth rates of the different components.  It comes as no surprise that medical care costs have risen 70% in the past 13 years.  The real surprise to me was that college tuition costs have shot up almost twice that – 130% in the same period.  Average tuition and fees for an in state student at a public four year college are currently almost $9K per year.

The growth in costs should worry parents with a son or daughter six years away from entering college.  Perhaps they may have planned on $10K – $12K a year.  However, if these growth trends remain as constant in the coming years as they have in the past, tuition and fees will be more like $15K per year when their child begins college.  By the time they graduate – if they graduate within four years – the cost could be $20K per year.  Remember, this doesn’t include any housing costs.  Higher education receives heavy subsidies from each state and the Federal government. So why the skyrocketing tuition costs?  Heavy lobbying, influence in the state capitols in the nation, inefficient and bloated administrative structures, protectionism – these are just a few of the reasons for the escalation in costs.  A spokesman for higher education won’t give those reasons, of course.  She will cite the need to attract quality teachers, investments in new technologies, aging infrastructure that is costly to maintain, and those certainly do contribute to increasing costs.  Higher education is still largely built on a framework that was suited for the sons of the landed gentry in the 18th and early 19th centuries.  As Obama and voters discovered after the 2008 elections, change comes slowly.  Like the tax system, higher education will continue to receive incremental changes, a hodgepodge of patches to fix this and that, to pad the pockets of this interest group or ameliorate a select slice of voters.

Earnings, Revenues and Retail Sales

April 20, 2014

You’re on a date with me, the pickin’s have been lush
And yet before this evenin’ is over you might give me the brush

Luck Be a Lady
from the play Guys and Dolls

Easy money

In opening remarks Tuesday at a Federal Reserve conference in Atlanta, Janet Yellen, head of the Fed, made the case that ongoing weakness in the global economy warranted support from central banks and that she did not anticipate full employment in the U.S. for another two years.  The Fed reported that the economies in all 12 Fed districts improved in March as consumers ventured out of their winter burrows. The stock market rose in each of the four trading days this week, but has still not risen to the level it opened at on Friday, April 11th, when the market dropped 2%.  Disappointing earnings reports restrained enthusiasm sparked by the prospect of continued easy monetary policy from the Fed.

**************************************

Earnings

On Tuesday, discount broker Charles Schwab reported a 58% increase in first quarter profits.  Trading volume was the highest in its history as many individual investors returned to the stock market.

In the tech sector, Intel and IBM reported declining revenues of 1% and 4% respectively.  The stock price of both companies is about the same as it was two years ago.  Intel is trying to transition from its traditional dominance in PC chips as sales of PCs continue to slow.  IBM is undergoing a similar transition from hardware – particularly mainframes – to business software.

Since early 2012, the Technology SPDR ETF,  a broad basket of tech stocks, is up almost 50%.  For an investor who does not have the time to research trends in a particular sector, particularly one as dynamic as the technology sector, buying a representative basket of the sector may be the safer choice.

American Express reported a first quarter drop in revenue of 4%, attributing most of the decline to small business and corporate spending.

Google reported an 8% drop in first quarter revenue from the fourth quarter.  Year over year, revenue rose 10% but investors have realized that the days of 20 – 40% annual revenue gains are probably over.  Since early March, the company’s stock has dropped 12%.

W.W. Grainger sells supplies, parts, equipment and tools to businesses.  Since 2009 revenues have risen almost 50% but sales growth has been meager since the middle of last year.  A few weeks ago, I noted the lack of growth in maintenance and repair employment.  Grainger’s lack of revenue growth and declining spending by businesses at American Express are disturbing indicators that there is a lack of confidence and investment in growth.

The industrial and financial megalith General Electric reported a year over year revenue increase of 2.2% but the company’s revenues have been fairly flat for four years and the stock price is almost 20% below its mid 2007 level.  GE is gradually shedding its financial businesses in order to focus on what it does best – making stuff, big stuff and small stuff.  With a dividend yield of 3.4%, this stock may be worth a more in depth look for investors who buy individual stocks and think that the company can make the transition.  As a side note:  in 2013, GE managed to defer $3.3 billion, or 85%, of its income tax liability, which will no doubt get some attention in the coming election cycle.  What won’t be mentioned is that GE paid over $8 billion in 2011 and 2012.

*************************************

Retail Sales and Household Debt

Retail sales were up a strong 1.1% in March, the most in two years.  Auto sales were particularly strong. Household debt is at the same level as it was in the 1st quarter of 2007 but has been slowly rising in the past year.  The years from the mid 1980s to the mid 2000s is often called the Great Moderation by many economists but the period is marked by an immoderate 8.6% annual growth rate in household debt.  Since the onset of the financial crisis and recession, households have jumped off that runaway train yet today’s levels still reflect a 34 year annualized growth rate of 7%.

With meager growth in personal income, it is unlikely that consumers can afford to rise to those heady and unsustainable growth rates in debt.  However, the percent of income needed to service that debt is at 34 year lows.  Growing consumer confidence and willingness to take on more debt may pull the economy out of the current lackluster growth.

*************************************

Margin Debt

A link on this blog is to the excellent work that Doug Short does.  In case you missed it, here are some graphs he presented on margin debt reported by the NY Stock Exchange, or the amount of money that investors have borrowed against their stock holdings.

I am not sure how reliable this indicator is.  Selling as margin debt starts to drop and buying as it starts rising again has mixed results.  The strategy would have kept a hypothetical investor out of the market during the market downturn in the early 2000s, back into the market in late 2003, out of the market in early 2008, and back into the market in July 2009.  So far, the timing looks great.  Since then, however, the rise and fall in margin debt has signaled some fake outs, so that an investor would have sold during a temporary market disruption, only to buy in later at a higher level.

Oddly enough, the last buy signal in February 2012 coincided with the Golden Cross in late January 2012.  The Golden Cross occurs when the 50 day moving average crosses above the 200 day moving average.

Employment, Obamacare and the Market

April 13, 2014

Nasdaq, Biotech and the Market

The recent declines in the market have come despite positive reports in employment and  manufacturing in the past few weeks.  Nasdaq market is off about 7% from its high on March 6th and some biotech indexes have lost 8% in the past few weeks. A bellwether in the tech industry is Apple whose stock is down about 9% since the beginning of the year, and 4% in the past few weeks.

The larger market, the SP500, has declined about 4% in the past six trading days, prompting the inevitable “the sky is falling” comments on CNBC.  The decline has not even reached the 5% level of what is considered a normal intermediate correction and already the sky is falling. It sells advertising.  The broader market is at about the same level as mid-January.  Ho-hum news like that does not sell advertising.

Both the tech-heavy Nasdaq and the smaller sub-sector of biotech are attractive to momentum investors who ride a wave of sentiment till the wave appears to be turning back out to sea.  In the broader market, expectations for earnings growth are focused on the second half of the year, not this quarter whose results are expected to be rather lackluster.  The 7-1/2% rise in February and early March might have been a bit frothy.

The aluminum company Alcoa kicks off each earnings season.  Because aluminum in used in so many products Alcoa has become a canary in the coal mine, signalling strength or weakness in the global economy.  On Tuesday, Alcoa reported slightly less revenues than forecast but way overshot profit expectations.  This helped stabilize a market that had lost 2.3% in the past two trading days.

On Thursday, the banking giant JPMorgan announced quarterly profit and revenues that were more than 8% below expectations.  Revenues from mortgages dropped a whopping 68% from last year, while interest income from consumer loans and banking fell 25%.  Investors had been expecting declines but not this severe.  JPMorgan’s stock has lost 5% in the past week, giving it a yield of 2.8% but it may need to come down a bit more to entice wary investors.  Johnson and Johnson, which actually makes tangible things that people need, want and buy every week, pays a yield of 2.7%.  Given the choice and assuming a bit of caution, what would you do?

The banking sector makes up about a sixth of the market value of the SP500, competing with the technology sector for first place (Bloomberg) The technology sector has enriched our lives immensely in the past two decades and deserves to have a significant portion of market value.  The financial sector – not so much.  They are like that one in the family that everyone wishes would just settle down and act responsibly.

****************************

Jolts and New Unemployment Claims 

February’s Job Openings report (JOLTS) recorded a milestone, passing the 4 million mark and – finally, after six years – surpassing the number of job openings at the start of the recession.  The number of Quits shows that there still is not much confidence among employees that they can find a better job if they leave their current employment.

New unemployment claims dropped to 300,000 this week; the steadier 4 week average is at 316,000.  As a percent of the workforce, the number of new claims for unemployment is near historic lows, surpassed only by the tech and housing bubbles.

*******************************

Full-time Employee

A 1986 study of Current Population Survey (CPS) data by the Bureau of Labor Statistics (BLS) found that “well over half of employed Americans work the standard [40 hour] schedule.”  The median hours worked by full time employees changed little at just a bit over 40 hours. The average hours worked by full time employees was 42.5.  The study noted that between 1973 and 1985 the number of full time workers who worked 35 to 39 hours actually declined.

A paper published in 2000 by a BLS economist noted that the Current Population Survey (CPS) that the Census Bureau conducts is the more reliable data when compared to the average work week hours that the BLS publishes each month as part of their Establishment Survey of businesses.  The Establishment survey is taken from employment records but does not properly capture the data on people who work more than one job.  In that survey, a person working two part time jobs at 20 hours each is treated as though they were two people working two part time jobs. The CPS treats that person as one person working 40 hours a week.  Writing in 2000, the author noted that the work week had changed little from 1964 – 1999.

Fast forward to 2013 and the BLS reports that full time workers work an average of 42.5 hours, the same as the 1986 study.  More than 68% of workers reported working 40 or more hours a week.

The House recently passed H.R.2575, titled the “Save American Workers Act of 2014” – I’ll bet the people who write the titles for these bills love their jobs.  I always envision several twenty-somethings sitting in a conference room with pizza and some poetic lubricant and having a “Name That Bill” contest.  I digress.  This bill defines a full time employee as one who works on average 40 hours a week, not the 30 hours currently defined under the Affordable Care Act.

When I first started doing research on this I was biased toward a compromise of 35 hours as the definition of a full time employee.  My gut instinct was that fewer full time employees work a 40 hour week than they did 30 years ago.   The data from the BLS doesn’t support my gut instinct.

******************************

Obamacare

A monthly survey of small businesses by NFIB reported an upswing in confidence in March after a fairly severe decline in February.  That’s the good news.  The bad news is that optimism among small business owners can not seem to break the 95 index since 2007.  According to the U.S. Small Business Administration 2/3rds of new jobs come from small businesses. “Since 1990, as big business eliminated 4 million jobs, small businesses added 8 million new jobs.”

This is the first full year that all the provisions of the ACA, aka Obamacare, take effect.  Millions of small businesses around the country who provide health insurance for their employees are getting their annual business health insurance renewal packages.  For twelve years, my small business has provided health care for employees.  When I received the renewal package a few weeks ago, I was disappointed to find several changes that made comparisons with last year’s costs a bit more difficult.  As an aside, this health insurance carrier has always been the most competitive among five prominent health insurance carriers in the state.

Making the comparison difficult was a change in age banding.  What’s that, you ask?  In my state, business health plans were age banded in 5 year increments; e.g. a 50 year old and a 54 year old would pay the same rate for a particular policy.  Now the age banding is in one year increments.  If I compared the cost for a 45 year old employee last year with the rate for a 46 year old employee this year, the rate increase was a modest 5%.  Not bad.  But if I compare a 48 year old employee’s rate last year with a 49 year old employee this year, costs have risen 11%.   The provider for my company no longer offers the same high deductible ($3000) plan we had, offering a choice between an even higher deductible ($4500) plan or one with a much lower deductible ($1200).  Again, this makes the comparison more difficult.   Changes like this make cost planning more difficult and are less likely to encourage small businesses to bother offering health coverage to their employees.

Out of curiosity, I took a look at 2002 prices. The company long ago abandoned the no deductible plan we had in 2002 simply because it became unaffordable – this was while George Bush was President.  A plan similar to the HMO plan we had in 2002 – $20 copay, $50 specialist, $0 routine physical, no deductible, $2000 Max OOP –  now costs 270% what it did 12 years ago, an annual increase of more than 8%.  An HMO plan as generous as the one we had in 2002 is no longer available, so a more accurate comparison is that health insurance has tripled in twelve years.   It is no wonder that many small businesses either offer no health insurance or cap benefits at a certain amount that reduces the affordability and availability of insurance for many employees.

Until the unemployment rate decreases further, employees and job applicants are unlikely to exert much pressure for benefits from small business employers, a far different scenario than the heady days of the mid-2000s when unemployment was low and employers had to bargain to get decent employees.  There is no one single powerful voice for  many small businesses, other than the NFIB,  which makes it unlikely that Congress or state representatives will get their collective heads out of their butts and address the myriad regulatory and cost burdens that are far more onerous on small business owners.  Because of that we can expect incremental employment gains.

Betraying the lack of long term confidence in the economy and in response to employment burdens, employers increasingly turn to temporary workers, who make up less than 2% of the work force.

As an economy recovers from recession, it is normal for job gains to be distributed unevenly so that the increase in temporary workers is far above their share of the workforce.  Employers are understandably cautious and don’t want to make long term commitments.  Gains in temporary employment as a percent of total job gains should decline below 10%, indicating a stabilizing work force.

For the past two decades of recoveries and relatively healthy growth the average percentage is 7.4% (adjusted for census employment).  The percentage finally fell below this average in early 2012, rose back above it for a few months then stayed under the average till January 2013.  Since February of last year, that percentage has been rising again, crossing above the 10% mark in January, an inexorable evaporation of confidence.

For the past year, repair and maintenance employment has flatlined at 1999 levels, indicating a lack of investment in commercial property and production equipment.

Specialty trade contractors in the construction industries are at 1998 levels despite an increase in population of 40 million.

While not alarming these trends indicate an underlying malaise in the workforce  that will continue to hamper solid growth.  Those ambitious and earnest folks in Washington, eager to make a difference and advance their political careers, continue to create more fixes which make the problem worse.  Imagine a car out of gas.  People out here on Main St. are pushing while the politicians keep hopping in the car to figure out what’s wrong, making the car that much more difficult to push.  At this rate, it is going to be slow going.

Employment and Economy Swings Up

April 6th, 2014

Capital Goods

Factory orders, including aircraft, rose in February but general investment spending on capital goods declined.  The leveling off of non-defense capital spending in the past year indicates a lack of certainty among many businesses to commit funds for future growth.

A more panoramic view of the past two decades shows a peaking phenomenon at about $68 billion, one which this recovery has not been able to rise above.

Remember that these peaks are in current dollars and do not take inflation into account.  When adjusted for inflation, the trend is not reassuring.  A significant component of capital goods orders comes from the manufacturing sector – manufacturers ordering capital goods from other manufacturers – whose declining share of the economy puts a damper on growth in this area.

**********************************************
Employment

Modestly strong job gains of almost 200,000 in March sparked hope that the winter doldrums are over. The private payroll processor ADP reported 191,000 private job gains in March, in line with expectations and revised their February job gains from 139,000 to 178,000.  The headline this month was that private sector employment FINALLY surpassed the level in late 2008.

Net gains or losses in government employment have been negligible in the past several months.  State and local governments have been hiring enough to offset the small monthly declines in federal employees. Total non-farm employment is still below 2007 levels but so-o-o-o-o close.

While the unemployment rate stayed unchanged, many more unemployed started looking for work.  A reader writes “I read that the labor force has increased by 1.5 million from Jan-Mar, but that doesn’t jive with the number of people hired over that time.  Am I missing something here?”

The labor force includes both the employed and the unemployed.  Unemployed people, including those who retire, who have not looked for work in the past four weeks are not considered active participants in the labor force.   Whether a person was 50 or 80, if they started looking for work, they would then be counted in the unemployed and in the labor force.

The Bureau of Labor Statistics (BLS) states that:
The basic concepts involved in identifying the employed and unemployed are quite simple:
People with jobs are employed.
People who are jobless, looking for jobs, and available for work are unemployed.
People who are neither employed nor unemployed are not in the labor force.
This definition of the labor force uses the narrowest, or headline, measure of unemployment.  Since the beginning of the year, the labor force has increased 1.3 million, 1.6 million since October.

When people get discouraged, they stop looking for work.  Then a friend says “Hey, ABC company is hiring,” and people start their job hunt again.  In the past quarter, a net 800,000 people have come back into the labor force, despite the record number of people retiring and leaving the work force.

As the economy improves, enrollment in for-profit and community college will continue to decline, accelerating from the 2% decline in 2012 – 2013 (NY Times article)  As students start looking for work, they officially re-enter the labor force.

Retirees: According to PolitiFact 11,000 boomers per day become eligible for Social Security.  Let’s say that only 8,000 per day drop out of the labor force, making a total of about 700,000+ who retired this past quarter.  A job market that can continue to overcome the drag from retirement is a sign of strength.

The Civilian Labor Force Participation Rate is the percentage of (employed + unemployed) / (people who can legally work).  So if the Civilian Labor Force were 150 million and there were 250 million people 16 years and over and not institutionalized, 150/250 = .6 or 60%.  The participation rate is currently at 63%.

**********************************************

CWPI

In the March ISM survey of service sector purchasing managers, employment rebounded strongly from the contracting readings of February.  New orders grew stronger; both of these components get more emphasis in the calculation of the CWPI.

Weighed down by the winter lull, the smoothed composite index of manufacturing and services growth has declined for six months in a row but this should be the bottoming out of this expansionary wave. Barring any April surprises, March’s strength in employment and new orders should lead to an uptick in  the composite in the coming months.

***********************************

Investing

What are the chances an actively managed fund beat its benchmark?  Not good.  An analyst at Standard and Poors compared various indexes that her company produces vs the performance of actively managed funds.  In the past five years, only 28% of large cap actively managed funds beat the benchmark SP500 index.  Some mid cap and real estate funds did much worse; less than 20% beat their benchmarks.  Consider also that actively managed funds carry higher annual fees and/or operating expenses because the fund has to pay for the brain power of active management.