Inflation Measures

“Everyone is entitled to his own opinion but not to his own facts.” – Sen. Daniel Patrick Moynihan

September 30, 2018

by Steve Stofka

The above quote has been attributed to the former Senate Majority Leader. People repeat the quote when discussing a contentious subject. We are often convinced that we have the facts when our facts may indeed be arbitrary. Let’s take the case of real or inflation-adjusted income. Has the average real wage declined or risen in the past decades? The calculation depends on which measure of inflation we choose.

There are two measures of inflation, the Consumer Price Index (CPI) and the Personal Consumption Expenditure Price Index (PCE). The CPI relies on surveys of what consumers buy. The PCE is based on surveys of what businesses sell (Note #1). The CPI uses a fixed basket of goods, regardless of changes in the prices of items in a basket. If the weekly basket of goods includes two pounds of ground beef, that two pounds never changes in response to lower prices. It is static. The PCE does adjust for price changes. If the price of a pound of ground beef went down thirty cents, the PCE calculates that a family bought a bit more ground beef and a little bit less chicken, for example. It is a dynamic measure.

People drive fewer miles and buy more fuel-efficient cars as the price of gas increases BUT only after a certain dollar amount. Our purchasing patterns are both static and dynamic. Because we are creatures of habit, our buying patterns are resistant to change. Within a certain price range, we will continue to buy the same items. Outside of that range, we do make changes because we want to optimize our choices.

In the past forty years the CPI has calculated an annual rate of inflation that is over ½% higher than the PCE rate. That small difference compounded over forty years amounts to 23%. That large difference tells two very different stories. Using the CPI, the average worker has lost a few percent in inflation adjusted hourly wages. Using the PCE, on the other hand, the average worker has enjoyed real gains of 20% in the past forty years (Note #2).

Our most volatile disagreements are in areas where facts are difficult to observe. The household survey data that underlies the CPI is unreliable because people living busy lives are not accurate journal keepers of their daily purchases. On the other hand, surveys based on business sales are inaccurate because people stock up on items whose prices decline.

Even when facts are readily verifiable, the interpretation of those facts varies with context. In arriving at our version of the meaning of those facts and their context, we subtract a lot of observable data.  We must filter reality because we cannot manage such a large amount of information. Because we filter our perceptions, eyewitness testimony is unreliable. Although our perceptions are inaccurate, we must act on those perceptions and hope that they are accurate enough. That same reasoning guides economists, politicians, and those in the social and physical sciences. We would all have more constructive discussions if we understood the imperfection of our perceptions.

//////////////

Notes:

1. The Difference between CPI and PCE {Federal Reserve}

2. Using the average hourly wage for production and non-supervisory employees.

The Crack in the World

Ignorance has one virtue: persistence. – John Kramer, Blythe

September 23, 2018

by Steve Stofka

Ten years ago, the financial world cracked. Job losses during the first eight months of 2008 were definite signs of recession, but this correction to an overheated housing market had been expected for two years. In July 2008 came the news that June’s job losses had eased. The average duration of a post-WW2 recession was eight months, so the correction was nearing an end. More worrying were the high gas prices, which had topped $4 per gallon. Beginning in mid-July, the stock market rose more than 5% and traded in a consolidation level through August.

In early September, the market lost 3% when August job losses worsened. Within a week, the market recovered those losses and closed on Friday, September 12th at the consolidation level it had been at during August. Over that weekend, the Federal Reserve, U.S. Treasury and other banking agencies tried to arrange a rescue of the investment firm Lehman Brothers.

On September 15th, the world learned of the firm’s collapse. Within hours, the market lost almost 5% of its value, more than the market may gain or lose in a year. In busy urban areas, people stopped to stare at the market’s extraordinary volatility displayed on storefront TV screens. There were more such days to come. Over the next two weeks of turbulent price swings, the market stabilized at its mid-July low, closing September just below 11,000.

What stabilized the market in those closing days of September? On September 30th, the N.Y. Times reported that the Securities and Exchange Commission (SEC) might suspend a newly implemented FASB international accounting standard SFAS 157 (Note #1 and #2). This accounting rule required financial institutions to value loans and other assets on their books at market value, not by the present value of future cash flows (Note #3). In turbulent markets, when raw fear is the auctioneer, market prices do not reflect the future value of assets.

After a TARP bill (Note #4) failed to pass Congress on the first go, there would be another attempt by the end of the first week in October. Neither the Congress or the administration could summon the political will to temporarily suspend the accounting rule. The TARP bill that President Bush signed on Saturday, October 3rd, required only that the SEC study the accounting rule.

Investors ran for the exits. The financial carnage may have happened in September, but the market implosion happened in October. In seven consecutive days in early October, the Dow Jones Industrial Average lost almost 23% of its value (Note #5). Did an accounting standard cause the financial crisis? No, but it did intensify negative investor reaction to the financial crisis, which exacerbated the crisis in a negative feedback loop.

In early March 2009, after the market had lost 40% of the value it had in early October 2008, the FASB announced that they would modify the standard a month later (Note #6). By the time that modification was implemented on April 9, 2009, the SP500 had risen 20%.

Could the Bush administration have eased the response to the crisis? Yes. Did accounting standards cause the financial crisis? No. Can we expect another crisis sooner rather than later? Yes. Central bankers and Federal agencies that supervise the banking system cannot fully monitor modern credit markets in real time. When the horses are spooked, regulators sitting in the driver’s seat may hold the reins but have little control of the panicked animals.

Investors who maintain some balance in their savings portfolio can weather these market catastrophes. 50% market falls have occurred only three times in the past fifty years (Note #7). Investors with long time horizons can afford to take a less balanced approach.

//////////////////////

1. The FASB is a privately held international organization that sets accounting standards. Fair Value Accounting standard SFAS157 (“mark to market”) is one of their standards, implemented in 2006. An explanation of the standard from FASB in May 2008, before the crisis.

2. Suspension of the SFAS 157 standard would have allowed banks to report higher profits and relieve some of the capital pressures on bank balance sheets. Sept. 30th NY Times article.

3. FDR suspended mark-to-market accounting in 1938. See this March 2009 article for a  review of the issue.

4. TARP – The Troubled Asset Relief Program was a compilation of many programs designed to support the automotive, housing and financial industries. On page 11, a reminder of the corruption of Wall Street and the incompetence in Washington. “In March 2009, after receiving $170 billion in federal bailout money with another $30 billion pending, AIG announced a $165 million bonus payout to executives. Despite the bailout and the U.S. government having ownership control, AIG management thought it was prudent to pay executive bonuses in a financially struggling company. The U.S. government lacked the oversight to assure efficient use of taxpayer bailout funds.”

5. The sharp fall in October was the second sharpest decline since World War 2. The leader is the October 1987 crash, when the market lost 28% in four days.  What about the dot-com bust? Over 2-1/2 years, the market lost half its value but there wasn’t a decline of more than 20% during that market fall. The strongest decline began in February 2001 and took 34 trading days to lose 18%.

6. An article from the Harvard Business Review in November 2009.

7. 50% market falls: The gas crisis of 1973-74, the dot-com bust of 2000 – 2003, and the mortgage and financial crisis of 2007-2009. Less severe falls came in 1966, 1969-70, 1977-78, 1982, 1987, 1990, and 2011. These were all more than 20% drops in market value.

/////////////////////////

Misc

In mid-2016, the inflation-adjusted price of the SP500 index finally rose above its price at the start of the century. The price has risen 25% since then.

InflAdjSP500

Not Trading

“It takes a lot of time to be a genius. You have to sit around so much, doing nothing, really doing nothing.”― Gertrude Stein

September 16, 2018

by Steve Stofka

As the U.S. market grinds higher, emerging markets are in bear territory, off 20% from their highs at the beginning of the year and selling at 2007 prices. After nine years of recovery, the U.S. economy is in the late stages of the cycle. Warnings of an impending market fall will come true at some point. If the market falls in 2020, those who called for a fall in 2014 will say, “See, I called it. Buy my book.” This year, hedge funds, the smart money, have underperformed index funds, the dumb money. For several years, passive index funds have outperformed active fund managers, a phenomenon that some warn will lead to a catastrophic meltdown when it happens.

For the average retail investor, it is difficult to beat buy and hold. An investor who bought the SP500 index 25 years ago would have earned 9% per year in price appreciation alone. Adding in dividends would have raised the annual gain to 9.58%. That is what is called a “Buy and Hold” (BnH) strategy. It’s not a strategy. It’s a strategy of no strategy, and yet it is surprisingly difficult to consistently beat a no-brainer no-strategy like BnH over several decades. The stock market earned this while riding through two downturns that erased half of the market’s value. Even a middle of the road strategy of 60% stocks and 40% bonds earned 8.3% annually during the same period.

Traders develop rules that work in one decade, but don’t work in the next. A strategy that worked well in the years 1998-2007 didn’t work well in the period 2008-2017. Why? Because they were two different time periods, with different events and circumstances (Note #1).

Here’s a rule that could have earned an investor twenty – yes, twenty – times BnH in the period from 1960-1993. The rule did not work in any timing frame other than daily. Each morning at the open, buy the SP500 index if the previous day was up, sell if it was down. Huge profits even after trading costs (Note #2). 1993 – 2018? It was a losing strategy. It would have been better to do exactly the opposite – sell after an up day and buy after a down day.

Every year thousands of people will shell out good money for a winning strategy that promises to best the market. Most strategies don’t beat the market consistently. Those that do are guarded like the nation’s gold at Fort Knox and are not shared. For the rest of us, the winning strategy is a few rules: save money and invest in a balanced portfolio that is appropriate for our age and needs in the next five years.

///////////////////////////

Notes:

  1. From 1998-2007, an emerging market index fund (VEIEX) earned 15.08% annually. From 2008-2017, that same fund earned 1.13% annually. For the combined twenty-year period, the annual gain was 7.87%.
  2. Until the SPY exchange traded product was created in 1993, there was no product that enabled a retail investor to trade daily and frequently. Mutual funds that mimicked the index restricted the frequency of trades. I used the daily SP500 index numbers as though there had been such a product created in 1960.

The Reputation of Money

To be respected, authority has got to be respectable. – Tom Robbins

September 9, 2018

by Steve Stofka

Most nations create their own money, a super power of the modern state. The politicians and central bankers of each country have the responsibility to maintain the reputation of its money. Each nation is both the creator and net seller of its money, able to lower but not raise its comparative value. To raise that value, each nation depends on others to be net buyers of its money.

Nations carefully study the behavior of each other’s central banks. Argentina cut interest rates in January 2018 even though the country was experiencing high inflation. This action was the opposite of good central banker behavior, and hurt the reputation of the Argentine peso, which has lost half its value since January. Money traders suspected that the Argentine central bank had become captive to political control. Few trusted a politician with money super powers.

The reputation of a nation’s money rests on the steadiness of its tax revenues. As I have noted before, revenue from the sale of nationalized resources acts as a tax. Those commodity revenues do not build a money’s reputation as much as the tax revenues from the economic production of a nation’s people and businesses.

A nation can print its own money at little cost. A greater supply of anything, given a constant demand, lowers the price of that thing. The real cost of printing money is borne by the nation’s people and businesses who use that money for daily exchange. As a money’s value declines, that loss of value acts as a sales tax on each money unit exchanged. Let’s call that the king’s tax. This undeclared tax revenue does not build a money’s reputation.

A nation supports the reputation of its money by using its super powers with restraint. When a nation receives most of its tax revenues from its own internal production, that is a sign of a healthy economy, with a reasonable monetary and fiscal policy. When the king’s tax (inflation) and commodity resource revenues exceed half of a nation’s revenue, the value of its money becomes like two day old bread.

A nation’s money rises in reputation when it is bought, and there are two reasons for buying a nation’s money: 1) buying goods and services from that nation, and 2) loaning money to the governments and businesses of that nation. In 2017, China, the United States and Germany were the top exporters, putting their currencies in demand (Note #2). Loans to borrowers in emerging markets are often priced in U.S. dollars, the current reserve money of the world. If the money in that nation loses its value against the dollar, the borrowers effectively pay a king’s tax as they make their loan payments (Note #1). Typically, a nation will blame the tax on rapacious money dealers.

A nation’s money reputation relies on several factors that a nation can control: inflation, tax revenue and the source of that revenue. A nation is judged on its current and historical behavior with money and debt. Its political structure and the independence of its central bank are important factors as well. On an international stage, its money must compete with other nations in all these categories. Call it the daily beauty contest – no swimsuits.

///////////////////////////////

1. EMB is a basket of emerging market debt priced in USD (http://etfdb.com/etf/EMB/). It is off 5% from its high at the beginning of the year and pays a dividend of 4.6%. Its annual return for the past ten years was 6.5%, the same as a long Treasury ETF like TLT. A broad bond index fund like Vanguard’s BND earned 3.8%.

2. Germany uses the Euro, not its own national currency. In 2017, China exported $2.35 trillion, the U.S. $1.55T and Germany $1.45T. Visual Capitalist picture graph. The site is a picture book for curious minds. Here’s one on the biggest employer in each state. For southern states, the answer is Wal-Mart. Universities and health care systems are prominent employers in many states.

Related: The U.S. owes $6.2 trillion to the rest of the world. China’s share of that debt is $1.8 trillion. The U.S. holds $125 billion in foreign reserves, similar to the amount Turkey holds. As the world’s reserve money, the U.S. holds enough foreign reserves to counter any distortions in currency markets.

/////////////////////////////

Miscellaneous

In a survey of 5000 workers, Gallup found that only 51% had a single full-time job.  36% were gig workers.

Since 1991, real purchase only house prices have gone up 1.7% annually. FRED series HPIPONM226S / PCEPI, index 3/1991 = 100. Real rents and owner equivalent rent (OER) nationally have gone up 8/10ths percent annually. This is about half the rate of home price growth. Urban residents must pay an extra price. In Denver, rental prices have gone up 1.9% annually since 1991. OER has risen 1.7% annually. No doubt, California cities have even higher annual growth rates than national averages. Owner Equivalent Rent is a BLS-calculated rent that a homeowner pays themselves for use of the residence. This includes mortgage, repair and maintenance costs on the home.

The Force of the Fed

To some extent, the Federal Reserve considers itself government. Other times, when it serves, it considers itself not government. – Philip Coldwell, President FRB Dallas 1968-74

September 2, 2018

by Steve Stofka

The nations of the world are the gods of Mt. Money, most of them with central banks who administer the credit and currency of each nation. Like the ancient Mt. Olympus of Greek lore, there is competition and a hierarchy among the gods. Currently the U.S. is the top god of Mt. Money.  Central banks manage credit by changing the interest rate, or price, that they will charge the demi-god banks within the nation’s borders. The banks, however, do not perfectly distribute the intentions of the central bank. Acting as intermediaries, the banks filter monetary policy and have a more direct effect on the economy. In this intermediary role, banks control the draining of Federal taxes generated by the economic engine.

In the U.S., the Federal Reserve (Fed) is the central bank of the Federal government, an independent agency created by Congress which has given it two targets: promote full employment and stable inflation. To meet those goals, Fed economists must gauge the strength of the economy, a difficult task, and estimate an ideal state of the economy, an even more difficult task.

Each August the Federal Reserve holds an economic summit at Jackson Hole in Wyoming. The newly appointed head of the Federal Reserve, Jerome Powell, is the first non-economist leading the central bank in 39 years. His paper (Note #1) is plain spoken and illustrates the difficulty of reading an economy in real time. As such, I think he will be a gradualist, someone who advocates measured moves in interest rates unless there is a more abrupt shift that requires a stronger policy tonic.

Powell uses the analogy of a sailor steering the waters by reading the stars. The waves and weather can make real time observations unreliable, yet the sailor must make decisions that steer his course. Optimizing employment is one of the two missions that Congress has given the Federal Reserve. The Fed must make a real-time estimate of what they think is the optimum or natural rate of unemployment (NAIRU) and adjust interest rates to help align the actual unemployment rate to the natural rate. Powell presented a chart that compares the actual rate of unemployment to NAIRU as it was estimated at the time, and the “hindsight” NAIRU as economists now calculate it. (Note #2) The speech balloons are mine.

UnemployEstimatesPowell2018

On page seven, Powell writes that, in the past, the central bank “placed too much emphasis on its imprecise estimates of [NAIRU] and too little emphasis on evidence of rising inflation expectations.”

Note the final word – expectations. Measuring what will happen is especially difficult because it has not happened. Probability methods can help but an economy has many more inputs than a dice game. One category of estimates are surveys of guesses about what will happen in the future, but these overstate actual inflation [Note #3]. A second category uses market prices. One method uses the price that buyers are willing to pay for a Treasury Inflation Protected Security (TIPS) (Note #4) In my July 22nd post, I introduced another market method – the net flow of money into the economic engine (Note #5)

Credit expansion has been poor since the Financial Crisis. The Fed cannot force banks to increase or decrease their loan portfolios by changing interest rates. In the years following the Financial Crisis, the Fed was frustrated by this inability, called “pushing on a wet noodle.” Interest rates are the carrot. The stick is a complex regulatory process that raises or lowers asset leverage ratios to encourage or discourage lending (Note #6).

The Fed manages credit flow through asset sales and purchases. While the central banks of other countries can buy stocks and commodities, the Fed is limited to buying debt, including foreign currencies, from its member banks (Note #7).

The Fed has the extraordinary power to purchase or sell the reserves of its member banks without their consent. Like the Fed, you or I can increase the reserves of a bank by depositing money in the bank (Note #8). What we can’t do is lower those reserves by writing our own loans. However, credit card companies, who are underwritten by banks, do provide us with a line of credit that we can draw on by using our cards. During the Financial Crisis, credit card debt jumped $50B, or 15%, because card holders reduced their payments by that much. In response, credit card companies reduced credit card limits by 28% (Note #9). While the Fed encouraged banks to loan, the behavior of consumers and businesses did the opposite. Consumers and businesses were more powerful than the Fed.

The banks administer or filter Fed policy in their interactions with consumers and businesses. If a bank must pay higher interest for its funds, then it will charge higher interest rates for consumer and business loans. Interest is the price for a loan. When the price rises, the supply for loans rises (banks make more profit on the spread) but demand for loans falls. The reverse is not true, as the data of the past decade has shown. When the price falls, the supply of loans falls while the demand increases.

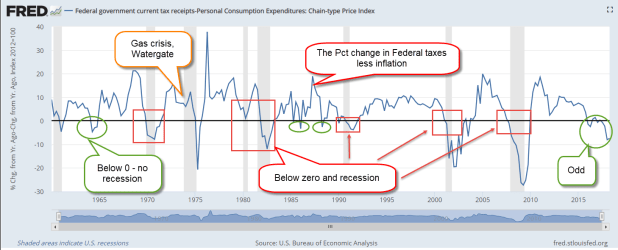
Less credit expansion results in a slower economic engine, which generates less Federal tax revenue. For the engine to run properly, the internal pressure must remain stable. Inflation is one gauge of that internal pressure. The annual growth in Federal tax revenue must be equal to or greater than the inflation rate. When it is not, the engine begins to stall. In the graph below, I’ve charted the annual growth in Federal tax revenue less the inflation rate. Note the periods when this metric dropped below zero. In most cases, recession follows. Look at the right side of this chart. There has never been a time when the reading is so far below zero without a recession. That is a cautionary note.

FedTaxLessInflation

The Fed must look through the fog of the future before it deploys its money super powers. In the face of this, the Fed must act with humility and a practical caution. Once it has decided on a strategy, the banks modify its implementation because they obey three masters: the Fed, their customers and their stockholders. Actual monetary policy becomes not the work of a select few in the Federal Reserve but an emergent composite of policy force and practical friction.

/////////////////////////

1. Powell’s speech is 14 pages double-spaced with several pages of charts and references.

2. For thirty years, from 1955 to 1985, the gap between the real-time estimate of NAIRU and the hindsight estimate is 1-1/2%, an error of 25%. In the 1990s economists’ models were more accurate. The estimate of NAIRU and its validity is debated now as it was in 1998 when Nouriel Roubini referenced several views on the topic.

3. A one-page Fed article on survey and market methods of measuring inflation expectations.

4. A one-page Fed article on long-term inflation expectations using the implied rate of TIPS treasury bonds – currently it is 2.1%. Vanguard article explaining TIPS bonds.

5. The net flows of credit growth, federal spending and taxes precedes inflation by several months (July 22 blog post).

6. Credit growth has been flat for the past decade as I showed in this July 15th post.

7. In conjunction with the Treasury, the Federal Reserve may buy foreign currencies to correct disruptive imbalances in interest rates. A NY Fed article explaining the process.

8. When we deposit money in a bank, its reserves, or cash balance, increases on the asset side. It incurs an offsetting liability of the same amount because the bank owes us money. We have, in effect, loaned the bank money. When so many banks collapsed before and during the Great Depression, people came to realize the true nature of depositing money in a bank. The banks could not pay back the money that depositors had loaned them. The creation of the FDIC insured depositors that the money creating powers of the Federal government would stand behind any member bank. My mom grew up during the Depression era and passed on the lessons learned from her parents. She would point to the FDIC Insured decal on the bank window and tell us kids to look for that decal on any bank we did business with in the future.

9. Credit card companies lowered limits. See page 8. Oddly enough, this Fed study found “we have little evidence on the effect of such large declines in housing wealth on the demand for debt.” Page 9. NY Fed paper written in 2013.