New Home Sales Sink

April 26, 2015

Housing

A few months ago sales of new homes per 1000 people climbed above the low water mark set during the back to back recessions of the early 1980s.  In a more normal environment, new home sales would be closer to 800,000, not 500,000.

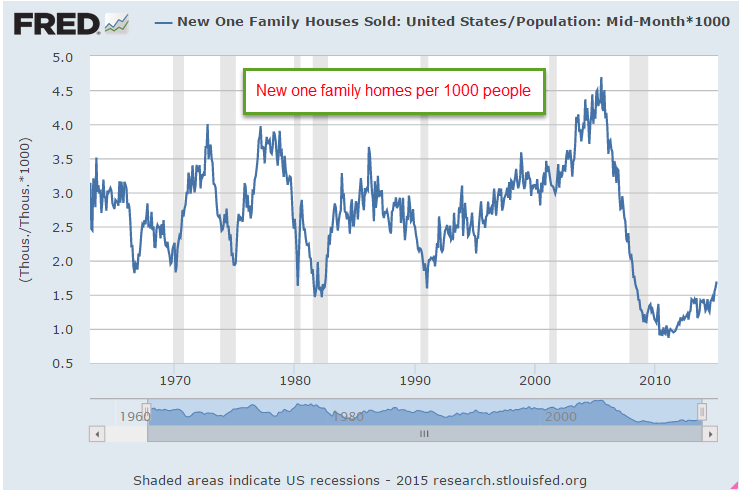
This past week came the news that new home sales fell more than 11% in March.  The good news is that they were up more than 10% over this month last year.  The supply of new homes is still fairly thin, less than half a year of sales, so builders are unlikely to slow the pace of construction.  As new home sales were climbing this winter, sales of existing homes – 90% of all home sales – languished.  The process flipped in March as existing home sales surged, up 10% year over year.

************************

Long Term or Short Term

Somewhere I read that all investment or savings is a loan.  Loans are short or long term, principle assured or not.  When we deposit money in a checking or savings account, we are loaning the bank money, principle assured.  When we buy shares in an SP500 index mutual fund, we are loaning our hard earned money to “Mr. Market,” as it is sometimes called.  Principle not assured. We hope we get paid back with a decent rate of interest when we need to cash in our loan.  Most of us probably think that this type of investing is long term but, in this model, most stock and bond investments by individual investors are liquid, which is by definition short term.  Every month that a person leaves their money in a stock or bond fund, it is a decision to roll over the loan.  The value of our asset loan depends on the willingness of others to roll over their loans to that same asset market.  Occasionally many lenders to the stock and bond markets shift their concern from return on principal to return of principal and call in their loans.  When phrased this way, we come to understand the inherent fragility of our portfolios.

Because pension and sovereign wealth funds may carry a sizeable position in a market, the entirety of their position is not liquid.  Substantial changes in position will probably affect the price of the asset.  Even in a large position, however, there is a certain amount of liquidity because the fund can sell so many thousand shares of an asset without a material change in the price.  A family’s decision to leave their 401K money in a stock fund in any month, to roll over the loan, joins them at the hip with a sovereign wealth fund in Dubai or CALPERS, the California state employee pension fund.  They are all participants in the short term asset loan market.

In March 2000, at the height of the dot-com boom fifteen years ago, many investors were still loaning money to the NASDAQ market (QQQ).  This past month investors who had bought and held QQQ finally broke even on the nominal value of their loans.   The relatively small dividend payments over the years hardly compensated for the 27% loss of purchasing power during those fifteen years.  

***********************

Taxes

Every facet of our culture seems to get a calendar month, so I guess April is tax month.  In that spirit, let’s look at some historical trends in income taxes.  In 2001, the Congressional Budget Office did an assessment of changes in Federal tax rates by income quintile for the years 1979 – 1997.   These are effective, not marginal, rates.  If someone makes $100K gross and pays $15K in Federal income tax, then their effective rate is 15%.

Effective corporate income tax rates went down for all quintiles while Social Security and Medicare taxes went up for those at all income levels.  The top 20% of incomes saw little change in their effective rates during this 19 year period, while everyone else enjoyed lower rates.  The reason why the top 20% saw little reduction was that their income grew faster than the incomes of those in the other quintiles.

The negative income tax rate for the lowest quintile was due to the adoption of the Earned Income Tax Credit and the increasing generosity of the credit given to low income families. (In 1979, a worker with three children received $1400 in 2012 dollars.  In 2012, they received $5,891, a 400% increase)

*********************

International Currencies

This graphic from the global financial nexus Swift com shows just how much the US dollar and the Euro dominate international trade.  For those of you interested in international currency wars, you might like this Bloomberg article.

Bank analyst Dick Bove thinks that it is unlikely that the Fed will raise interest rates this year.  The U.S. dollar has gained so much strength that a raise in interest rates has too many dangerous implications for other economies and would destabilize global trade.

A well written, informative and entertaining read is James Rickards’ Currency Wars (Amazon).  The author, a former CIA agent, weaves a coherent and interesting narrative that connects a lot of information and events of the past one hundred years.

Avoidable Taxes

April 19, 2015

Taxes

Some call them loopholes, tax breaks, or giveaways but the official name for them are tax expenditures.  In August of last year, the Joint (House and Senate) Committee on Taxation detailed  the many gimmes in the tax code.  The Pew Research Center graphed out the largest expenditures including the big banana, tax free employer paid health insurance premiums. (They forgot to include the $38 billion in Sec. 125 cafeteria plans.) That program started during World War 2 when wage increases were frozen by law.  That war ended 70 years ago but the “temporary” tax break goes on and on.

The list of giveaways runs for 12 pages. Those with incomes above $100,000 get 80% of the mortgage interest deduction (page 37), 90% of real estate tax write-offs (page 38),  60% of the child care credits (page 39), and claim 86% of the charitable contributions (page 38).  Reduced rates on dividends and capital gains cost almost $100 billion in 2014.

28 million low income families qualify for the earned income tax credit but the $68 billion cost for that is less than half the cost of tax free health insurance premiums.  Almost 37 million families claim a child tax credit for $57 billion dollars (page 41).

Seniors get $60 billion of gimmes in tax free Medicare benefits (page 32).  In 2015, tax breaks for all types of medical spending will total almost 1/4 trillion dollars in foregone tax revenue.   As spring arrives, let’s lobby for tax deductions for gardening expenses.  Gardening is therapeutic, a genuine medical expense.

*************************

CWPI

As expected, the composite Purchasing Managers Index (PMI) in the manufacturing and service sectors declined further but remains strong. We may see a slight decline for one more month before the cycle upwards starts again.

New orders and employment in the service sectors is strong and growing, offsetting some weakness in the manufacturing sector.

March’s retail sales gain of almost 1% was a bit heartening after the winter slump.  Excluding auto sales, year over year gains have dropped sharply since November and the trend continued in March as the yearly gain was only 1/4%.

************************

Labor Market Conditions Index

The Federal Reserve takes about a week after the release of the monthly labor report to compile their Labor Market Conditions Index (LMCI), a comprehensive snapshot of the many facets of the labor market.  For the first time in three years, the index turned negative in March.  It barely crossed below 0 but is sure to give some pause, a watch and wait when the FOMC meets at the end of this month.  While some of the FOMC members have been making a more aggressive case for raising interest rates, chair Janet Yellen is sure to point out that the economy is below target in both employment and inflation.

************************

Mortgage Banking

In an April 8th article, the Wall St. Journal reported that loans backed by bank deposits fell from 44% in 1980 to 20% in 2008.  Since 2012, the big banks have fled the mortgage business and now account for only a third of new federally guaranteed mortgages.  Small finance companies, which avoid much of the oversight and regulation in Dodd-Frank, now account for more than half of new mortgages.

************************

Gobs of Jobs

April 12, 2015

Last week I wrote about the recent flow of investment dollars to markets outside the U.S.  This week emerging markets (EEM, VWO, for example) shot up another 4%.  For the first time since last October, the 30 day average in these two index ETFs just broke above the 100 day average.

******************************

Job Openings (JOLTS)

February’s JOLTS report from the BLS, released this past Tuesday, showed that the number of job openings is nearing the heights of the dot com bubble in 2000.

Last week we saw that new claims for unemployment as a percent of people working were at historically low levels.  I’ll show the graph again so I can lay the groundwork for an explanation of why bad things can happen when things get too good.

Here are job openings as a percent of those working. I’ll call it JOE. In 2007, JOE approached 3.5%.  In 2000 and these past few months, it exceeded that.  As openings fall below a previous low point, recessions follow as the economy “corrects course.”  I have noted these transition points on the chart below.  September’s low of 3.3% marks the current low barrier.  Any decline below that level would be cause for worry.

Let’s look at it from another angle.  Below are job openings as a percent of the unemployed who are actively looking for a job.  This metric would give us a rough idea of the skills and pay mismatch.  This looks a bit more tempered. We are not at the high level of 2007 and not even close to the nosebleed level of 2000.

As openings grow, one would expect that some who have been out of the labor force would come back in but that doesn’t seem to be the case this time.  The participation rate remains low.  The reasons for this trend are partly demographic – aging boomers, small GenX population, end of the female labor “wave” into the labor force during the past few decades – but we should expect to see some uptick in the participation rate, some positive upward response to economic growth.

As jobs become harder to fill or applicants want more money to fill those jobs, employers may decide to cut back expansion plans rather than hire people who are are either too costly to train or who might not meet the company’s work standards. Employees who previously tolerated certain conditions or a level of pay at their job now act on their dissatisfaction.  They may leave the job or ask for more money or a change in conditions.  Little by little investment spending ebbs, then declines a bit more, reaches a threshold which triggers layoffs, and another business cycle falls from its peak.

**********************

Bank of Japan

Recently the NY Post reported  that the Bank of Japan (BOJ) was buying equities and the author implied that BOJ was pumping up the stock market. The central bank in the U.S. buys only government bonds, not equities.   Warnings of doomsday are popular in financial reporting because people pay attention. The truth just doesn’t get much attention because it is not exciting. I want to help the reader understand how misleading these kind of cross country comparisons can be.

Here is a comparison of the holdings of the U.S., Japanese and European central banks.  Look closely at the holdings of insurance and pension funds in the U.S. and Japan.  Notice that U.S. pension funds (which are government funds or private funds guaranteed and regulated by the U.S. government) have 9% equity holdings while Japan’s insurance and pension funds have only 2%.   Combining the holdings of the central bank and insurance and pension funds, we find that Japan has 4% in stock assets while the U.S. has 9% of its assets in stocks.  Contrary to this reporter’s implications, it is the U.S. government that is pumping up the stock market far more than the Bank of Japan.

The author quotes a Wall St. Journal article from March 11, 2015: “The Bank of Japan’s aggressive purchasing of stock funds” but only seven months ago, on August 12, 2014, that same newspaper reported: “As Tokyo shares fall back from their recent highs, the Bank of Japan has been significantly stepping up its purchases of domestic exchange traded funds.” [my emphasis]
Note the difference in wording.  The earlier article notes that BOJ is buying domestic equities, particularly ETFs, which are baskets of stocks.  The later article leaves out these important distinctions, leading a reader to believe that BOJ policy might be pumping up the U.S. equity market or any market, for that matter. The data does not support that contention.

What U.S. investors should be concerned about (I mentioned this in last week’s blog) is that federally guaranteed pension plans and government pension plans are finding it difficult in this low interest rate environment to meet their projected benchmark returns of 7% to 8%.  A more realistic goal is 5% to 6% for a large fund with a balanced risk profile.  Pension plans are having to take on more risk at a time when boomers are retiring and wanting the money promised in those pension plans.  These investment pools can not afford to wait five years for asset values to recover from a severe downturn, making them more likely to adjust their equity or bond positions as quickly as they can in the case of a crisis of confidence in these markets.  Be aware of the underlying environment we are living in.

Easter Egg

April 5, 2015

On this Easter Sunday, Christians celebrate the Resurrection of Jesus, Jews observe Passover, basketball fans await the final contest of the Final Four and baseball fans look forward to the start of the new season.  After Friday’s disappointing report of job gains in March, investors might be wondering what will happen Monday when markets in the U.S. reopen following Good Friday.  In overseas markets, yields on the 10 year Treasury bond fell on the employment news.  Job gains that were about half of expectations helped allay fears of a June rate increase.  We may see a positive response from both the bond and equity markets on Monday as the time table for rate increases might start in September.  On the other hand, the weekend might allow more rational judgment to prevail. One month’s disappointment does not a trend make.  Year over year gains in employment are especially strong.

April is usually a good month in the stock   market.  Since breaking the 2000 mark in August, the index has neither gained or lost much ground.  Gains in the technology companies that are included in the SP500 (Apple, for example) have been offset by losses in the oil sector of the SP500 (Exxon, Chevron, for example).  Long term Treasuries (TLT) have risen 10% in the past six months, despite the prospect of rising interest rates in 2015.

ICI reports that domestic long term equity mutual funds had an outflow of about $8 billion in March. Investors have not abandoned equity funds by any means but have changed focus. During this past month, $14 billion flowed into world equity funds.   Bond funds continue to post strong inflows – $10 billion in March.

The boomer generation amassed a lot of pension promises through their working years.  Pension funds must balance both equity and bond risk in their investment portfolios  and yet try to meet their assumed growth rates of 7% – 8%.  Caught on the horns of this dilemma, pension funds straddle both the equity and bond markets.  During the past ten years, many have become underfunded because they have not been able to match their projected growth rates.   This delicate balance of risk and reward sets the stage for a catastrophic decline in response to even a relatively small monetary shock because pension funds can not afford to wait out another three or four year decline.  Too many boomers will start cashing in those promises accumulated during the past decades.

The relatively low number of new jobs created in March was probably due to the severe winter in the eastern part of the country.  The BLS revised downward their previous estimates of employment gains in January and February.  Even with the downward revisions and this past month’s relatively anemic 126,000 gains, the average for the quarter is still about 200,000 per month, a particularly strong figure when one considers the impact that plummeting oil prices have had. In the first 3 months of this year, companies in oil and gas exploration have shed 3/4 of the jobs added during all of last year.  The strong dollar makes U.S. exports more expensive and hurts manufacturing.  The employment diffusion index in manufacturing industries dropped below 50, a sign that there is some contraction in the 83 industries included in this index.  However, March’s Manufacturing Purchasing Managers Index showed some slight expansion still and employment in manufacturing is still strong.  Across all private industries, the diffusion index remains strong at 61.4.

Fed chair Janet Yellen has repeatedly said that interest rate decisions will be based on data.  If the data of subsequent months show a resumption of strong growth, an interest rate increase at the FOMC meeting in late July could still be in the cards.  The CWPI composite built on the PMI anticipated a declining trend in growth this winter and spring before resuming an upward climb.  When the non-manufacturing  PMI is released this coming Monday, I’ll update that and show the results in next week’s blog.  Based on the numbers already released, I do anticipate a further decline in March then an evening out in April.  The particularly strong dollar  has cast some doubt on growth predictions, particularly in manufacturing. Both oil and the dollar have made sharp moves in the previous months and it is the rate of change which can be disruptive in an economy.

**********************

Unemployment

New claims for unemployment were the lowest since the spring of 2000, just as the bubble of the dot-com boom began to deflate.  As a percent of those working, this is the third time since WW2 that new claims have reached these very low levels.  The last two times did not turn out well for the economy or the stock market.

**********************

Oil

Going back through some old notes.  Here’s an October 2009 article where Deutsche Bank estimates the price of oil at $175 in 2016.  2009 was just about the time that newer techniques in horizontal drilling were being developed.  The fracking boom was just about to get underway.  Whether you are an investor or a second baseman, the future is tough to figure out so stay balanced, stay prepared and keep your knees bent.