Growth Periods

July 28, 2019

by Steve Stofka

Did you know that housing costs double every twenty years? The predictability surprised me. Both rents and home prices double. Based on the last forty years of data the average annual increase is about 3-1/2% (Note #1).

House prices can only get ahead of earnings for so long before a correction occurs. Take a look at the chart below. Yes, low interest rates reduce mortgage payments so people can afford more home. That’s what we said in the 2000s. This trend does not look sustainable to me.

I was doing some work on potential GDP and wondered which president since World War 2 has enjoyed the longest and strongest run of real (inflation-adjusted) GDP above potential. Potential GDP is estimated as a nation’s output at full employment.

I won’t start with the #1 award because that would be no fun. Nixon came in fourth place with a run of strong economic growth from 1971 – 1973. The oil embargo that followed the Arab-Israeli War of 1973 sent this country into a hard tailspin that ended that growth spurt.

Ronald Reagan comes in third with a cumulative total of 24.5% growth above potential GDP. The expansion began in the third quarter of 1983 and ran through the second quarter of 1986. These strong growth periods seem to last two to three years.

Second place goes to President Truman with a short (less than two years), sharp 25.2% gain that ended with the beginning of the Korean War.

And the award goes to…the envelope please…Jimmy Carter. Wha!!? Yep, Jimmy Carter. The growth streak began in 1976, the year Carter was elected, and ended in 1979 when Iran overthrew their Shah, oil production sank, and oil prices doubled. At its end, the expansion had totaled 25.5% above potential GDP. In less than two years, the nation soured on Carter and put Reagan in office.

What about other Presidential administrations? We might remember the late 1990s as a heady time of skyrocketing stock prices during the second Clinton administration. The output above potential was only 11.5% but is the longest period of strong growth, lasting almost four years, from the first quarter of 1996 through the last quarter of 1999.

George Bush’s growth streak was only slightly higher at 12.8% but is the second longest growth period, beginning in the third quarter of 2003 and ending in the last quarter of 2006. A year later began the Great Recession that lasted more than 1-1/2 years.

Barack Obama’s presidency began with the nation deep in a financial crisis. By the time he took office fourteen months after the recession began, the economy had shed 5 million jobs, 3.6% of the employed. Employment was more than 6 million jobs below trend. The economy did not start growing above potential until the first quarter of 2010. The growth period ended in the third quarter of 2012, but employment did not regain its 2007 pre-recession level until May of 2014, 6-1/2 years after the recession began. It is the weakest strong growth period of the post-WW2 economy.

President Trump’s streak of strong growth began in the last few months of Obama’s term and is still ongoing with a cumulative gain of 7.5%. Unlike other growth periods, this one is marked by steadily accelerating growth above potential.

I’ve charted the cumulative growth above potential and the period length for each president.
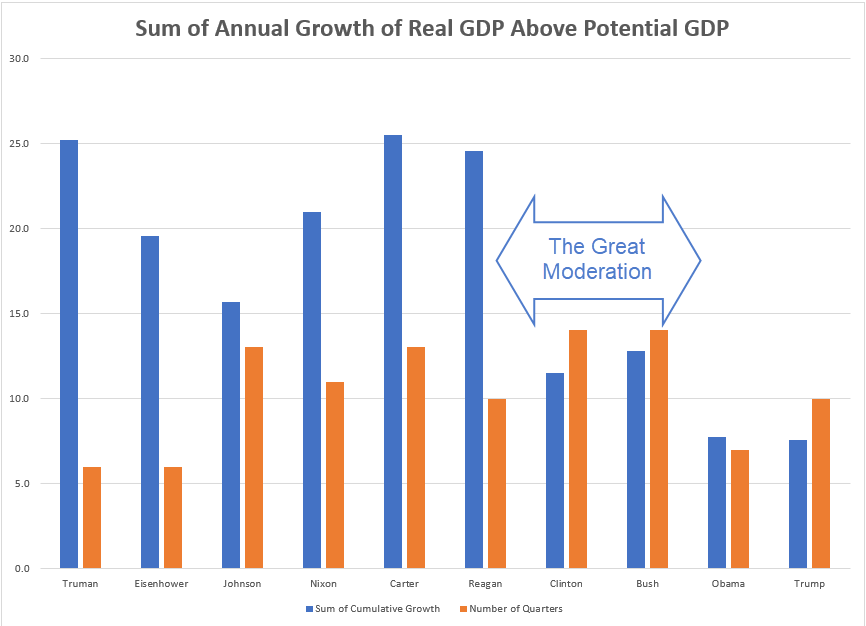
As the economy shifted away from manufacturing in the 1980s, the days of 20-plus percent growth ended. Manufacturing is more cyclic than the whole economy. The manufacturing sector contributes to strong growth in recovery and pronounced weakness at the end of the business cycle each decade. In the 1980s, economists and policy makers in both government and the Federal Reserve welcomed this shift away from manufacturing. They dubbed it the Great Moderation and it ended twenty years later with the Great Recession.

President Trump is on a mission to begin another “Great” period – the resurgence of manufacturing in America. It is a monumental task because manufacturing depends on a supply chain that is presently located in Asia. In 2013, Apple tried to manufacture and assemble its high-end computer, the Mac Pro, in Texas. Production faltered on the availability of a tiny screw (Note #2). Six years later, the Trump administration is levying 25% tariffs on Apple products to encourage them to manufacture computers again in Texas.

The widespread use of tariffs usually leads to fewer imports. As other countries retaliate, exports decrease. Slowing global growth poses additional challenges to repatriating manufacturing to this country. If Trump can realize his passion, we may again return to those days of heady growth and more severe business cycle corrections.

////////////////////

Notes:

  1. The Case-Shiller home price index (HPI) for home prices. The Consumer Price Index’s rent of a primary residence.
  2. A NY Times account of Apple’s last attempt to manufacture in the U.S.A.

View From The Top

July 21, 2019

by Steve Stofka

Several Democratic Presidential contenders have painted a target on the top 1%, claiming that they have not paid their fair share of taxes. After the 1986 Tax Reform Act, those in the top 1% paid 26% of their income in taxes. Thirty years later and they paid the same percentage, even though their incomes had grown 50% in real dollars, according to an analysis of IRS data from 2016 returns (Note #1).

Other high-income brackets have experienced modest income gains and small increases in their average tax rates. In 1987, the top 10% of incomes paid 20%. In 2016, they paid 21%.

The average tax rates of the top 25% of incomes has increased from 16.5% to 18.5% in thirty years. As a group, the effective tax rate of the top half of incomes has increased from 14.6% of income in 1987 to 15.6% in 2016. While the top half has gone up a percent or two in the past three decades, the bottom half of incomes have paid a decreasing share of their income – falling from 5% to 3.7%.

The lesson? Changes in tax rates occur very slowly. A candidate who promises big changes quickly is facing formidable odds.

How much income does it take to get into the top half of incomes? Only $40K (Note #2). I was surprised how low the amount was and it hasn’t changed much in the past thirty years. In 1987, the income threshold to be in the top half of incomes was $17,768 – $38,500 in inflation adjusted dollars.

Want to be part of the upper class? All it took in 2016 was $81K, 9% more than it did in 1987, to be a part of the top 25%. How many workers making modestly good incomes in Los Angeles, San Francisco, New York City or Boston feel like they are upper class? After tax income is about $56K and rent in a middle-class neighborhood of L.A. can be 45% of that disposable income. That’s two paychecks toward rent. One paycheck for bills. One paycheck for food and miscellaneous. Ooops, just ran out of paychecks, didn’t you? Welcome to the upper class.

The threshold to get into the top 1% has increased a lot – from $302K to $480K in real dollars – a jump of more than 50%. Those are the people who are still paying the same percentage of their income in taxes. Their share of the total income pie has risen from 12% to 20% in thirty years (Note #3).

In the past thirty years, incomes have stretched upward by 50% for those at the tippy top. As a group their share of income taxes paid has kept pace with income growth, increasing from 24% to 37% of total personal income taxes collected (Note #4). The top 1% can say, “Yes, we are doing better, and we are paying proportionately more.” Can one of the Presidential contenders convince the Congress to get more out of that top 1%?

///////////////////

Notes:

  1. At the top of the analysis is a link to the Tax Foundation’s summary tables. Table 8 of that summary shows effective tax rates of the various income brackets. Here’s a link to the summary tables themselves.
  2. Table 7 from the summary tables.
  3. Table 5.
  4. Table 6.

The Politics of Compassion

July 14, 2019

by Steve Stofka

It was a busy week in Washington. Jerome Powell, the chair of the Federal Reserve, testified before a House subcommittee. His dovish remarks signaled Wall Street traders that the Fed would almost certainly lower interest rates at their next meeting on July 30-31 (Note #1). The market rallied to new highs even as investors continued to transfer funds from stocks to bonds during the past month (Note #2).

Not so dovish was the atmosphere at a House subcommittee hearing this week on immigration proceedings at the southern border. Very emotional testimony from several freshman House members who had visited immigrant detention facilities in Texas. The former head of ICE under Presidents Obama and Trump testified about the challenges that border patrol officers face under the surge of immigrants. Human and drug trafficking along the southern border has been at crisis levels for many months. Patrol officers are not trained to be social workers or medical attendants but find that most of their time is spent caring for people who lack the physical stamina necessary to navigate the harsh conditions of the deserts of northern Mexico.

Many immigrants are sick or injured after a long treacherous journey from Central America. The crowded facilities pose a challenge even for healthy immigrants. They are certainly no place for mothers with young children, but neither was Ellis Island (Note #3). However, most of the immigrants at Ellis left the building after several hours (Note #4).

I was reminded of my grandmother and aunt who were turned away twice for whooping cough and pink eye. It was easy to pick up contagious diseases on the 7-10 day journey in third-class quarters on a crowded transatlantic steamer a century ago. Processing hundreds of immigrants a day, doctors at Ellis Island were quick to reject those with even the hint of TB or trachoma (Note #5). In the years before World War I the northern states needed workers and government officials were largely forgiving of many disabilities and illnesses. Less than 2% of immigrants were deported. My family was one of the unlucky ones – twice. My grandfather waiting on the Manhattan shore a few miles away must have been confused and angry.

Some Americans are insistent that immigrants should follow our Constitution, but our founding document has little to say about immigration. Article 1, Section 8 states that the Congress shall “establish a uniform rule of naturalization.” End of story. For the first hundred years of our nation’s existence, each state processed immigrants. Many immigrants did not present any paperwork or pass a medical examination. State and Federal governments simply took an immigrant’s word as to their name and personal information. Those who insist most loudly that immigrants follow our laws may be descended from people who followed no laws when they immigrated into our country.

In 1891, Republican President William Henry Harrison signed into law the Immigration Act of 1891 passed by a Congress dominated by Republicans (Note #6). Republicans represented the interests of northern businesses who needed able bodied workers who were unlikely to become dependent on government for their care. The flood of immigrants into the northern states gave Republicans additional congressional seats and an edge over Democratic majorities in the southern states.

The founding documents of this country were forged in the fires of heated debate and hard bargaining (Note #7). In 230 years, the debate has not cooled. Today, Democratic majority states like California and New York stand to gain Congressional seats as they welcome and champion the rights of immigrants. While the Senate has a filibuster rule, only the Democratic Party can fix our broken immigration laws because they are the only ones capable of securing a filibuster-proof majority in the Senate. The Republican Party has not enjoyed such a majority since Senators were first popularly elected in 1914. If Republicans are ever going to take the lead on contentious issues, they will have to abandon the Parliamentary filibuster that chokes most legislation to death in the Senate.

Why didn’t the Democratic Party address the issue of immigration while they had a filibuster-proof majority in the Senate and controlled the Presidency and House? Was it not important then? Nancy Pelosi was House Speaker then and now. She is known for her political ability to “count votes.” Perhaps she would be more effective if she looked further than votes. In a deeply divided nation with a constitutional architecture that resists change, a resolution of our most intractable problems is a formidable challenge for any leader.

After the Financial Crisis in 2008, Pelosi helped patch together two large pieces of legislation under Obama’s first term. ARRA was an $800B stimulus package passed in February 2009 that did help keep unemployment from getting even worse but was ineffective in many areas because the stimulus was diluted over several years (Note #8). That and the passage of the controversial ACA, dubbed “Obamacare,” cost the Democrats dearly in the 2010 midterm elections. Obamacare has withstood both legislative and judicial assault but may fall sometime this year to yet another judicial challenge that was just heard by the 5th Circuit Court of Appeals. That’s a topic for next week’s blog.

///////////////////

Notes:

  1. Schedule of Fed meetings
  2. ICI flow of funds
  3. Crowded main hall at Ellis Island
  4. Relatively short processing time at Ellis Island
  5. Medical examinations of immigrants at Ellis Island
  6. Immigration Act of 1891
  7. Michael J. Klarman’s “The Framer’s Coup” is a thorough account of the construction of our nation’s Constitution. The audio book
  8. ARRA – the American Recovery and Reinvestment Act of 2009

Working Class Blues

July 7, 2019

by Steve Stofka

This week I had a chance to watch two documentaries hosted by journalist Bill Moyers several years ago (Note #1). They featured the shifting fortunes of two blue-collar working-class families in Milwaukee. Each family had enjoyed the security and benefits of middle-class life – a house and dreams that they would send their kids to college one day. When each breadwinner lost their jobs in the manufacturing industry, they realized just how precarious their situation was.

With more education and skills, these blue-collar workers could have made a better transition. Higher education is certainly a solution for some but how will more education help the butcher, the baker and the candlestick maker? These professions play a part in our complex society and the marketplace has not found a viable solution for those workers and their families.

What is the middle class? The Census Bureau defines it as the middle three quintiles of income (Note #2). What does that mean? If incomes range from $0 to $100 the range of the middle class is from $20 to $80. Some economists use $25 and $75 as the upper and lower bounds of the middle class. A hundred years ago the middle class was a small sliver of the population in the middle. They were between the working class who relied almost entirely, if not exclusively, on work for their income, and the upper class whose major source of income was not work – profits, interest, dividends and rents.

When economists talk about the middle class, it is usually the lower middle-class or working class that they use to represent the fortunes of a wide range of people with far different circumstances, education and skills. Both videos focused on that working-class segment because the stories are poignant and the solutions difficult, if not intractable.

The Golden Age of the working class was after World War II when unions were strong and blue-collar incomes grew much faster than inflation. After the productive capacity of much of developed world had been destroyed during World War II, America was the factory for the world. The workers in those factories enjoyed strong bargaining power and could command a good benefit package and wage gains from employers.

Until the Roosevelt administration established housing and mortgage programs during the decade of the Great Depression, most families had to put a third to a half down on a house and pay off the mortgage in five to ten years. The FHA (1934) and FNMA (1938) lowered those requirements to as low as 10% (Note #3). The GI bill that was passed in 1944 promised returning GIs a home for little to nothing down and low-interest long-term mortgages.  Residential construction boomed.

As the European nations and Japan recovered in the 1960s and 70s American firms were challenged by low cost imported goods. As their pricing power eroded, they became more resistant to wage and benefit demands by working-class unions. Protectionist policies guarded against competition from foreign auto makers, but consumer buying power in America was a magnet for appliances and electronics from Japan and Germany, and foodstuffs from France, Spain, Italy and Mexico (Note #4).

The 1970s was beset by a series of bitter strikes in both private industry and in government service. The benefit and wage packages that union workers had negotiated in the 50s and 60s proved uncompetitive in the revived private international marketplace. Those who could afford the higher taxes to pay city workers began to move out of the cities to the suburbs. Cities like New York suffered under successive waves of strikes by fire, police, sanitation and transportation workers. If the firefighters got a 4% raise, other city workers wanted a similar wage package.

Rather than invest in refurbishing decades-old factories, manufacturers built new factories abroad, where labor costs were much cheaper. The savings more than offset the shipping costs of finished products back to America. Those shipping costs had been drastically reduced in 1955 when a transport owner and an engineer designed a shipping container that could be stacked and survive the rigors of an ocean voyage. They gave away the patent and the world adopted the new containers (Note #5).

As the manufacturing plants in the northern states, particularly the Rust Belt, began to shutter their doors, some families moved. Many families who had bought homes now found that the value of their homes had depreciated. Some with strong ties to the community and a lack of savings struggled on at lower paying jobs. Some lost their houses, their cars, their dreams. The two families that Bill Moyers interviewed exemplified this broad trend. 

For some journalists and economists, this short-lived post-War era became a benchmark for the way it should be. That benchmark may have been a historical anomaly, an aftermath of a global war.

What is to be done? Since the Johnson Administration ushered in the War on Poverty fifty years ago, the percentage of the population in poverty has not changed (Note #2). 42% of children born into poverty remain in poverty. Either the programs have been poorly designed, or the problems are complex and resist solutions.

Will raising taxes on the rich help? Most of the capital gains go to the upper class who pay lower taxes on those gains. Is that the solution? To fund their retirement, millions of seniors each year are selling some of their IRAs and 401Ks, and incurring capital gains when they do so. Will politicians change the rules in midstream on a generation of Boomers? Old people vote in high percentages. Probably not.

Some suggest that the government stop subsidizing rich people and give that money to people who need it. This would include means testing Social Security, but also include a plethora of “gimmes” that pass unnoticed to most of us from government to those who are well-off. Some farmers receive a check from the government to not grow crops in order to control the supply. “Dear Santa, do not give me money this year.” Who is going to write that note?

Some have suggested we implement a Universal Basic Income (UBI) program, a program which would give $1000, for example, to everyone. That would be a nice subsidy for Walmart and McDonald’s who could then pay their workers even less than they do now. Some economists argue that there are even more problems (Note #6).

What about a higher Federal minimum wage? $15 is a popular suggestion on the campaign trail. A $15 wage in Los Angeles has much less buying power than it does in Alamosa, CO. Why not implement something indexed to the median wage in each area? The BLS, the same agency that produces the employment report each month, has the data to implement such an idea. Why a one size fits all minimum wage? Those who prefer local solutions are not without compassion.

History tells us that large government solutions can exacerbate the very problems they were meant to solve. The housing assistance and student loan programs are examples of the bureaucratic bramble that characterizes active Federal programs. Given that caveat, I do think that a Job Guarantee program that operated at the state and local level but was funded by the Federal government would provide stability to the more vulnerable in our work force. It would reduce the cyclical and structural unemployment that corrodes our society (Note #7). There are several proposals to implement some trial programs in the states and I support those efforts. What do you think?

//////////////////////////

Notes:

  1. Frontline’s Two American Families and Moyers & Co. Surviving the New American Economy
  2. A 2018 Census Bureau presentation (PPT) of income and poverty in the U.S.
  3. History of Government housing programs
  4. In 1964, the Johnson Administration enacted the “chicken tax,” a 25% import tax on imported autos
  5. History of Shipping Containers and the free of patent innovation that changed international commerce
  6. Economist Daron Acemoglu argues against a UBI program
  7. Search for Job Guarantee and choose the depth that you want to explore on this topic. On Twitter, #JG for many sources.