Our Legacies

April 29, 2018

by Steve Stofka

Each generation bequeaths the benefits and costs of legislative programs to the following generations.  In the past one hundred years, Democrats have secured a dominant majority in the Congress three times. A dominant majority is one where one party controls the Presidency and both houses of Congress with a filibuster proof majority of sixty in the Senate (History of Shifting Political Power).

Each time, the Democrats have created an entitlement program, a legacy structured so that it would be difficult to undo when Democrats were out of power.  Under FDR in the 1930s, the Democrats created Social Security. Like all entitlement programs, coverage and benefits were expanded in the first ten years after creation of the program.

In the 1960s, LBJ and the Democrats created Medicare and Medicaid. Before these programs, the Federal government paid 11 cents of every health care dollar. In 2013, that 11 cents had grown to 26 cents (CMS history PDF).  As with Social Security, coverage and benefits were greatly expanded the first decade after creation. In 1960, the U.S. spent 5.1 cents for every $1 of GDP. OECD countries spent only 3.7 cents. By 2013, Americans spent 16.4 cents of each $1 of GDP, twice as much as the 8.7 cents spent by OECD countries.

For fifty years, the annual growth of health care spending was 50% more than the growth rate of the economy.  With a dominant majority after 45 years, Obama and the Democrats tried to pass single payer health care in 2009. Democratic politicians in conservative leaning districts balked at the idea. Obamacare was a compromise solution that has been compared by opponents and advocates alike to a Frankenstein contraption of legislation that needs to be fixed. Expansion was embedded in the legislation from the start through the Medicaid program.

When the BLS and Census Bureau compute the Consumer Price Index (CPI), a measure of inflation, they consider the shifting patterns of consumer spending. Since 2000, the Medical spending component of the CPI has doubled its share of the index to about 17%. Increased medical spending is affecting most American families. Regardless of one’s opinion of the solution, Obamacare was a compromised attempt to deal with this trend.

The American health care system is like the 50-year old cars in Cuba that have been patched together with duct tape and ingenuity. The system runs on policy payoffs to stakeholder groups and it will fail most of us because it cannot adapt to the extraordinary advancements in medical care. As technological changes accelerate in the coming decades, this cobbled together system born of World War 2 wage and price controls will grow ever more unwieldy.

Entitlement programs invariably cost a lot more than the designers calculate. Program benefits are easier to sell to voters than raising the funds to pay for them. Following December’s tax reform bill, the non-partisan Congressional Budget Office revised their ten year budget and deficit estimates.

For the past fifty years, the Federal government has collected an average of $17.40 for every $100 of GDP.  The CBO projects Fed revenue will be over $18.00. Here’s the problem: the Federal government has been spending $20.30, almost $3 more than it collects. That’s how the country has run up a debt of $20 trillion. It’s about to get worse. Because of increased Medicare and Medicaid spending, the CBO projects spending will increase to $22.40 for every $100 of GDP. A $3 shortage will soon turn to a $4 shortage. The interest on that steadily increasing debt? By 2023, almost $3, a sixth of what the government collects and more than the defense budget.

Nations can not declare bankruptcy.  Instead, they become failed states and descend into anarchy.  Venezuela has become a failed state and its people are fleeing the country.  Most of the institutions have failed.  Most of the daily necessities of life are in short supply. The government claims that it doesn’t even have the paper to print exit Visas.  Under the Maduro government, truth was the first to abandon the country.

The economy is strong yet Chapter 11 bankruptcy filings have reached the same level as April 2011 when there was talk of another recession. That year, the unemployment rate was still above 9% and housing starts remained at all-time lows. Then-President Obama and Republican House Majority Leader John Boehner battled over a budget compromise and the stock market dropped nearly 20%. In a strong economy like today, we should have lower levels of bankruptcy.


Prejudice and Jobs

April 22, 2018

by Steve Stofka

America is built on prejudice and the passionate denial that we are a country built on prejudice.

Investors who understand the role of prejudice in the economics of this society can recognize a few early signs of a coming recession. A strong economy, like a bull stock market, raises all boats, including those at the margins who are easily stranded.  During the financial crisis, they were the first to be discarded.  As the current strength of the economy is finally able to lift the fortunes of the more vulnerable, countervailing forces will undermine that strength.

From the country’s founding, broken and forced land treaties, enforced by superior military power, have sidelined those with red skin.  Like the thoroughbred horses in the upcoming Kentucky Derby, Americans with black or brown skin must carry an extra weight during the race of life. I’ll show one data sign of this weight. White people must bear their own burden: privilege. Centuries of discrimination blocked those with black skin from many housing and job choices to give those with white skin a better chance at success. The prejudice against those with brown skin is less strong but has intensified when Candidate Trump used the issue of illegal immigration to taint those with brown skin or Hispanic surnames, regardless of their citizenship.

America has a shorter history of isolating and persecuting immigrants of white skin. First it was the Irish who immigrated to America after the potato blight devastated Ireland’s staple crop in the mid-19th century. Newspapers and periodicals portrayed the Irish as ignorant, shiftless criminals. In a country dominated by Republicans, many Irish were Catholic and suspected of being more loyal to the pope in Rome than democratically elected leaders in America.

As the century turned, Italians and southern Europeans became the target of American prejudice (History). Like the Irish, many Italians were Catholic and not to be trusted. To this day, no Italian has been elected President. JFK was the first successful Irish Catholic candidate for the Presidency, and he had to overcome objections that he would turn to the Pope for advice on national policy.

As discriminatory as Protestants have been to Catholics, they have been especially unkind to those of other Protestant sects. As more Catholics migrated to America, many Protestants in America deflected their prejudices from other Protestants to the Catholics as easy targets of discrimination.

In America, Jews encountered less discrimination than in Europe but housing, job and social discrimination were prevalent in the first half of the 20th Century. In the 19th Century, those of the Mormon faith were driven out of Ohio, then Missouri, and Illinois by Protestant sects who regarded Mormons as non-Christians. The abandoned farms and businesses were auctioned off to the Christian righteous who remained. Mormons escaped across the Great Plains and the Rocky Mountains to settle in a valley in Utah. Following the Holocaust during World War 2, there was a proposal to settle many European Jews in Utah, but Mormons nixed the idea. Even those who suffer persecution for their religious beliefs are not immune to bias.

From Europe, Protestant settlers brought their prejudices with them. Those Protestants who immigrated to America because of religious persecution were often fleeing long standing animosities with other Protestant sects. Eight of the thirteen colonies established churches of a particular denomination and only those citizens belonging to that denomination were allowed to hold office. Each Protestant sect was convinced that the other sects had strayed from the message and meaning of the Bible. To counter such discrimination, Virginia adopted an amendment to protect religious freedom even before the founding of the United States. Mindful of these bedrock prejudices, the Founding Fathers based the language of the First Amendment on the laws of several states protecting religious freedom.

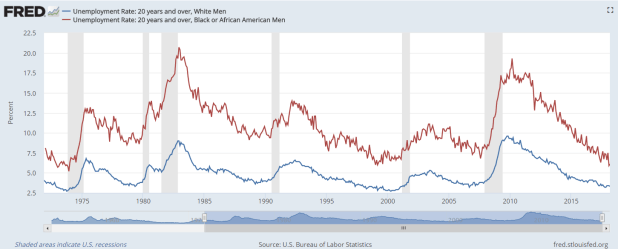
Jobs and their compensation reflect the value that a society places on an individual’s labor. The graph below is a sign of prejudice in America. The unemployment rate for blacks is always higher than the rate for whites. If this were a chart from the year 1890, the persistently higher unemployment rate could be labeled Irish or Italian.  A disadvantaged class of worker is more willing to do unpleasant jobs for less money.
UnemployBlackWhite

Under Obama, the unemployment rate for black men dropped from 18% in the spring of 2010 to 7.7% in November 2016. Since Trump’s election to the Presidency in November 2016, that rate has fallen another 20%. At 6.1% this rate is the lowest since the early 1970s. There are black grandfathers who thought they might die before seeing a younger generation enjoying an unemployment rate this low.

Still, the current rate for black men is 2.8% higher than the 3.3% rate for white men. Over the past forty years, the average difference between the two unemployment rates is close to 6%. This is the burden of being black in America. In the past half century, there have been few times when the difference in rates is this low: 1) during the Vietnam War when many black and white men were removed from the labor force; 2) 1999, near the height of the dot-com boom; and 3) several months this past year.

UnemplRatesDiff

It’s not just skin color, religion and nationality that drives prejudice in America. Five years after the end of the Civil War in 1865, the 15th Amendment gave black males the right to vote. Women suffragettes lobbied hard to be included in the Amendment and win their right to vote. Susan B. Anthony and Elizabeth Cady Stanton were prominent leaders of this movement. The idea was just too crazy, they were told. Women were too guided by their emotions, and too irrational, particularly during their menses, to be trusted with the vote.

In 1920, exactly fifty years later, the ratification of the 19th Amendment gave women the right to vote. The Suffragette movement had allied with the Prohibition movement to press each of their causes in a joint effort. The Volstead Act, the implementation of the 18th Amendment prohibiting the sale of intoxicating liquor, was passed a few months before the ratification of the 19th Amendment. They were a package. Had women been granted the right to vote in 1870, the Prohibition movement would have lacked a critical partner to win passage of the Amendment. Without Prohibition, the rise of organized crime might not have occurred.

Whenever there is a war, or any act of aggression with another country, Americans single out those nationalities or races for discrimination. In the 19th Century, those of Mexican descent were vilified after the Mexican-American War.

Many Germans were denied jobs and housing following the start of WW1. Historical prejudices were resurrected. German soldiers, known as Hessians, had fought with the British against American colonists in the War for Independence. Americans began to see that there was something wrong with the German character. Political cartoons pictured Germans as Huns, a mongrel and violent race of uncivilized people always lusting for battle.

Following Japan’s 1941 attack on Pearl Harbor, U.S. citizens of Japanese descent were forced to sell their homes and businesses at below market value, then were moved to internment camps away from the west coast.

The most recent assault on U.S. territory was the 9-11 attack by multiple suicide squads. Most hijackers were from Saudi Arabia, but we did not single out Saudi nationals in the U.S. Unlike the targets of previous war discrimination, Saudis have no unique language. Instead we singled out all Muslims, and all Arab speakers as potential threats.

Prejudice based on sex, on religion, on skin color, and on nationality have formed our country. America is built on prejudice and the passionate denial that we are a country built on prejudice. We can’t do the work of healing until we admit the reality.

Low unemployment rates among minority groups means that the economy is especially strong. Low levels of unemployment for black, brown and white men usually precede a recession. For white men, the benchmark is 4%. For black men, it’s 7%. For Hispanic men, 5%. Below those benchmarks, the Fed has coincidentally seen what they consider to be inflationary pressures.

In a strong economy with low unemployment, confidence and spending increase. This puts some upward pressure on prices. Central bankers jump at the slightest hint of rising prices. Inflation and employment models like the Phillips curve are imperfect. Despite mountains of surveys, equations and data, inflation is difficult to measure, and many factors influence its rise and fall.  Building a model is made more difficult because each high inflation period has had its own unique features. Among economists, fears of an awakening of the inflation beast has persisted since the recovery in 2009.  Economists had begun to worry why the beast has not awoken.  The models said the beast should be awake! Finally, the Fed is seeing some consistent signs that inflation is growing toward their 2% mark. It has begun to lift interest rates to curb inflationary pressures.

I’ve added the Federal Funds rate to a chart of the unemployment rate for white men to show the pattern. I’ve left off the series for black males that I showed earlier so that the chart was not too cluttered.

UnemplVsFedFundsRate

Economists joke that it’s the Fed’s job to remove the punch bowl just when the party is getting going. Want to know what’s ailing the stock market lately? One of them is the greater likelihood of four rate hikes by the Fed this year. At the start of the year, investors put the chances of four rate hikes at 15%. This week it stands at 45%.

To those on the edges of our society and labor force, and to those just entering the job market, the easier job market that others have enjoyed for several years is just opening to them. If there has been a party, they have been left out. As their prospects brighten, the Fed’s raising of interest rates is a cruel joke.

As interest rates go higher, fewer people can afford to buy homes, cars and furniture. Many companies run on borrowed money to meet short term funding needs and long-term investment. As money becomes more expensive, companies tighten their belts and hiring slows. The most vulnerable are the recently hired and they are often the first to be let go. Like marine life that lives in the tidepools at the ocean’s edge, some are left high and dry when the tide of easy money ebbs.


Personal Debt

April 15, 2018

by Steve Stofka

Until the financial crisis, I thought that other people’s debt was their problem. In 2008, debt became a nation’s problem and a national conversation with two aspects – the moral and the practical. Moral conversations are not confined to church; they drive our politics and policy. Many laws contain some language to contain moral hazard, which is the danger that language loopholes in a law or policy promote the opposite of the intended effect of the law. This is particularly true of many entitlement policies. Let’s leave the moral conversation for another day and turn to the practical aspects of current policy.

Bankers learned their lesson during the financial crisis, didn’t they? Maybe not. A decade of absurdly low interest rates has starved those who depend on the income earned by owning debt. Even a savings account is money loaned to a bank, a debt that the bank must pay to the account holder. In their hunger for income, investors have turned to less prudent debt products. So long as the economy remains strong, no worries.

A fifth of conventional mortgages are going to people whose total debt load, including the mortgage, is more than 45% of their pre-tax income. By comparison, at the market’s exuberant peak in late 2007, 35% of conventional mortgages were going to such households, who were especially vulnerable when monthly job gains turned negative in early 2008.

The real estate analytics firm Core Logic also reports that Fannie Mae has started backing mortgages to those with total debt loads up to 50%. FICA, federal, state and local income taxes can amount to 25% of a paycheck (Princeton Study). Add in 45% of that gross pay for mortgage and debt payments, and there is only 30% left for food, gas, home repairs and utilities, child care, etc.

I’ll convert these percentages to dollars to illustrate the point. A couple grossing $80,000 might have a take home pay of $60,000. The couple has $36,000 in mortgage and other debt payments (45% of $80,000). They have $24,000, or $2000 a month for everything else. This couple is vulnerable to a change in their circumstances: a layoff or a cut back in hours, some unexpected expense or injury.

For those who get a conventional loan despite their heavy debt load, where is the money coming from? Banks suffered huge losses during the financial crisis. The Federal Reserve tightened capital requirements for banks’ loan portfolios, forcing them to improve the overall quality of their debt. As a result, banks turned away from their most lucrative customers – subprime borrowers and those with heavy debt loads who must pay higher interest on their loans. Profits in the financial industry fell dramatically. A broad composite of financial stocks (XLF) has still not regained the price levels of 2007.

The banking industry employs some very smart people. What solution did they create? The big banks now loan money to non-financial companies who loan the money to subprime borrowers. After bundling the consumer loans into securities, the non-financial companies use the proceeds to pay the big banks back. In seven years this kind of borrowing has expanded seven times to $350 billion. Doesn’t this look like the kind of behavior that almost took down the financial system in 2008? The banks say that this system isolates them from exposure to subprime borrowers. If large scale job losses cause a lot of loan defaults, it is the investors who will bear the pain, not the banks. Same song, different lyrics.

The 2008 financial crisis is best summed up with a chart from the Federal Reserve. In the post WW2 economy, the weekly earnings of British workers rose steadily. The growth is especially strong when compared to the earlier decades of the 19th and 20th centuries. In 2008, earnings peaked.
WeeklyEarnUK

Developed countries depend on the steady growth of tax receipts generated by weekly earnings. An assumption of 3% real GDP growth underlies the health and continuation of post-war social welfare policies. For more than a decade, the U.S. and U.K. have had less than 2% GDP growth.  Both governments have had to borrow heavily to fund their social support programs.  How long can they increase their debt at such a rapid pace?

I am reminded of a time more than 40 years ago when New York City held a regularly scheduled auction to sell  bonds to fund their already swollen debt load.  None of the banks showed up to bid for the bonds.  The city is the financial center of the world.  The lack of interest stunned city officials.  To avoid a messy bankruptcy, the city turned to the Federal government for a loan (NY Times).

The Federal government is not a city or state, of course. It has extraordinary legal and monetary power, and its bonds are a safe haven around the world.  But there could come a time when investors demand higher interest for those bonds and the rising annual interest on the debt squeezes spending on other domestic programs.

Debt causes stress.  Stress causes anxiety.  Anxiety weakens confidence in the future and causes investment to shrink. Falling investment leads to slower job growth. That causes profits and weekly earnings to fall which reduces tax receipts to the government.  That increases debt further, and the cycle continues.  Other people’s debt is everyone’s problem after all.

Trade Wind Turbulence

April 8, 2018

Remember the clip of Jack Nicholson In the 1980 movie The Shining? Jack hacks his way through a door with an axe, then presses his face to the jagged hole and announces, “It’s Johnny!” Substitute “Trade Wars” and we get a dramatic portrayal of the stock market this past week. On several days, the Dow swung 700+ points, or more than 2%, in response to fears of a tariff feud between the U.S. and China.

The share of global commodities that China consumes far exceeds its share of the world’s population (1/5) or the global economy (1/6). Here’s a chart from Visual Capitalist.

On Thursday, the market opened almost 2% down in response to comments from the chief Tweety Bird in the White House. Later that morning, Larry Kudlow, Trump’s new NEC Director, did a quite effective job of easing market jitters. Kudlow has been a host of CNBC and his own radio program for many years and is savvy to shifting sentiments. No, he said, Trump is a free trader in disguise. This is just a bargaining tactic. The market started the day 500 points down and finished up 240 points.

This is a trader’s market. Much of the price action is taking place in the last hour of the trading day. Each price recovery since mid-March has failed, so the overall sentiment is negative and Friday’s trading was near the 200-day average. For an investor who has not yet made their 2017 IRA contribution, buying now is somewhat equivalent to dollar cost averaging over the past nine months. For those with shorter time horizons, cash looks good till the market finds its head.

The Labor Report for March showed job gains of just 103,000. This was below the 175,000 anticipated gains and far below ADP’s 240,000 estimate of job gains. Mid-March weather on the east coast may have had a negative effect on this month’s survey. The average of the BLS and ADP surveys is 172K, and I find that average to be a more accurate long-term estimate.

The BLS recently released a report on unemployment rates and weekly earnings classified by degree. This chart is a dramatic picture of the advantages of higher education.

UnemplEarnByDegreeBLS
VividMaps released a map showing the income needed to buy an average home in each state. Because the data uses average house prices, the map overstates the affordability problem for many families but does reveal the underlying trend. Why do I say overstates? The average home price is far above the median price because extremely expensive homes raise the average.

First quarter earnings to be released in the next two weeks are expected to show strong annual growth. Will the confirmation of rosy expectations overcome the darker fears of a global trade war? Stay tuned.

Work

April 1, 2018

by Steve Stofka

This week I’ll look at several aspects of work, from cryptocurrencies like Bitcoin, to the minimum wage.

What is work? In general science or physics, the subject of “work” pictured a horse hitched to a pulley lifting a weight (an example). In one minute, the horse could lift so many pounds a foot in the air and that equaled so much horsepower. Thus we could reduce our definition of work to three components: weight, distance and time.

Even this mechanical definition of work illustrates a problem. If the horse lifted the weight, then let it down again, how would we know that the horse did any work? Should we give the horse a few cups of oats, or have we got a lazy horse?

A variation on that problem – I cut my lawn. My neighbor looks at my lawn and sees that work was done. In a week or two the grass has grown and time has erased any sign that I did work.

Thus, we need a way of recording work done. The product of the work performed may serve as a record. A big pyramid sitting on a desert is a permanent record that work was done. If workers dig holes in the ground, then fill the holes, how do we know any work was done? If they have dug up gold from those holes.

Bitcoin and other cryptocurrencies (crypto) are assets like gold. They recognize that some work was done. Equipment, technology and workers were needed to dig up gold. Likewise, electricity was an important resource needed to generate a bitcoin, and even more electricity will be needed to generate a replacement bitcoin if one were lost.

This Politico article is an account of a crypto mining boom in a rural area in Washington state. The electricity consumed is enormous. The mighty Columbia River nearby provides electricity at a fifth of the average cost in the country. By the end of this year, there will be enough electrical capacity in this small area to power the equivalent of a tenth of the homes in Los Angeles. Shipping containers house computer servers which generate so much heat that the exhausted air melts the snow around the containers. As gold records the digging of dirt, a bitcoin records the expenditure of some quantity of electricity.

Assets can represent past work, future work, or a combination of the two. Precious metals, jewels, books and artistic works represent work done in the past. On the other hand, a machine represents future work. Other assets include stocks and bonds, both of which are claims on future work. A bond is a fixed limit claim on a company’s assets. In contrast, a share of stock is an undying claim on a portion of a company’s assets.

The blockchain algorithm behind crypto requires agreement among many parties to confirm a property right to the crypto. The recording of property rights might seem rather ordinary to a reader in the U.S. In some countries, however, property deeds are more easily altered by those in power. In contrast, a blockchain system of recording property rights prevents forgery and alteration.

As a record of work done, money relies on a relatively stable value. High inflation damages the money record of work done. Consequently, high inflation can fracture the social bonds among people. As an example, I cut someone’s lawn on Saturday and am paid. When I spend the money on Sunday, it is worth half the amount. In effect, the money has only recorded that I cut half a lawn. Examples of this hyper-inflation are Zimbabwe in the 2000s, and Yugoslavia in the 1990s (Wikipedia article). Look no further than Venezuela for a current example of the destruction that inflationary policies can have on a society.

Let’s turn from the recording of work done to the doing of it. New unemployment claims are at a 45 year low. A decade ago, job seekers despaired. In contrast, employees today are confident they will quickly find new employment. To illustrate, the quit rate is at the same pace as the mid-2000s, at the height of the housing boom. As a percent of the labor force, new unemployment claims are the lowest ever recorded. Last week’s numbers broke the record set in April 2000 at the height of the dot-com boom.

Equally important to the strength of a job market is the fate of marginal workers who are most vulnerable to the shifting tides of the economy. This includes disabled people who want to work. During the recession, the unemployment rate for disabled men of working age reached almost 20%. Today it is half that.

Let’s turn to another disadvantaged sector of the job market – those who work for minimum wage. The 1930s depression put many employers at an advantage in the job market. The Fair Labor Standards Act of 1938 (FLSA) enacted a wage floor, but many workers were not subject to the new law. In 1955, almost twenty years after passage of the law, “retail workers, service workers, agricultural workers, and construction workers were still not required to be paid at least the minimum wage” (article).

The minimum wage affects many lower paid workers who are making more than minimum wage. In some union jobs, starting wages for helpers are set by contract at a percentage above minimum wage. The understanding may be non-written in some cases. In 1966, the rate was increased from $1.25 per hour to $1.60 per hour. Non-union clerks at a NYC hospital who had been making $1.70 per hour now complained that they were making minimum wage. As a result of their pressure on management, they got a raise within a few months.

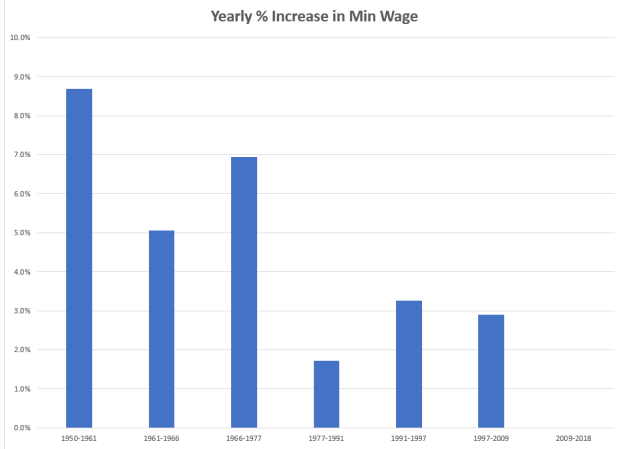
Here’s a chart showing the annual increases in the minimum wage for each period since 1950.

MinWagePctInc

In the three decades after World War 2, annual increases in the minimum wage exceeded inflation. Since 1977, the minimum wage standard has not kept pace with inflation.

MinWageLessCPI

If Congress truly represented all of their constituents, they would make the minimum wage adjust automatically with inflation. On the contrary, Congress represents only a small portion of their constituents, and the minimum wage is used as a political football.

Finally, there is the destruction of the record of past work by war. Every minute of every day, living requires calories, another measure of work. Therefore, each of us is a record of work done.  War destroys too many human records, and the unliving records of work like buildings, roads and bridges. Perhaps one day we will fight our battles in video games and stop destroying all those work records.