For those of you who would like a peek into the mortgage paperwork mess that the news media has called “robo-signing”, check out a seven page article in this week’s Bloomberg Business Week. In a well written narrative, three reporters provide both a macro view of the mortgage and foreclosure machinery situation as well as some stories of individuals who have faced the madness.
Month: October 2010
Regulation Riddle
I’ll continue my look at favorite myths of both the left and right. This week it’s the right’s turn.
A familiar myth of conservatives is that over-regulation led to the decline of manufacturing in the U.S. Is this true? While labor and environmental regulations in a well developed country like the U.S. may play some part in the total cost of a manufactured good, they are not the only costs. Below is a chart from the Bureau of Labor Statistics showing a comparison of labor costs in the U.S., China, Mexico and a few other areas.(Click to see larger image in separate tab)
As we can see, Chinese manufacturing companies have a huge advantage in this area. There are few labor regulations and those regulations which are in place are loosely enforced. The U.S. would have to abolish almost all of its labor regulations regarding minimum wage, overtime, Social Security, Unemployment insurance and Workmen’s Compensation and they still would not be competitive with China. Chinese manufacturing plants enjoy a host of other competitive advantages, according to Manufacturing News: many do not have to pay for the land their factories are built on; many companies do not pay income taxes, property taxes or value-added taxes. In rural areas, manufacturing plants pay only enough to compete with the small, if any, compensation that an overworked person can make in subsistence farming. Parts of Mexico enjoy the same advantages. If minimum wage laws were abolished in the U.S., would you take an assembly job for $2.60? If so, then we could stay competitive with Mexico and China.
How much manufacturing have we lost over the past two decades? According to the Small Business Administration (SBA), there were almost 28 million private businesses in the U.S. in 2007. 22 million were what are called non-employer firms, i.e. businesses that report no employees. These would include people who work for themselves as sole proprietors or Subchapter S corporations. In 1988, 6.5% of private employer businesses were classified as manufacturing and they accounted for 22% of private employment. In 2007, only 4.7% of businesses were classified as manufacturing, accounting for 11% of private employment. If we had the same percentage of employment in manufacturing that we did in 1988, we would have approximately 13 million more people employed. The Bureau of Labor Statistics (BLS) reports that the number of unemployed was 14.8 million in September.
There is no magic formula that will enable us to compete in manufacturing and assembly industries which can produce with low cost, marginally educated labor. The edge we have and must maximize over newly industrializing nations must be a more educated workforce, one which can command the higher precision and more complicated manufacturing industries. Improving educational standards is a multi-decade commitment of dollars and community.
So why do conservatives consistently trumpet regulations as the chief cause of the decline of manufacturing jobs in this country? Because it gives them a justification for policies to reduce the existing labor and environmental regulations. Conservatives know that, if they advocated abolishment of many or all of these regulations in order to be competitive, most of the voters would turn away from them in disgust. So they promise that some reasonable reduction in regulations will make a big difference, hoping that the voters will buy the argument on its plausibility without checking the facts.
Picking Our Pockets
As I mentioned in my last post, the CBO presented their analysis of current economic conditions and future projections. The CBO is careful to note that ten year projections should be treated cautiously. While the CBO’s short term forecasts can be fairly accurate, their long term forecasts are sometimes far off the mark.
Below is a graph of the CBO’s assumptions in making their forecast for 2020. (Click to enlarge in separate tab)
Individual income taxes as a percent of total Federal revenues has never risen above 50% in the past forty years. The CBO is therefore projecting historically high income taxes during the next decade. But more disturbing in their 2020 projections is that corporate income taxes are relatively low. The chart below shows the historical percentages that individual and corporate income taxes have been as a percentage of total revenue.
Over the past 40 years, individual income taxes have averaged 46% of federal revenues. Corporate income taxes have averaged 12%. Why is the CBO projecting such a shift of the tax burden from corporations to individuals in the next decade?
Lien On Me
Jerry sent me a link to a story of legal cruelty documented by the Huffington Post Investigative Fund. Large banks, including JP Morgan Chase and Bank of America, are buying up blocks of tax liens for delinquent property taxes, adding on exorbitant legal and interest fees, which they collect when the homeowner is forced to sell. In one example, JPMorgan collected $12,000+ for a delinquency of less than $1000 on a $67,000 house.
What can we do? Some cities have passed laws that prevent the sale of tax liens which are less than a minimum – a $1000, for example. Check with your city or county to see if it has such a law. If not, write your reps to get such a law passed.
I’m too sickened to comment further.
Unemployment Rollercoaster
At the end of September, the Congressional Budget Office (CBO) appeared before the Senate Budget Committee and presented their outlook on the economy, the deficit, and unemployment. (Click to enlarge in separate tab)
Source: Congressional Budget Office (Click on Director’s Slide Show)
The recessions of 1980 – 81 and 1982 – 83 were really one long recession. A several month uptick between the two recessions is the only thing that separates them. It took several years before the National Bureau of Economic Research had enough firm data to call it two separate recessions. I will call it a “recessionary period.”
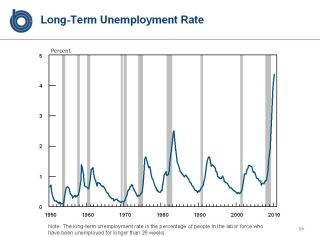
Although this recession officially ended in June 2009, the persistently high unemployment, similar to the levels of 1980 – 1983, makes the present period an equally severe period. But what makes the current malaise truly stand out is the rate of the long term unemployed, as shown in the graph below.
What surprised me is that men consistently suffer much higher levels of unemployment in tough times even though they are only slightly more than half of the workforce. According to the Dept of Labor, women made up 46.8% of the workforce in 2009. This is probably due to the greater number of men workers in the construction field, which generally suffers heavily during recessions.
For many men younger than 50 in the construction trades, these past two years may be the wake up call – that they need to build a more versatile skill set; that they can’t rely on a high school education and a learned trade skill to get them by; and in good times, it is wise to put some of the beer, boat and truck money in a savings account.
Social Security Myths
Previously, I took a closer look at the conservative “myth” that reducing tax rates raises tax revenue. This week I’ll look at a fiction frequently trotted out by those on the left: the rich get off easy on their contributions to Social Security.
A recent example is a Senate hearing (32 minutes into the tape) in which Tom Harkin, the Democratic Senator from Iowa, states that, because of the $106K cap on earnings subject to the Social Security tax, people making $400K paying Social Security tax on 25c out of every dollar while most people in this country pay Social Security tax on every dollar they make. This is true. But what Senator Harkin neglects to mention is that Social Security benefits are also capped.
Let’s look at 3 examples: Joe, making the median annual earnings of $40K; Sally, earning $100K and in the top 5% of earners; and Marilyn, making $150K. Each of them was born in 1950 and will retire at their full retirement age in 2016.
Using the Social Security Administration’s (SSA) benefits calculator , Joe will get a full retirement monthly benefit of $1184 when he retires. Using the default growth rates of income, the SSA estimates Joe’s lifetime income at $848K. Sally will get a monthly benefit of $2100 on estimated lifetime earnings of $2,119K. Sally has contributed 250% more than Joe but will receive less than double the benefit. Marilyn will receive a monthly benefit of $2434 based on a lifetime earnings estimate of $2,623K, triple Joe’s earnings. Because of the social security contributions cap (currently about $106K), Marilyn has not contributed three times what Joe has contributed, but she has still contributed more than 2.5 times what Joe has contributed. However, Marilyn gets only double the benefit that Joe receives.
In short, Social Security is both a safety net and an income redistribution scheme. An American Institute of CPAs (AICPA) report notes that Social Security was originally designed as a prepaid pension plan so that benefits received were dependent on contributions made by each person. That original design was amended a few years later to turn Social Security into a “pay-as-you-go” system where retiree benefits were paid for by the taxes of current workers. Although benefits were indexed to contributions, those who earned less received far more benefits in proportion to their contributions. Social Security thus became a hybrid income redistribution scheme for retirees. You can read a colorful history of pensions at the SSA web site.
Few conservative or liberal politicians readily acknowledge the income redistribution aspect of Social Security. The program has been “sold” to taxpayers as though it was an insurance product, similar to an annuity policy that anyone can buy from an insurance company. The only difference is that the federal government is the insurance company. Regardless of what one feels about the income redistribution part of Social Security, it has reduced “the poverty rate among the elderly from 35% in 1959 to 10% in 2003, the lowest of any adult group.” (Source) A recent report by the Census Bureau shows that poverty rates for seniors are 2/3 to 3/4 that of adults in general. Have we gone a bit too far in helping seniors? Poverty rates for children are at a shocking 20% plus, but few politicans dare to propose reducing benefits for the elderly to help children. Seniors vote. Children don’t. Because seniors have been convinced that Social Security is like an annuity insurance program, many seniors balk at any reduction in benefits. They are convinced that they paid in full measure for the benefits they receive.
As the examples above show, both Marilyn and Sally pay a portion of Joe’s benefits. Yet Joe probably thinks that he has earned every penny of his benefits because he “paid into the system.” This misconception is likely to make changes to Social Security benefits extremely difficult. Those who are well off know that they contribute far more into the system than they receive. Those who are less well off will prefer to “soak the rich” even more rather than give up benefit increases.
For those of you who like wrestling, you may be able to see in coming years the (cue up the loud music) “Social Security Smackdown” on a cable channel.
Government Vacuum
Imagine a world where a quart of milk costs the same in 1950 as it does in 2000. That’s the imaginary world of inflation adjusted or constant dollars, which adjusts current dollars by the Consumer Price Index (CPI). Although imperfect, constant dollars gives us a way to compare apples to apples.
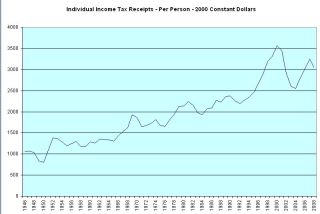
Tax cuts and increases have been a hot topic of political discourse leading up to the elections. In my earlier blog, I showed the income taxes (in inflation adjusted dollars) collected over the past half century. As you may have noticed, those taxes kept rising. With a growing population, it is natural that income taxes collected should continue to rise. What may not be so apparent is the rise in taxes collected PER PERSON.
In the table below (click to enlarge in a separate tab), I divided Office of Managment and Budget (OMB) data on individual income taxes by annual population figures from the U.S. Census Bureau to come up with a per person average of income taxes collected.
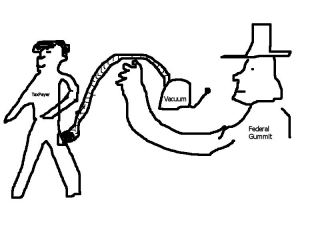
Per person means everyone! The federal government is collecting triple the amount of real money that they collected 60 years ago. If the cost per person of government was about $1000 in 1950 and it is $3000 now, are we getting triple in services from our government? Or are we getting screwed?
Political Economics
As we approach the upcoming elections we hear some favorite myths of both the left and the right. Today I’ll look at a favorite myth that is trotted out by supply side believers on the right.
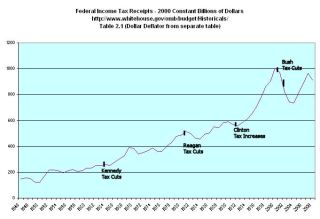
Does lowering income tax rates produce more income tax revenue? Below is a chart of historical income tax data from the Office of Management and Budget (OMB) – click to view larger image in separate tab. After the Kennedy era tax cuts, revenue increased. After the Reagan tax cuts, revenue initially decreased. The Clinton era tax increases clearly show an increase in revenues. The Bush era tax cuts clearly show a decrease in revenues.
Does lowering or raising tax rates produce more revenue? Increases or decreases in revenue may have more to do with the economy or rising asset values (capital gains taxes) than tax rates. Still, some conservatives will continue to insist that lower tax rates produce more revenue. The justification for their assertion is to look at TOTAL federal revenue, including social security taxes, to make their point. This is a sleight of hand argument since Social Security tax revenue is not affected by income tax rates but it is the only way that conservative supply side believers can make their point. They can only hope that their audience doesn’t look too closely at the facts – at least not until after the election.
Recession Procession
Recently, the National Bureau of Economic Research (NBER) made their official pronouncement that the recession that began in Dec. 2007 ended in June 2009. In July 2009, the Federal Reserve had issued its unofficial estimation that the recession had just ended. This latest announcement by the NBER is a statistical confirmation of what the Federal Reserve had announced over a year ago. To many individuals and businesses, however, the recession is not over. In a CNBC interview, the renowned investor and billionaire Warren Buffett stated his more common sense definition that the recession is not over until production and income get back to the levels they were before the recession started. Most would agree.
There is no clear definition of the beginning and end of a recession but the NBER’s Business Cycle Dating Committee states that a recession is “a significant decline in economic activity spreads across the economy and can last from a few months to more than a year.” The rule of thumb is two consecutive quarters of negative GDP growth. But neither the NBER definition or the rule of thumb adequately captures the effect – how it feels – of a downturn in the economy. That is because the rule of thumb is based on quarter to quarter growth or decline in GDP. If GDP were a $1 and, over a year, fell to 80¢, then rose to 85¢ in the following quarter, the economy would still be terrible but the growth in GDP would be an annualized 25%. For this reason, Buffett’s rule of thumb gives a more accurate picture.
Below is a NBER chart of real, or inflation-adjusted GDP, with Dec 2007 being the benchmark of a 100. As you can see, our economy is still below the level of December 2007. (Click to view larger image in a new tab)
The severe downturn in manufacturing and retail sales tells a more complete picture, not only of the national economy, but the state and local economies which depend heavily on sales taxes for their revenue. Total unemployment is about 16% of the workforce and, until that situation improves, there will be only sluggish growth in sales, which in turn will keep on damper on GDP growth.


