
May 19, 2024
by Stephen Stofka
This week’s letter is about our perception of inflation and the uncomfortable feelings we experience at higher-than-expected changes in prices. We notice price changes relative to the goods and services we experience and purchase in our daily lives. If the water is rising under our boat, we reason that the water is rising under all boats. We may have a good understanding of local conditions but a less accurate picture of underlying trends in a national economy. Economists understand the term on a macro level, when most people experience rising prices in the bundle of goods they buy. Inflation is a rise in the average of all prices for consumer purchases and often reflects price changes throughout the supply chain. To gather this information, the Bureau of Labor Statistics and the Census Bureau interview households and businesses from around the country each month. The monthly report on inflation may confirm our intuitive sense of changing prices or it may challenge our own appraisal. With all those resources and data, why do economists argue over the causes of inflation? In either case, we experience high inflation as a loss of purchasing power, and that sense of loss is magnified by the particular attention we pay to losses.
The Federal Reserve and most central banks around the world try to keep inflation at about 2% per year. That rate is thought to compensate for measurement error and a rise in the quality of goods. Our tendency to ignore small changes is evident in other areas of our lives. The 410-mile journey west on I-70 through Kansas is almost flat, yet in that span there is gain in elevation of 3258 feet (calculations in notes). Expectations play a key role in the decisions that people and companies make. Central bankers want small changes in the average price to play a negligible role in those decisions. Claude Shannon wrote that if what happens tomorrow is what happened today, then there is no new information. Our attention is piqued by news, or new information, so that we tend to pay attention to deviations from that average. The average becomes our environment. Statisticians recapture this human tendency when they standardize or normalize an average by setting it to 0, called a z-score.
We integrate quality improvements into our expectations so that gradual improvements are little noticed. In 35 years a 2% annual improvement in the quality of a product or service will result in a doubling of its quality. The reliability, safety, efficiency and performance of cars today are vastly superior to the cars in the 1970s. In 2020, the price of a new car was about 50% higher than in 1980, an annual price increase of less than 2%. I will leave the series identifier in the notes.
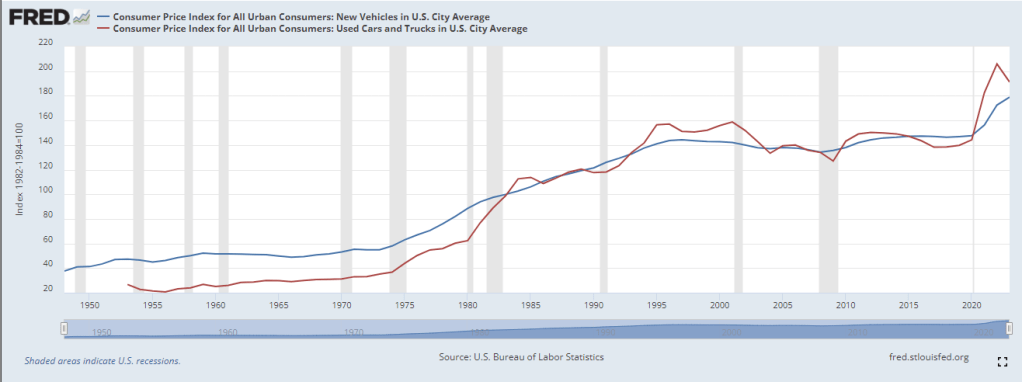
The quality of cars has increased far more than the increase in price. During that time, control of many systems within a car transitioned from mechanical control to precise electronic control, improving fuel efficiency. The quality of tires improved, reducing the number of flats that forces a driver to the side of the road. Air conditioners perform better and do not need to be recharged every few years because the seals leak. In 1980, the design of a car transferred too much of the impact of a crash to the driver. Today, a car is designed to absorb and distribute those physical forces. Seat belts protect the passengers from being thrown about during an accident, while front and side airbags cushion a violent change in direction. Quality has improved by at least twice the 50% increase in price.
During the high inflation of the 1970s, the real weekly earnings of wage and salary workers (LES1252881600) fell, as shown in the chart below. The term real means inflation-adjusted. In an age when families paid their monthly bills by check or money order, rapidly increasing costs sometimes meant that there was not enough money to pay all the bills. Although the recent surge in inflation has invited comparisons with the 1970s, workers’ earnings have outpaced inflation in this past decade and shown real gains.

If wage gains are rising faster than prices, why do consumer sentiment surveys not reflect this economic reality? Economist Paul Krugman had a short and helpful op-ed on the sentiment gap in recent surveys. Consumer purchasing power has increased since the pandemic, but consumer sentiment has declined by an amount comparable to the Great Recession in 2007-2009 when purchasing power decreased. He shows evidence from other surveys that one’s political party affiliation is strongly correlated with changes in consumer sentiment. People who usually vote Republican are optimistic about the economy when a Republican is President. Democrats express positive feelings when a Democrat is in the White House.
Political alliances are easily exploited via social media, whose use has skyrocketed since the Great Recession began at the end of 2007. Negative news and negative views proliferate on social media because we have a tendency to pay more attention to bad news. In the newspaper business, the rule was “If it bleeds, it leads.” Taking advantage of this human tendency, anonymous accounts on social media post total fabrications in order to get views. Higher views earn more revenue from ad placement, turning bad news into good news for the poster. News that gives the reader a sense of uplift or empowerment can be treated as “Pollyannish.” What other factors might account for the discrepancy between sentiment and reality? One aspect might be a rising standard of living.
Just as the quality of cars has increased, so has our standard of living in general. Families today are used to a higher standard with more conveniences than was typical fifty years ago. More conveniences equals more bills. These include monthly cell phone costs, TV and cable subscriptions, and higher electrical costs to run all the new appliances, computers and entertainment devices we have today. Some homeowners may experience fees for trash pickup or parking fees that were not typical in decades past.
Higher prices feel like a loss to us, and we pay attention to losses more than we do the wage gains. Economists Daniel Kahneman and Amos Tversky (1977) invented behavioral economics when they presented compelling evidence that our decisions are not always rational, that we weigh gains and losses on different scales. This challenged the conventional view that people’s choices were fundamentally rational, that bad decisions or poor choices were due to errors in judgment or a lack of information. Kahneman and Tversky asserted that irrational decisions were systematic rather than random error. Our tendency to measure gains and losses with different yardsticks can help explain why we become accustomed to improvements in our lives so that they escape our attention. Losses challenge our survival more than wins so we give losses our greater attention.
We survive by reacting promptly to threats. Children are taught to curb this natural impulse, to use their words, not their fists when responding to the behavior of other young children. We do not hit the butcher in the grocery store because the price of a steak has gone up 20%, but we might feel a bit of anger or resentment toward some nameless cause of the higher price. Even though inflation is part of our economic environment, it is not like the weather, we reason. Human decisions cause inflation so someone is responsible. However, the cause is more likely to be a composite of human behavior, of natural biases in how we process and react to information. That would make each episode of high inflation a unique blend of circumstance and policy decisions unlikely to be repeated in the future.
Economists, ever on a quest to find the Holy Grail, to understand the underlying process of high inflation, cannot admit the singularity of each episode. Next week, I will explore some of the factors that contribute to episodes of high inflation. Until then, watch Monty Python and the Holy Grail.
//////////////
Photo by Tadeu Jnr on Unsplash
Keywords: monetary policy, Prospect Theory, inflation
Bernstein, P. L. (1998). Against the Gods. John Wiley & Sons. In Chapter 16, Bernstein explores the ideas in Prospect Theory proposed by Kahneman and Tversky.
Kahneman, D., & Tversky, A. (1977). Prospect Theory. an Analysis of Decision Making under Risk. https://doi.org/10.21236/ada045771.
The index on new car prices is https://fred.stlouisfed.org/series/CUUR0000SETA01 The series identifier for the used car price index is CUSR0000SETA02.
Journey through Kansas: Kansas City on the eastern border is 909′ in elevation. Burlington, CO, at the western border of Kansas is 4167′, a rise of 3258′, or 0.617 miles. Dividing Hays, KS on the west side of Kansas is 2018′, a rise of 1000 feet. The state is 410 miles wide so the 1000′ gain in elevation is only .05% per mile. The 3000 gain in elevation is .15% per mile, a grade that feels flat to us.
