The Tragedy of the Rational Voter

September 29, 2024

By Stephen Stofka

This week’s letter is about voting. Many voters believe that their election choices are rational, based on their values, principles and self-interest. Some economists and political scientists think that our rationality is bounded. We make decisions using heuristics – a “good enough” approach that saves us time and effort. Election choices are guided by self-identification, by tradition, by allegiances. We make irrational decisions but in predictable ways because our choices are anchored by our cultural beliefs, our emotional reactions and cognitive assessment (Pindyck & Rubinfeld, 2017, 261).

Some people are single-issue voters, whose vote is guided by one policy or principle. Their choice of political party may rest on a belief in more government or less government, on more or less taxes, on more or less access to abortion, on more or less tolerance of immigration. The political parties do not want to resolve these hot issues because they drive voters to the polls.

A person’s election choice may be guided more by principal than financial self-interest. A lower income voter might pay little federal income tax but thinks the progressive income tax system is unfair. They vote for a party that promises to make the tax system less progressive even if it means that they may have fewer federal benefits or pay higher taxes. A voter’s choice of presidential party may rest on a local issue like property taxes or zoning regulations. National parties do not control zoning regulations, but they do signal a set of attitudes. Those attitudes help build a coalition of voters who share that perspective.

Let’s imagine that you, dear reader, are not the sort to take shortcuts. Election choices have consequences for an individual’s savings. Remove your Republican or Democratic hat and don the hat of a financial manager who has a fiduciary duty to their savings. If you have watched the TV series Clarkson’s Farm, now in its third season on Amazon Prime, you are aware that Jeremy Clarkson, the owner of the farm, has an experimental spirit and an ambitious imagination. Charlie Ireland, the farm’s land agent, offers a sobering contrast to Jeremy’s enthusiasm. Charlie is familiar with the prices of farm commodities and the average costs to produce those commodities. Charlie can do arithmetic in his head. Jeremy uses a hand-held calculator. Charlie presents Jeremy with a forecast of the disappointing (often) profits that will emerge from the many hours of hard work on a farm. Put on Charlie’s hat. Your goal is to present the facts to yourself, the owner of a farm called your portfolio.

Does the party affiliation of the president have an effect on the returns of the SP500 index? A financial forecast relies on historical data and cannot account for future events. The likelihood of more or less portfolio gain might have no consequence but it is helpful to be prepared. During a 4-year term, what are the expected average yearly gains in a stock index like the SP500? I will start with the presidency of Bill Clinton who began his two-term presidency in January 1993. The worth of a portfolio is what it can buy so I will use an inflation-adjusted index.

Two Democratic presidents, Clinton and Obama, had the highest annual gains. Both Obama and Biden began their terms under severe economic duress after a previous Republican administration. Clinton faced an economy with lackluster employment growth less than 1% following a mild recession two years before he took office. Trump had the third highest annual gains, helped by a relief rally at the prospect that his chaotic term was ending. In the three months after the 2020 election, the index gained 8.25%, an annualized gain of 33%. Now remove the accountant hat and don the voter hat. Does any of this information change your mind? Probably not.

Do you vote for the party that will lower your taxes? Don your accountant hat again and look for the average effective income tax rate. That’s the income taxes paid as a percentage of adjusted gross income. As the table below shows, the effective rate is about 15 – 16% in normal years. A crisis year like the invasion of Iraq, the financial crisis and the pandemic cuts the effective rate by 10%. Incomes and capital gains are reduced. All three crises occurred under a Republican president.

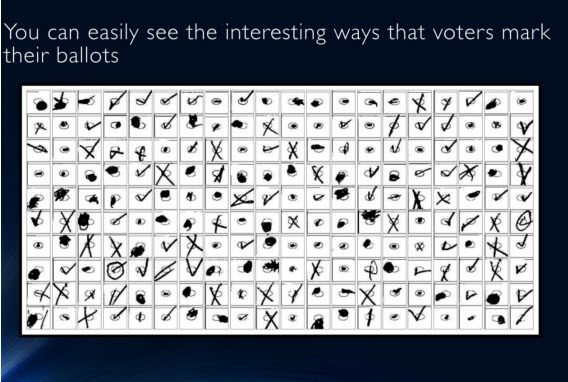
Real life is not a Hollywood script. The evidence is not decisive. We should put our accountants’ hat in the file drawer on election day and use our customary shortcuts. Some voters make one of two alternative choices. Out of disinterest or disgust, some don’t vote. In a presidential election, some undervote, choosing candidates down the ticket but leaving their choice for president blank. The Election Audit Commission (pdf here) notes that an election official may have to inspect a ballot in case automated software cannot read a voter’s mark. Here’s a picture showing the many different ways voters have marked their choices (p. 13).

In the 2012 election, 1% of voters left their presidential choice unmarked, according to a USA Today analysis. In 2016, it was almost double that percentage – 1.9%. Recent polls indicate a tight race between Trump and Harris. As happened in 2016, a small number of voters in several key states could decide the election. In the 2000 Presidential election, several hundred Floridian voters mistakenly marked Buchanan for president instead of Gore. Some realized their mistake, crossed out their initial mark and voted for Gore. This resulted in an overvote for two candidates on the same ballot. In many cases, this voided the voter’s choice entirely.

Over $14 billion was spent in the 2020 election campaign, according to Open Secrets. In a nation of millions of voters, it is irrational that a few thousand voters or less should decide an election. Last week, I referred to John Bates Clark, a 19th century economist, who asked why a small surplus of wheat in the northwest should determine the price of the entire wheat harvest. In a “winner-take-all” fashion, 48 states award all their electoral votes to the candidate who gets the most votes. A few thousand votes may decide all the electoral votes in a state. Why should a person make a rational choice when an idiotic election system neutralizes their careful deliberation?

//////////////////////

Photo by Giorgio Trovato on Unsplash

Pindyck, R. S., & Rubinfeld, D. L. (2017). Microeconomics. Pearson Education Limited.

What is Value?

September 22, 2024

By Stephen Stofka

This week’s letter is about value. Is there a true value and how is it determined? Does the value of something depend on its usefulness or is it an unchanging abstract quality? What is the difference between true or intrinsic value and exchange value? What is the diamond-water paradox? Is there a true price P* of exchangeable goods, or a true price of money, the interest rate r*? Is there such a thing as a fair wage? Whenever government sets a price for something, it does so to correct a perceived distortion in the market price for that good. Governments pass rent control policies to set the price of housing, or establish a minimum wage. A central bank sets a benchmark interest rate that determines the price of borrowed money. Is there an intrinsic value to tradeable goods?

In Chapter 4 of The Wealth of Nations, published in 1776, Adam Smith (1723 – 1790) discussed the two different meanings of the word value: value in use, and value in exchange. Like others of his time, Smith limited his concern to the value and price of commodities, not the scarce artisanal goods that only the wealthy could afford. “Nothing is more useful than water: but it  will purchase scarce anything…A diamond, on the contrary, has scarce any value in use; but a very great quantity of other goods may frequently be had in exchange for it.” Smith sought the “real measure of this exchangeable value” as well as the components of this real measure that he called the “natural price.” Lastly, how did circumstances affect the market price so that it differed from the natural price? This investigation, he warned the reader, would require three chapters of the book to fully explore. “I am always willing to run some hazard of being tedious in order to be sure that I am perspicuous,” he wrote, begging the reader’s patience.

Smith determined that the exchange value of a commodity is the “toil and trouble of acquiring it.” If Mary wants to exchange commodity A for commodity B, then the exchange value of A is the toil and trouble it will save Mary to get or make B. When Smith concluded that “Labour is the real measure of the exchangeable value of all commodities,” he is referring to the labor saved by the buyers of a commodity. The natural price of a good, Smith later concluded, was the average of many different individual valuations within a region, varying by both region and country.

Smith’s theory of value differed from an earlier writer, Richard Cantillon (1680 – 1734) whose Essay on the Nature of Commerce was not published until 1754, a decade before the publication of Smith’s Wealth of Nations. “Land is the source … from whence all wealth is produced,” Cantillon wrote, voicing a view held by a prominent school of philosophers, the Physiocrats, although he was not a member of that school. The basis of wealth was agricultural, the difference between what was produced and the sum of the inputs. The fertility of the land provided that difference in value. Cantillon believed that “there is never a variation in intrinsic values” but that a mismatch between supply and demand can cause market prices to differ from their intrinsic value. In well-organized societies where production and consumption are more constant, Cantillon observed that there were only small variations between the market price and the intrinsic value.

David Ricardo, John B. Say and Karl Marx promoted economic theories where goods had both an intrinsic and market value, based on the labor needed to produce the goods. The debate over intrinsic value was an arbitrary set of definitions that could not be resolved. Finally, the Marginalist school of economists in the late 19th century rejected the idea of an intrinsic value as an economic concept. It was a speculative concept of philosophers and political scientists, not economists. There was no intrinsic value to a worker’s wage other than the marginal product of that labor. To an employer, the value of that labor input is only as much as the change in the output.

In The Distribution of Wealth published in 1899, John Bates Clark challenged the idea of marginal productivity as the basis for a worker’s wage. The problem was that the surplus supply of goods and labor played a key part in determining the value of the entire supply of that good. In Chapter 7 Clark noted that the price of all the wheat grown by farmers in the northwest United States was determined by the price of whatever surplus wheat there might be when all the wheat reached the marketplace. Why should the marginal surplus determine the price of an entire crop? In Chapter 8, he wrote that a worker’s wage was not based on a worker’s marginal productivity but the marginal loss to the employer if an employee left or wasn’t there. Clark called it a zone of indifference and within that zone were expendable workers. Should the wages of expendable workers become the standard for the wages of other workers, he asked.

The Marginalist economists separated Political Economy into two fields of study, describing transactional relations with mathematics to bring greater precision, clarity and scientific discipline to the study of economics. They disregarded what are called allocational inefficiencies,  flaws in the pricing system that distorted the distribution of goods and services. History, past policy, demographics and the local environment form a less flexible landscape that does not adjust to price signals in some markets. Governments try to correct those flaws, only to introduce other distortions into the pricing system that can be worse than those of a free market.

The real estate market in New York City is an example. In a free market, developers would respond to market demand, buying up single family homes, and “scraping” them to build two-plex and four-plex residences. Zoning regulations championed by local politicians and supported by existing homeowners interfere with that free market dynamic. Next week I will review the distortions that such zoning regulations and rent control introduce to the housing market.

////////////////

Photo by Evergreens & Dandelions on Unsplash

Clark, J. B. (1965). The distribution of wealth: A theory of wages, interest and profit. Augustus M. Kelley. There are several Kindle versions of this work for about $1 at Amazon.

Keywords: marginalist, Labor Theory of Value, fair wage, rent control

The Average

September 15, 2024

by Stephen Stofka

This week’s letter is about two different investing styles, active and passive, and how they are affected by the average. The active vs passive debate in investing began several decades ago when John Bogle founded Vanguard as a way for individual investors to invest in a market basket of stocks. The active investor is like a miner panning for gold in a mountain stream. He (mostly male, I think) carefully studies the residue in the bottom of the pan, looking for the glint of gold in the sunlight. Some miners strike it rich while most barely cover the costs of their tools and time. The index investor, on the other hand, buys a share of the company that buys gold from the individual miners.

The core issue in that debate stretches back to the classical period in ancient Greece and the role of our powers of reason. In the following sections, I will rely on some points my wife, Dr. Beth Davies, made to her class this week. For some background, Aristotle was a Greek philosopher who lived and wrote in the 4th century B.C. Thomas Aquinas was a 13th century Christian theologian who tried to unite the secular reasoning of Aristotle with the Catholic tenets of faith.

Davies writes “Aristotle places all of his confidence in our faculty of reason. No matter the shifts that our fortunes face in life, we can always apply practical reason and therefore pursue our desired end, which is to flourish (be happy).” The active investor believes that research and reasoning can generate what is known as alpha, the extra return that an investing strategy has over an average that serves as a benchmark.

Davies writes “Aquinas loved Aristotle’s philosophy … but the worldview of his time was saturated with the belief that human nature is inherently sinful,” implying that our sinful desires interfere with our reasoning process. How did Aquinas resolve this dilemma? Davies continues, “He did it by adapting the Islamic idea that human intellect is a natural process. Since God created nature, natural processes are not corrupted by sin. Medieval theologians grouped intellect into this category of ‘natural process.’ Medieval theologians, Christian and Islamic, needed a way to preserve some part of the mind from sin, and since reason can be corrupted by appetite, they settled on intellect.” Having less confidence in their intellectual expertise at investing, the passive investor accepts an average market return and saves both the expense of higher trading fees and their own time.

In Thinking Fast and Slow, Daniel Kahneman noted the many cognitive biases that introduce flaws in our reasoning when we make choices. In recognition of these biases, investment managers have developed algorithmic trading models intended to reduce human error and bias. The execution of those strategies can be tainted by faulty reasoning as well, so investment managers are turning toward machine learning. Criteria like minimum returns and acceptable risk ratios are input into programs which run thousands of simulations on trading data and research to find optimal trading strategies (Hansen, 2020). In a medieval interpretation, these programs are the embodiment of the distinction between intellect, created by God, and corruptible human reasoning.

Most individual investors do not have the time, resources or background to develop or maintain such strategies. In the future, investment managers may offer funds or ETFs that employ such strategies but will charge higher fees for the promise of higher risk-adjusted returns. In an analysis of eight years of market data from 2009 -2017, Prondzinski and Miller (2018) wrote “evidence suggests that active funds underperform index funds by approximately the difference in their costs.” If these strategies do deliver higher returns, more investment firms will use them, raising the average market return and reducing alpha to near zero. Even if short-term returns are higher, a passive strategy should produce returns at least as good as many active strategies.

Indexes rely on the power of the mean. There are several ways to compute an average, or mean, but the most common is the arithmetic mean, determined by the sum of the data divided by the number of data points. Few if any data points match the average, yet it is a benchmark concept in statistics, forming the basis for many calculations like variance and standard deviations. Index funds rely on the Law of Large Numbers, creating a sample of a large dataset filtered by some criteria like market capitalization. Unlike machine learning, the filter criteria is not a dynamic optimizing strategy but a characteristic of the market. It is less dynamic but a “good enough” strategy that minimizes costs.

To Aristotle, the virtuous mean was a behavioral phenomenon where an individual used their reason to compromise between extremes of action. On a highway, some drivers are weavers, changing lanes frequently in the belief that an optimizing strategy will get them to their destination sooner. Some drivers keep to one lane, going with the flow and making few changes until they approach their exit. At the exit, they experience a sense of satisfaction upon finding that they are only a few cars behind a weaver. That is index investing.

//////////////////

Photo by StellrWeb on Unsplash

Keywords: passive investing, active investing, alpha

Hansen, K. B. (2020). The virtue of simplicity: On machine learning models in algorithmic trading. Big Data & Society, 7(1), 205395172092655. doi:10.1177/2053951720926558. Available from: https://journals.sagepub.com/doi/full/10.1177/2053951720926558

Prondzinski, D., & Miller, M. (2018). Active Versus Passive Investing: Evidence From The 2009-2017 Market. Journal of Accounting and Finance18(8). https://doi.org/10.33423/jaf.v18i8.114

An Economic Nexus

September 8, 2024

by Stephen Stofka

This week’s letter is about the labor market, part of a series on investing. Friday’s monthly labor report indicated a job market that is cooling but still growing. Although the market reacted negatively to the news, the Fed will begin reducing interest rates at its meeting next week. The S&P 500 index, the most widely held basket of stocks, is up 15% for the year but the index has twice risen above 5500 before falling back. An index of business activity in the services sectors continues to expand but manufacturing activity is still contracting slightly. When investors get conflicting economic signals, they are responsive to negative data points more than positive ones. The approach of what may be a contentious election creates an environment where investors are more likely to protect their portfolio value and exit short-term positions. Let’s now turn to long-term trends in the labor market.

Economists at the Bureau of Labor Statistics (BLS) refer to workers aged 25 -54 as the core work force. To save some typing, I will refer to this age demographic as the “core.” During those thirty years we accumulate stuff while we build our careers. We buy cars, furniture, homes and vacations. We build retirement savings for ourselves and college funds for our kids. The core is the nexus of a growing economy.

This coming Wednesday we will remember 9-11 and the 3,000 civilian lives lost in the attack on the World Trade Center in lower Manhattan. Since that time, there has been little investment in those workers who form the core of the labor market. From August 2001 to August 2024, the economy has added less than seven million jobs in that age demographic, an annual growth rate of just 0.28% (See FRED Series LNS12000060).

As you can see in the chart above, most of the growth in the core has occurred during the Biden administration. The surge in employment in this age group led to growing incomes and greater purchasing power in an age group that is in the accumulation phase of its lifetime. That rapid growth in employment, coupled with pandemic recovery payments from the government were strong contributors to the rise in inflation in the 2021 – 2023 period. Voter sentiment in this age group focused on the inflation, not the job growth, demonstrating again that we pay more attention to negative rather than positive news.

Several factors contributed to the plateauing of job growth in the core. Demographics played some part. Population analysts have assigned a span of about 18 years to each generation so that the thirty-year span of the core labor force encompasses two and sometimes three generations. The first of the large post-war Boomer generation turned 54 in 2000. As the Boomers aged out of the core, a smaller Generation X, born 1964 to 1982, became the dominant component of this age group. In 2013, the first Millennials, a generation larger than the Boomers, joined the core, and in 2016, the last of the Boomers aged out of the core.

A few months after 9-11, China was admitted to the World Trade Organization, and within a decade became the world’s factory. Investors poured capital into China, taking advantage of low labor rates and a currency whose exchange rate was maintained at a low level by the Chinese central bank. Investors from outside China got more bank for their buck. As investment moved to China, many production facilities in the U.S. shuttered their doors. In the seven-year span between China’s admittance to the WTO and the start of the financial crisis in September 2008, manufacturing employment (see FRED Series MANEMP) fell by a fifth. By January 2010, employment in the manufacturing sector had declined by a third.

During the 2000s, low interest rates fed a frenzy in home financing and produced a bubble in the U.S. real estate market that imploded in 2008. The resulting financial crisis affected assets and financial institutions around the world. Millions of Americans lost their jobs. From the start of 2008 until the end of 2009, the core work force fell by 6%, about six million jobs. In 2018, an interval of ten years, the level of employment in this age group finally rose above its 2008 level.

Instead of vigorously promoting policies that encouraged job growth, the Obama administration offered policies to support families suffering from the lack of job growth. Democratic politicians eagerly passed ambitious social programs but faltered when implementing policy solutions that embodied their legislative goals. In Recoding America, Jennifer Pahlka (p. 125) recounts the efforts to fix healthcare.gov, the bungled rollout of the health exchanges created under the Affordable Care Act known as Obamacare. In The Rise and Fall of the Neoliberal Order, Gary Gerstle (p. 226) notes that the Obama administration focused more effort and political capital on providing healthcare insurance for poor people rather than supporting the 9 million households in danger of losing their homes to foreclosure.

A sense of betrayal soured voter sentiment and helped to support the emergence of the Tea Party in the 2010 election and the MAGA voters who supported Donald Trump’s candidacy in the 2016 election. In 1976, voters punished President Gerald Ford for pardoning Richard Nixon. In the 2016 election, voters punished Hillary Clinton as a symbol of a set of values disloyal to many Americans. Donald Trump promised to bring manufacturing jobs back to America by taxing Chinese imports and cutting corporate taxes. In the first three years after the 2008-2009 recession, manufacturing employment under Obama grew by more than it did in the first three years of the Trump presidency (see notes for details). No amount of political rhetoric can overcome the power of a supply chain now firmly anchored in Asia.

Biden’s infrastructure policies have actively promoted job growth in the core. Can the economy sustain such growth in this acquisitive age group while keeping inflation at a reasonable level? Should the Fed raises its target interest rate from 2% to 3% to accommodate job growth that supports people when they are raising families and building careers? I think so. Should Harris win November’s election, she should adopt Biden’s pro-growth policies. Should Trump regain office in the coming year, he will try to use tariffs to shift the nexus of the global supply network from Asia back to the U.S. That policy will only increase prices and help maintain a higher level of inflation without promoting the economic growth that supports households in their middle years.

 ///////////////

Photo by Tim Mossholder on Unsplash

Manufacturing employment notes: From January 2010 to December 2012 manufacturing gained 500,000 jobs, an increase of 4.4%. From January 2017 to December 2019, the manufacturing sector gained 432,000 jobs, an increase of 3.5%. In January 2010, manufacturing employment was near a low, continuing to fall after the official end of the recession in July 2009.

Keywords: Obamacare, inflation, labor, financial crisis, China, manufacturing, infrastructure

A Generation of Homes

September 1, 2024

by Stephen Stofka

This week’s letter is about real estate, part of a series on investing. In the past weeks, I have taken an informal inventory of a half-dozen dumpsters parked in front of vacant houses in the metro Denver area. They are full of earth-toned kitchen and bath cabinets, paneling and other home appointments popular during the 1970s. In that decade, younger Boomers threw out the metal kitchen cabinets of 1950s post-war starter homes and the craftsmen cabinets of pre-war homes. Now the Boomers are aging out of the homes they bought forty years ago, and a new generation takes their place.

Many older homes built in post-war America had smaller rooms to accommodate growing families. Newly remodeled homes for sale often feature open floor plans where a wall has been removed between a kitchen and dining room or living room and dining room to connect kitchens with the primary living space. Removing a bedroom wall to create a bigger living room or family room can have the unfavorable effect of reducing the number of bedrooms a house features.

White, pale gray and dark brown cabinets are  popular color schemes now. In the 1970s, white and dark mahogany were typical of cabinets in apartments. Honey oak cabinets in a house conferred a modest upgrade in status. Now it means old and outdated unless there are glass panel insets in the cabinet doors. Formica is so like last century. When investor groups remodel a home for sale, they install quartz countertops, which are more expensive but less maintenance than Corian or granite countertops. Kitchen and baths get the most attention from potential home buyers, so those rooms receive more investment.

LVP plank flooring can simulate the look of real wood or stone and is a popular choice in newly remodeled homes for sale. In some homes the same style and color LVP is used throughout the home, including the kitchen, baths, laundry, living room and bedrooms. Area rugs in each room could be used to give each room a distinctive theme, I suppose, but the uniformity of that look is not to my taste, particularly when the color is dark mahogany.

There are many steps to buying a home, but the first step is familiar territory. What does my family want? A house is a home in a neighborhood. What amenities does the neighborhood offer and which are important? These include schools, public transportation, housing density, crime statistics and environmental risks like fire, wind, and temperature extremes.

There are several types of homes and ownership. In a single-family home, the owner is responsible for the exterior of the structure and the plot of land where the house sits. A townhome is a residence attached to another residence so there is a shared responsibility for the exterior of the structure. Typically, a homeowner’s association (HOA) manages this communal responsibility and each association spells out common and individual responsibilities in their covenants. These include regular maintenance of the grounds like lawn mowing, tree trimming, repairing or resurfacing paved areas within a townhome development. An HOA might be responsible for siding, brick and roof repairs but hold the townhome owner responsible for damage to the rear concrete patio of their home. A townhome owner is usually responsible for repairs to equipment that services only their unit. Examples include a forced air furnace, an AC unit or a hot water heater.

The owner of a condo is responsible only for the space between the four walls of their home. The inside of an outside wall is the owner’s responsibility. The outside of that wall is a communal responsibility. Equipment systems often serve more than one owner and repairs to these systems are the responsibility of the HOA. The responsibilities are spelled out in the covenant, or CCR (covenant, conditions and restrictions).

Today there are several real estate companies that provide free access to the Multiple Listing Service (MLS) of homes for sale. They offer the ability to filter by location, price, the type of house and the number of bedrooms and bathrooms. A real estate agent can usually provide additional filtering criteria that include the quality of schools, zip codes and square footage. However, the filtered results may not pass additional criteria that a family has. Taking notes in a Word document or other software helps to sort out and remember key details about a property so that the homes do not merge into a blur of pictures and facts. Here is a list of features that you can build on.

Address: the street address first, theninclude a nearby major intersection, for example. The price and whether there has been a price increase or decrease. The square footage, the number of BRs and baths and whether the home is subject to a monthly HOA fee. Natural light is important to me, so I use Google Maps to help me identify which direction the front of the house faces.

Status: Initially leave this blank. If you discard, state that and one or two reasons. Don’t delete the property, but cut and paste it at the end of the document in case you want to revisit it later. This will help you identify “gotta haves.” Low rated primary school might be one or the year the house was built. The master BR is not big enough or there is not enough light.

Financial Metrics: the dollars per square foot (psf) calculated by dividing the list price by the square footage. For no charge, propwire.com will allow you to view median selling prices for homes in that area. Enter the address of the home, then click the Market tab in the results.

Exterior: the listing will have a street view, but these often distort distances from the curb to the house itself. Enter the address in Google maps to see what the property looked like in the past. On a computer, Google maps will display the month and year the photo was taken by their truck camera. In the compilation of photos for the listing, note any features like a recently installed roof, siding, or garage door. The fence may need repair or there is a tree growing close to the foundation of the house. There may be a cozy porch leading up to the front door. Taking notes can help train us to notice and categorize details.

Equipment: the text of the listing will list details like a new roof, hot water heater, furnace or AC. Note them here. Recently installed equipment should reduce your expenses in the first decade of owning the home.

Neighborhood: On Google maps you can see features that might be important to you. A grade school is nearby but on the other side of a major intersection. Is that a problem? Note any nearby parks or other green spaces if those are important to you. Later on, if you do an initial drive through the community, note the general condition of the neighborhood. Single family homes governed by an HOA will usually present a more consistent appearance and maintain their landscaping. In a neighborhood without an HOA, that consistency is lacking.

Shopping, etc: note any commercial or government agencies nearby that are important to you. These might include grocery, drug and hardware stores, restaurants, a movie theater or a library. There is a lot of easily accessible information on your computer screen.

As you browse the photos in the home listing, note any details, positive and negative that catch your attention. Later, these short notes will help jog your memory. An example is below:

Kitchen: gray cabs, pale gray wall color. Lots of cabinets. Swing door to rear deck.

Bedroom: Master is 15’ x 12’ OK. No closet doors in smaller BR?

LR: big window, faces south.

This inspection list can be done in front of a computer screen without any visit to the house itself. If there are several properties in a community, a visit to the neighborhood may help you refine your search further to reduce the number of homes that you physically inspect. There are many checklists when you do a physical inspection of the home. Here is a printable checklist from a blog writer at Orchard, a real estate company. I hope that these tips will make your house hunting a bit more organized and save you some time and effort.

/////////////////////

Photo by Phil Hearing on Unsplash

Keywords: house, homebuying