November 6, 2022
by Stephen Stofka
Many people compare today’s inflation with that of the 1970s. A better comparison might be with a much earlier period. This week’s letter will be about the change in the inflation rate. Inflation is like the speed on a speedometer. If I accelerated from 50 to 60 MPH over a certain time period, perhaps 10 seconds, the change in the speed is 10 MPH. The time period I’m looking at is one year. If inflation rose from 1% to 5% in a year’s time then the change is 4%.
I’ll start with the current year. The one year change peaked at 6.1% in the first quarter of 2022. As the Fed raised rates, that change moderated. It’s like accelerating to 60 MPH and realizing that the speed is over the speed limit and reducing speed by easing up on the gas pedal or braking.

Most of the time the inflation rate changes by less than 2% up or down. During and after recessions it can become more volatile. In 1980, inflation soared above 14% and the one year change peaked at 5.8%, slightly less than our recent experience.
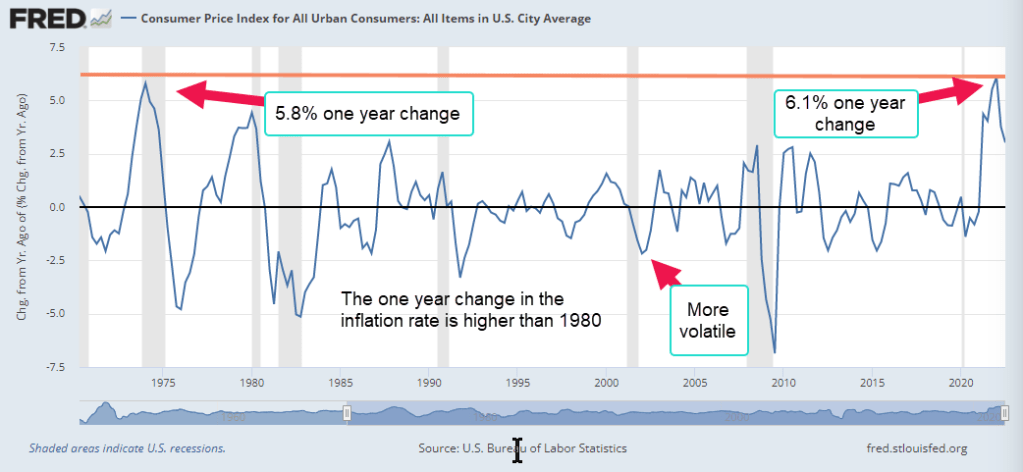
There has only been one time in the past 70 years when the inflation rate rose faster than today. That was in 1951, shortly after the Korean War began. For the first six months of 1950, prices sank – deflation – then war was declared in June 1950 and the U.S. again ramped up defense production. The one year change in inflation peaked above 10% as Federal defense spending shot up 45%.

If you would like to explore this period in more detail Tim McMahon (2014) presents 1950s inflation data in an easy to read format. A hundred years ago, a period of persistent deflation – not inflation – followed the last pandemic. See Tim’s second link below. The Federal Reserve was still fairly new and the U.S. and European nations had adopted a gold standard that would eventually lead to the Great Depression. That’s another story. Today the world’s commerce is interlocked and pandemic shutdowns continue to deliver a series of supply shocks. Getting policy right is more difficult when circumstances are this unusual.
Volatile Inventories
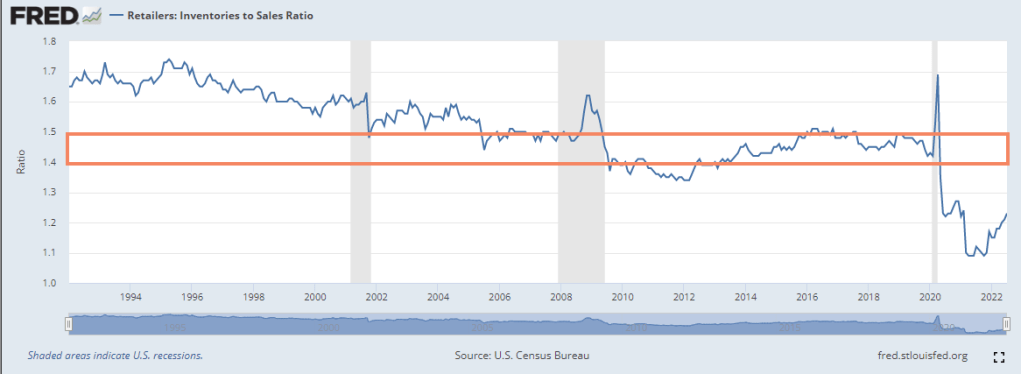
Inflation rises when there are inadequate resources to meet demand. In 2021, real private gross domestic investment rebounded quickly, rising almost 32% on an annualized basis in the 4th quarter. One component, inventories, was responsible for much of that surge. Even under normal conditions, this series is a volatile component of GDP (BEA, 2019) and the BEA publishes a figure called Final Sales of Domestic Product which excludes the change in inventories. Real final sales is approximately close to inflation-adjusted GDP.
During the pandemic manufacturing and retail goods sat in container ships off the port of Los Angeles and other ports. While the goods were in transit, they were not added to inventories. In the 2nd quarter of 2021, businesses began to open again but the ports were slow to unravel their logjams. Empty truck containers sat in parking lots and on neighborhood streets near the L.A. port while ships waited in line out on the water.
Sales surged as economy reopened
In the 2nd quarter of 2021, real final sales increased 2%, finally reaching pre-pandemic levels. In the first half of the year, real food and service sales shot up 10%. Normally that increase would occur over three years. However, within months that initial surge subsided. Over the next two quarters, real final sales barely increased. Real food sales declined slightly. This confirmed a temporary response to a post-pandemic recovery. With so many items out of stock, customers were willing to pay higher prices to get products. Some businesses had orders shipped from Asia by air. In the 4th quarter 2021, the floodgates opened and real private inventories rose by a record $197 billion.
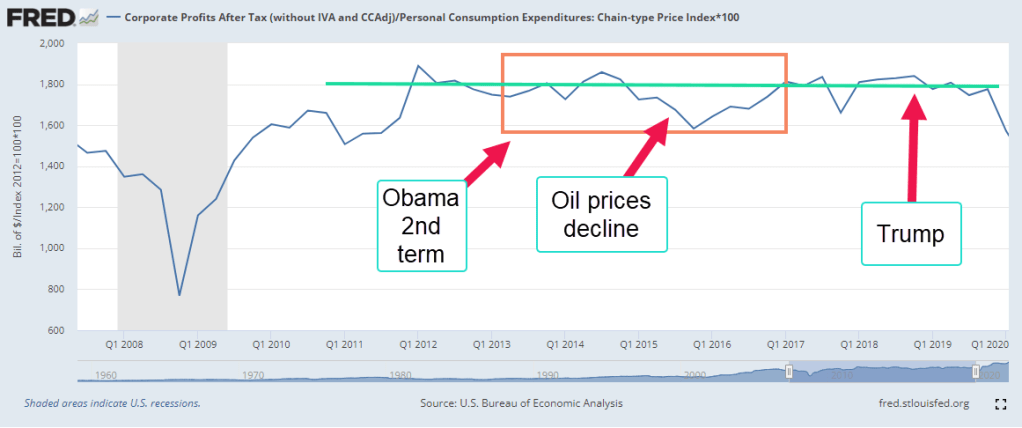
Profits Surge
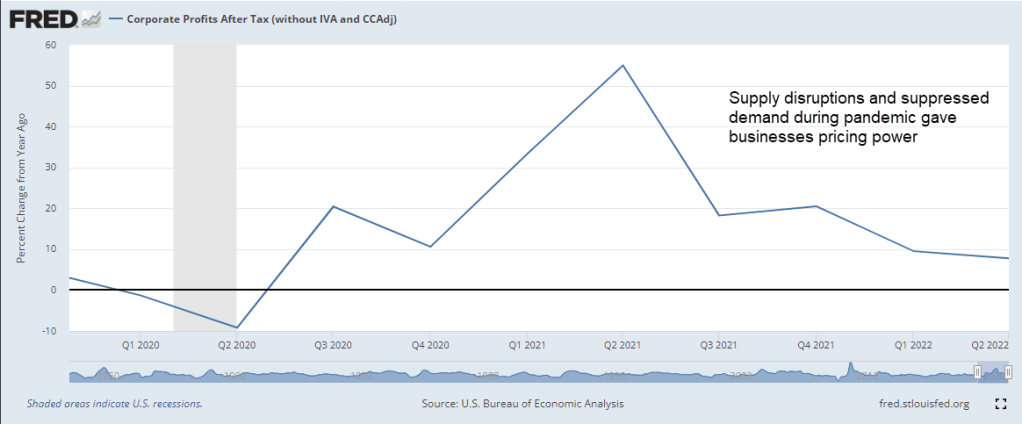
Real retail and food services sales fell slightly. In the last six months of 2021 inflation topped 5% but people were not buying and selling more stuff. Where were the price pressures? During the inflationary second half of the 1970s, profits increased a whopping 12% per year in those five years. In 2021, corporate profits rocketed up. Supply disruptions and repressed demand during the pandemic gave businesses pricing power. In 2021, corporate profits increased 18%. If demand was relatively flat, that pricing power had to fade but profit growth was still strong in the first quarter. Like the 1970s, rising corporate profits and pricing power were major contributors to inflation. This week the House Committee on Oversight and Reform (2022) came to a similar conclusion. What is the source of that pricing power?
War in Ukraine
In February 2022, Russia attacked Ukraine, sending energy prices higher. XLE, a broad energy ETF, gained 35% by early March. Two months later, the BEA reported another record rise in real private inventories of $214 billion. However, real final sales fell 2.5%. Some economists pointed to low unemployment and rising wages but ECI wages of private workers were on the same trend as before the pandemic when inflation was low. Most of the rise in the inflation rate was in housing, food and energy prices. The pandemic and low interest rates had contributed to the rise in housing costs. The war in Ukraine was responsible for volatile energy prices. There was no increase in real food sales but food prices were rising. Four large meat producers had profit growth of 134%, the committee reported.
The Puzzle
Historians still argue about the causes of World War I a century ago. Economists still cannot agree on the inflation mechanism of the 1970s. Contributing causes were rising corporate profits, shifting demographics in the work force, oil supply shocks, a shift in the international monetary regime and an evolving trans-global economy in the post war era. Economists do agree that it was a gestalt of market, fiscal and monetary forces, complicated by geopolitical and policy shocks that shaped expectations of future inflation. When people expect further price increases, they buy more now, aggravating inflationary pressures. Those expectations helped entrench inflation in the economy of the 1970s. Paul Volcker, chairman of the Fed in the late 1970s and early 1980s, raised interest rates so high that it wrung inflation out of the economy but at great economic cost to many families. The high interest rates caused two recessions, one of them the worst since the Great Depression.
The Korean War
In answer to the surge of inflation in 1951, the Fed raised rates slightly but rates stayed below 2%. The government did the heavy lifting. In September 1951, President Truman started a regime of wage and price controls administered by the Economic Stabilization Agency (ESA) and Wage Stabilization Board (WSB). There were loud protests against the controls and President Eisenhower ended them after he took office in 1953. Several months later the Korean War ended. In 1971, President Nixon instituted wage and price controls and demonstrated the failure of controls. Monetary policy is the weapon of choice to combat inflation but rising rates disproportionately affect the most vulnerable workers.
Conclusion
Infrequent events are an intersection of many factors that make each one unique. As economists pull apart the tangle of causal narratives, they develop new theories or modify existing ones. Economists usually cling to a favorite – either supply or demand. I’m watching profit growth. If Republicans take the House and possibly the Senate in the coming election, they will try to further enhance corporate profits at the expense of social programs like Medicare and Social Security. Republicans continue to sell a “trickle down” narrative but decades of evidence shows that the trickle is but a few drops. What goes to the top stays at the top.
///////////////////
Photo by Ana Municio on Unsplash
BEA: Bureau of Economic Analysis. (2019). Chapter 7: Change in private inventories. Retrieved November 4, 2022, from https://www.bea.gov/resources/methodologies/nipa-handbook/pdf/chapter-07.pdf
The House Committee on Oversight and Reform. (2022, November 4). Subcommittee analysis reveals excessive corporate price hikes have hurt consumers and fueled inflation, while enriching certain companies. House Committee on Oversight and Reform. Retrieved November 5, 2022, from https://oversight.house.gov/news/press-releases/subcommittee-analysis-reveals-excessive-corporate-price-hikes-have-hurt
McMahon, T. (2014, April 23). Inflation and CPI consumer price index 1950-1959. InflationData.com. Retrieved November 3, 2022, from https://inflationdata.com/articles/inflation-cpi-consumer-price-index-1950-1959/. Inflation data for 1920-1929 is here https://inflationdata.com/articles/inflation-consumer-price-index-decade-commentary/inflation-cpi-consumer-price-index-1920-1929/