
June 19, 2022
by Stephen Stofka
There are several series of inflation and each offers a different perspective on annual price changes. Each month the Bureau of Labor Statistics publishes a headline number CPI-U, or Urban index, which estimates the annualized price change for urban dwellers of all ages. It also publishes a CPI-W or Worker index, which is focused on the spending priorities of working families. Yet another series is an index that the Federal Reserve uses to establish a longer term trend for price changes. This week the Fed enacted a rate increase of .75%, its strongest response to inflation since 1994, to counter the acceleration in price changes.
Working families and the general urban population differ in their spending priorities in transportation costs, household expenses and health insurance (BLS, 2021). Out of every $100 of income, working families spend about $2.40 less on maintaining a household, but $3.80 more on transportation. Being younger, they spend less on health insurance, about $1.50. The difference between the two series indicates which part of the population is bearing the weight of price changes. When transportation costs rise more than housing costs, the difference between the Workers and Urban index is positive.
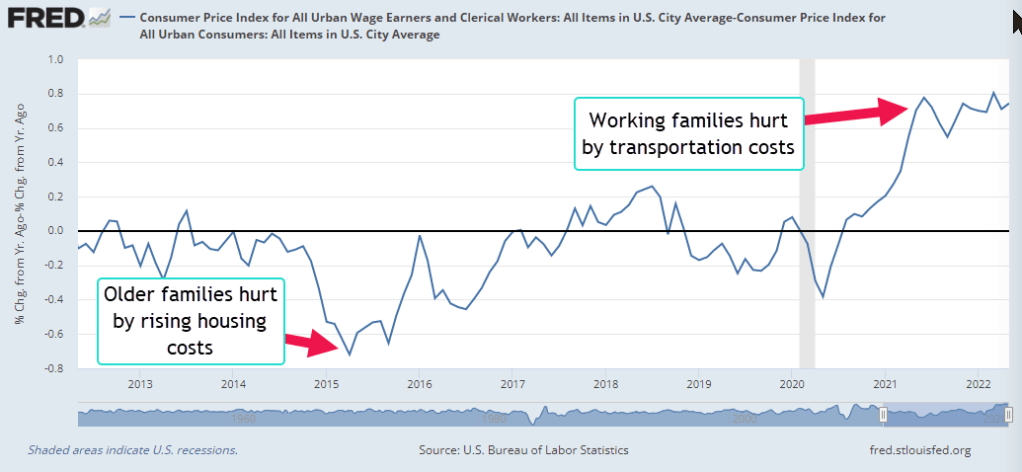
In 2015-16, increases in senior housing costs caused the difference to go deeply negative. Starting in mid-2021, rising costs for new and used cars produced a positive difference, the highest since WW2. The Russian attack on Ukraine in February accelerated increases in gas prices and working families have borne more of that burden. Rising food costs have an almost equal impact, although working families tend to spend more eating out.
Just as we feel changes in our car speed, we feel changes in inflation. We expect some variation up and down around an average, but expect a balance of up and down. We are sensitive to acceleration, the change in speed, and become alert to too much up or down. Since mid-2021, the monthly acceleration in price changes have been mostly up.
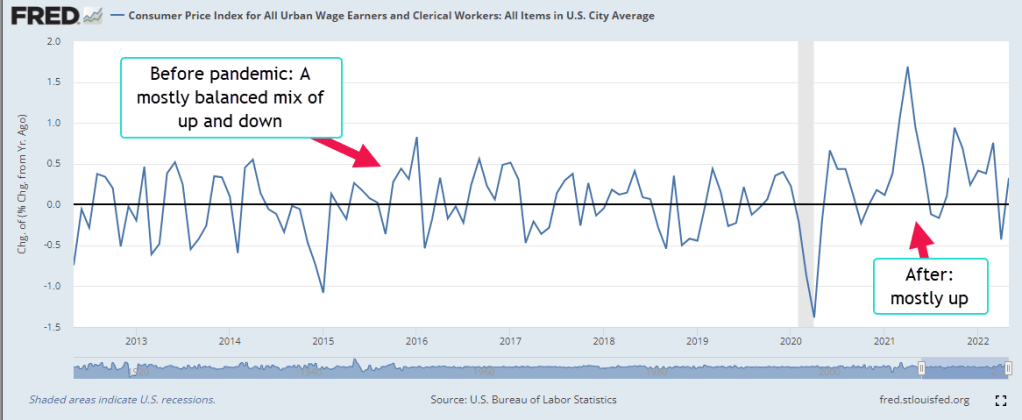
Because pandemics only come along once a century and strangle the global economy, it was hard to tease out the underlying trend. Look at the negative drop in inflation in April 2022 on the far right side of the graph. The acceleration in price changes seemed to be easing up. In May 2022, the acceleration turned positive again and that prompted the Fed’s strong move this week.
Price changes in energy and food are both seasonal and volatile. To understand the trend, the Fed looks at yet another CPI index that excludes food and energy. Before the pandemic, the variation around the trend was small.
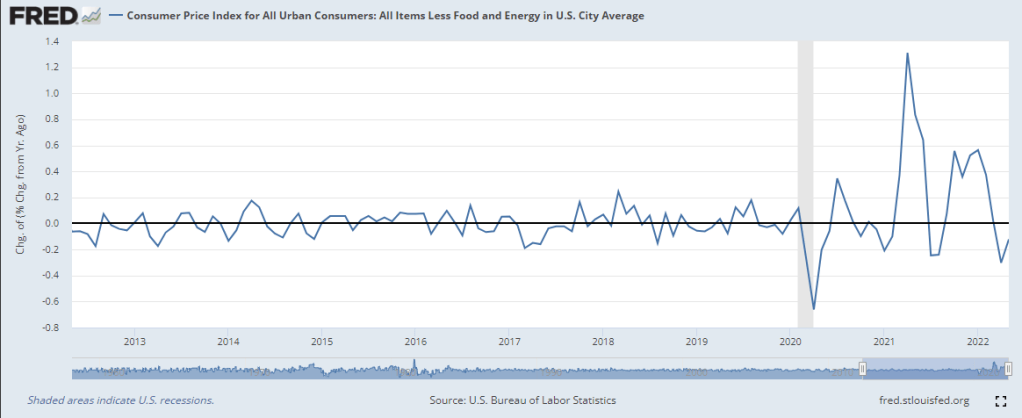
After the pandemic the variation in inflation was as severe as the early 1980s. Supply chains had been shut down, goods were stacking up at US ports, people were getting vaccinated and were spending money. With a shortage of new cars because of a chip shortage, used car prices increased a historic 45% in June 2021. Veterans in the industry shook their heads in disbelief. What should the Fed do? It has a double mandate of full employment and stable prices. Unemployment was still high at 6% in the spring of 2021. They maintained a zero-interest rate policy. As unemployment fell below 5% in September 2021, they probably should have increased interest rates a little.
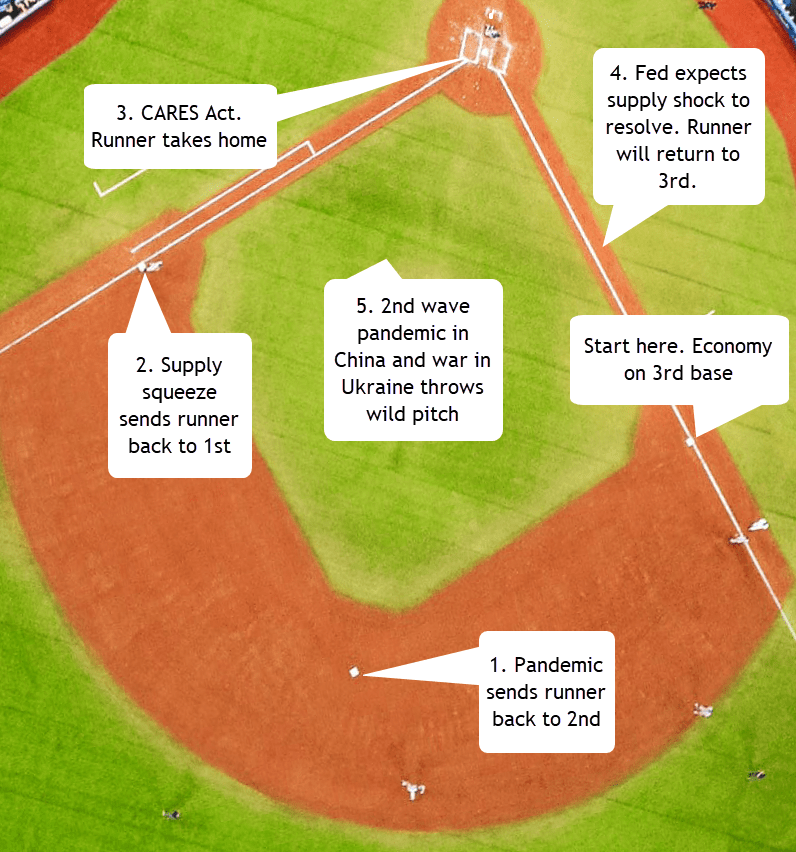
Russia’s invasion of Ukraine and China’s month-long shutdown of Shanghai factories this spring threw yet another wrench in the forecast. Families abruptly switched their spending from household to more social spending, services and travel. Airline fares increased 38% in May. The change in spending patterns caught the buying managers at Target, Home Depot and Wal-Mart by surprise and these retail outlets now have excess inventory.
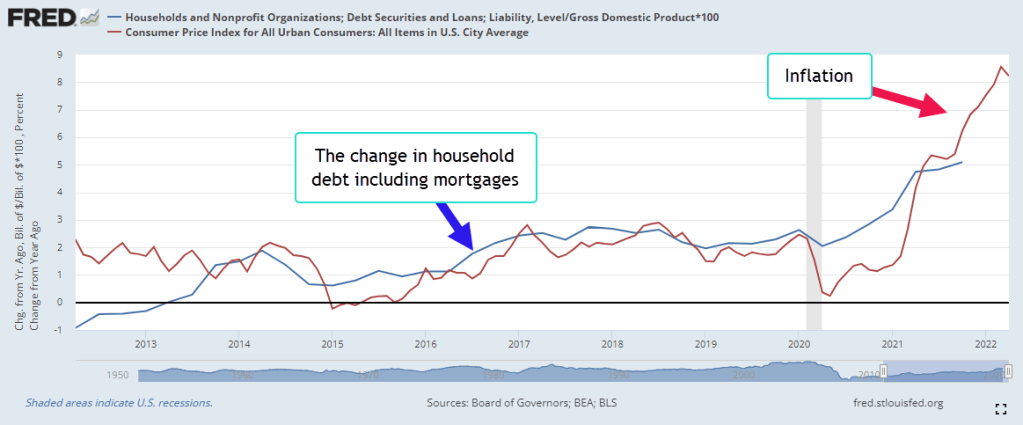
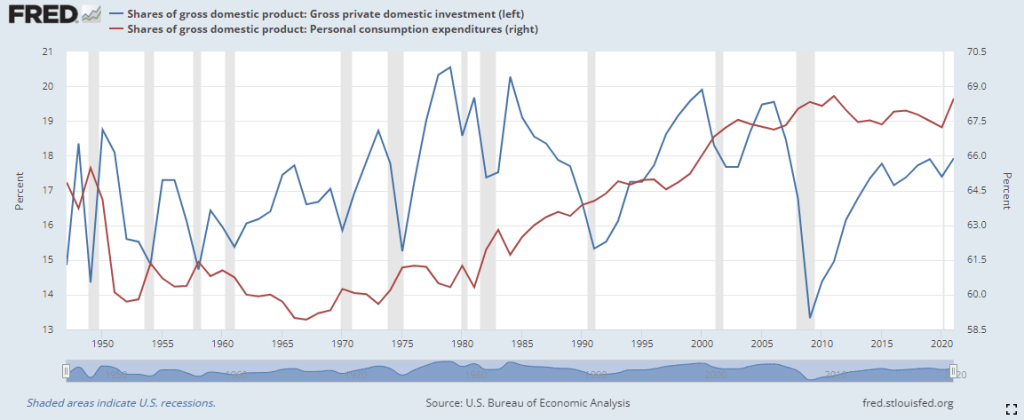
The housing market is experiencing declines as people respond to rising interest rates. The real estate giant Redfin just reported that home sales fell 10% y-o-y in May 2022, down 3% in one month from April (Ellis, 2022). Rising rates will curb the volatility in price changes but they usually cause a recession. Investment spending, both commercial and residential, responds first and that causes a decline in economic activity. Over the past few months the Atlanta Fed has revised their 2022 GDP forecast from over 2% annualized growth to 0%. Each revision has been negative.
During the pandemic, households reduced their spending and have stored up a lot of spending power. There is a lot of untapped equity in homes as well. Higher interest rates will slow residential and commercial investment spending. Inflation may stay elevated if consumption spending remains strong and offsets that decline.
////////////////
Photo by Piret Ilver on Unsplash
BLS. (2022, February 11). Relative importance of components in the Consumer Price Indexes: U.S. city average, December 2021. U.S. Bureau of Labor Statistics. Retrieved June 17, 2022, from https://www.bls.gov/cpi/tables/relative-importance/2021.htm
Ellis, T. (2022, June 17). Home sales post rare May decline as mortgage rates rise. Redfin Real Estate News. Retrieved June 17, 2022, from https://www.redfin.com/news/housing-market-may-home-sales-decline/


