November 17, 2013
This week the department store Macy’s reported sales growth that was above forecast. Same store sales rose 3.5%, about 50% better growth than expected. Macy’s attracts a higher income customer than Target, J.C. Penney or Wal-Mart. On Thursday, Wal-Mart announced that their sales had declined for a third quarter in a row. The holiday season depends on lower and middle working class folks, the kind who shop at Wal-Mart, to open their pockets. Investment firm Morgan Stanley expects this retail season to be the worst since 2008 when the country was deep in recession. (Source)
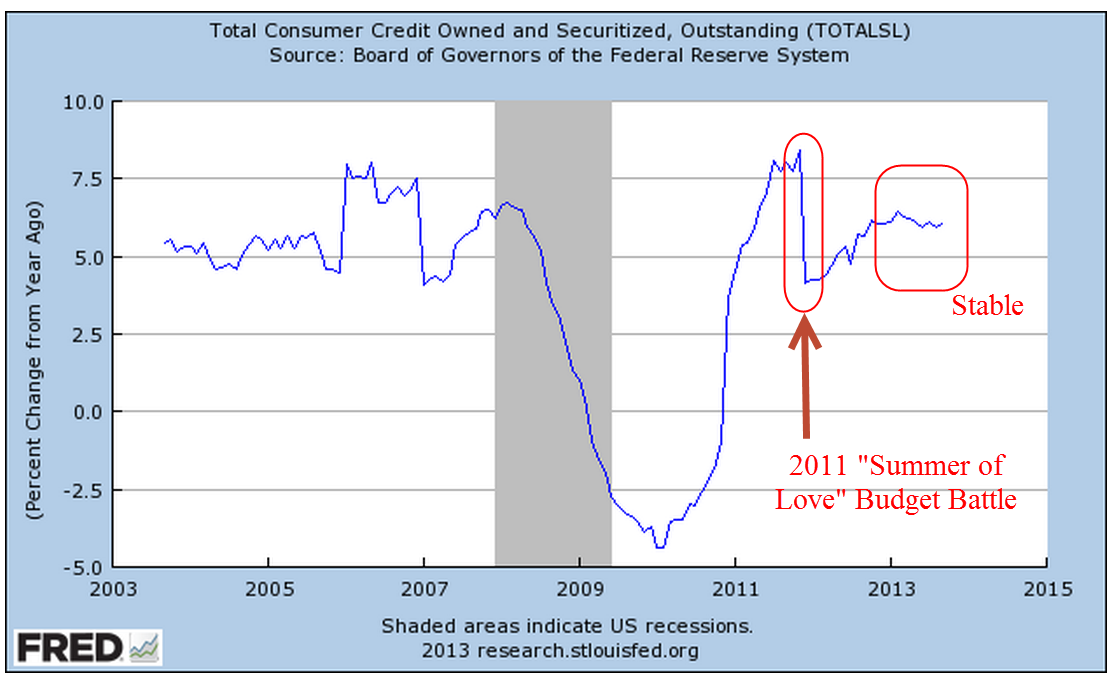
What can we learn from a bird’s eye view of the growth in consumer credit? At 5.6% year over year, it is stable.
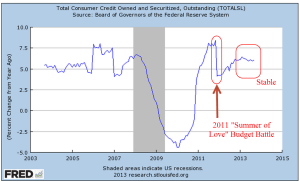
Note the response time lag in this series. The growth in consumer credit did not decline below 5% till months after the recession started. Despite the loss of hundreds of thousands of jobs in the beginning of 2008, this net job loss represented less than 1% of the work force in mid-2008. The job loss would mount into the millions but jobs are “sticky,” meaning that a downturn in the economy has a minor effect on most people most of the time. After the fact, it is easy for us to point at some chart, arch our eyebrows in a knowing glance, and say “We can see the breakdown of the economy beginning here.”
On a long term chart, we can see a reduction in growth swings over the past thirty years. Relatively flat income growth for a majority of workers has dampened the swings. While good for household balance sheets, it means that we can expect less economic volatility but also muted growth for the next decade.
Expectations for the holiday season are not reflected in the price of retail stocks. A basket of retail companies has grown about 40% this year and is up about 70% over two years. It may be time to take a bit off the table in this sector.
The Consumer Financial Protection Bureau (CFPB) was created a few years ago to act as a watchdog over the credit practices of the largest banks. On Tuesday, Richard Cordray, Director of the agency appeared before a Senate committee. He confirmed that the agency collects a lot of anonymized data on 900 million credit card accounts each month as part of its supervisory role. Questions should be raised whenever any government agency collects data on us. How is the data protected? Who has access to the data? What about my privacy?
Mr. Cordray noted that several other agencies as well as private industry collect this data. Because the data is anonymized, we are little more than a number to the agency, but there are several concerns. Federal agencies have a great deal of legal power, enabling them to get a warrant to access the data on anyone. Cordray repeatedly assured the committee that no one at the agency is interested in our personal data but left off one adverb – “now.” In the aftermath of 9-11, anti-war protestors found themselves turned away at airports or flagged for additional screening. How did federal agencies know the travel plans of many protestors? It does not take a team of FBI agents to trace the activities of any citizen when several federal agencies have our monthly financial activity at their fingertips. Secondly, there is the matter of security. How many parties does our data go through on its way to the agency? Where and at what stage in the process of data aggregation is the anonymizing done? Is our personal credit card info transmitted first to a separate third party anonymizer before being transmitted to the various agencies? Is the raw data being transmitted to an agency which then anonymizes the data using a third party program or process? In any case, it was clear that our monthly card transactions are making the rounds in both private industry and various government agencies.
The stock market continues to rise, prompting talk of a bubble. If you have access, try to read “Is This A Bubble” by Joe Light in this weekend’s edition of the Wall St. Journal. It is both informative and measured in its assessment.
In February 2012, I mentioned the Golden Cross which had occurred in late January. This long term indicator of market sentiment is a crossing of the 50 day moving average of stock market prices above the 200 day average.

Since then the market has risen about 40%. Man, if I had only taken my own advice and moved all my investments and money into the stock market! As the market continues to rise, more and more investors catch the “if only” disease and start moving money from safer investments into stocks. This is why many of us tend to buy high and sell low. Instead we should stay with the fundamentals of diversify, diversify, and lastly – diversify. A long term indicator like the Golden Cross is not a signal to dump all of our savings into stocks – unless we are in our 30s and have lots of time before we need the money. A more sensible approach is to adjust allocation upwards towards stocks and this depends on a person’s age, needs, and fears. If a person has a 50% stock allocation, with the remaining 50% in bonds and cash (I’ll leave alternate investments out for right now), that indicates a moderate tolerance for risk. They might shift the allocation to 55% stocks or 60% when they see a Golden Cross. A person who has a 70% allocation to stocks, indicating a high tolerance for risk, might start adjusting to an 85% to 90% allocation. Using this more moderate approach, a person would have lightened up their stock allocation in December 2007 when a reverse Golden Cross happened.
So what if someone has been very scared of the stock market and has only 10% of their savings in stocks? Should they move some money into the market now? That depends. If the thought of making even a slight change leads a person to lose sleep, then no. Should someone change their allocation of stocks from 10% to 50% now? That is a major allocation change and should be done using dollar cost averaging. This is a process where one takes money from one investment basket every month and puts it in another investment basket. There is also a psychological advantage to this approach. As a person’s allocation percentage becomes a bit riskier, they can adjust to the additional risk in a measured way.
Tolerance for risk is a composite of several components: psychological or emotional, future liquidity needs, age, and assets as well as income sources. Too often, people think of tolerance for risk as an emotional response only. While it is true that our emotions can cloud our measured response to risk, it is important to keep in mind that it is only one of the components.
**************
In answer to calls from his own party members, President Obama announced an administrative change to the Affordable Care Act (ACA) that allows those with policies in the individual health care market to retain their policies even if the policies don’t meet the minimum standards of the ACA. Politicians, pronouncements and podiums – stir them together and voila! The President’s pronouncement was little more than political cover at this late stage in the transition to Obamacare. Only if the states allow it and companies decide to offer the plans will an individual policy holder be able to “keep their plan,” as the President promised on numerous occasions in the past few years.
On Friday, the Energy and Commerce Committee released emails subpoenaed from CMS, the agency that administers Medicare and the ACA. The emails contradict previous testimony by both CMS head administrator Marilyn Tavenner and HHS Secretary Kathleen Sibelius that only routine problems with the healthcare.gov web site were anticipated before the launch of the web site. Ms. Tavenner testified that there were enough problems that they decided to delay the implementation of the small business plans on the web site but it appears that the problems went much further and top officials were alerted.
Henry Chao, the deputy CIO at CMS, was made aware of many major security, transactional and design problems with the web site during the summer but decided – or was pressured to decide – that the site would go live on October 1st regardless. President Obama’s repeated selling point has been what he calls “smart” government. The rollout of the federal health care website has revealed – once again – that the government in Washington has become too big and too top down to be smart, or effective. To keep their campaign coffers filled, too many in Washington must placate those companies which fund those coffers, including special favors and bailouts for the elite on Wall Street. To get the votes, they must placate the poor with programs and promises.
A conflict of interests and a clash of incentives makes most of the Washington crowd ineffective. Turn on C-Span and watch the faces of the House and Senate Budget Conference (House and Senate). These are intelligent, committed people who feel the pull of these different puppet masters, those political interests that keep them in their respective seats. Each one of them earnestly wants to fix the problem – and that is the problem. Much of the time, they are fixing the previous fixes they implemented. This approach makes Congress feel important. I would suggest that they do little more than enact incentives and let their constituents craft the solutions. Sure, the solutions will not be crafted with the superior technical expertise that Washington promises. Instead, they will emerge in a stumbling, hodge-podge way that will disenchant those who believe in the romantic notion of omniscient experts who engineer elegant solutions to social and economic problems. I hope that one day the Washington elite will let Main St. try to figure out the solutions to some of these problems. We can do better.