February 12, 2017
Republicans used to talk about the country’s debt load but such talk is so inconvenient now that they control the House, Senate and Presidency. Perhaps it was never more than a political ploy, a rhetorical fencing. Now there is talk of tax cuts and more defense spending, and a $1 trillion dollar infrastructure spending bill. 48 states have submitted a list of over 900 “shovel-ready” projects.
House Speaker Paul Ryan used to be concerned about the country’s debt. Perhaps he has been reading that deficits don’t matter in Paul Krugman’s N.Y. Times op-ed column. For those of us burdened with common sense, debts of all kinds – even those of a strong sovereign government like the U.S. – do matter. The publicly held debt of the U.S. is now more than the country’s GDP.

In 2016, the Federal interest expense on the $20 trillion publicly held debt was $432 billion, an imputed interest rate of 2.1%. Central banks in the developed world have kept interest rates low, but even that artificially low amount represents 11% of total federal spending. (Treasury) It represents almost all the money spent on Medicaid, and more than 6 times the cost of the food stamp program. (SNAP)
The latest projection from the CBO estimates that the interest expense will double in eight years, an annual increase of about 9%. The “cut spending” crowd in Washington will face off against the “raise taxes” faction at a time when a growing number of seniors are retiring and wanting the Social Security checks they have paid toward during their working years.
In the past twenty years the big shifts in federal spending as a percent of GDP are Social Security and the health care programs Medicare and Medicaid. These are not projections but historical data; a shift that the CBO anticipates will accelerate as the Boomer generation enters their senior years. Ten years ago, 6700 (see end of section) people were reaching 65 each day. This year, over 9800 (originally 11,000, which is a projection for the year 2026) per day will cross that age threshold.

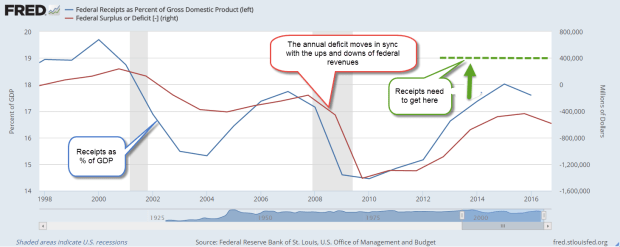
A graph of annual deficits and federal revenue shows the parallel paths that each take. The trend of the past two years is down, promising to accelerate the accumulation of debt.
More borrowing and higher interest expense each year will crowd out discretionary spending programs or force the scaling back of benefits under mandatory programs like Social Security, Medicare and Medicaid. President Trump can promise but it is up to Congress to do the hard shoveling. They will have to bury the bodies of some special interests in order to get some reform done.
[And now for a bit of cheer. Insert kitten video here.]
We already collect the 4th highest revenue in income taxes as a percent of GDP. Canada and Italy head the list at 14.5%.
South Africa 13.9%,
U.S. 12.0%,
Germany 11.3,
and France 10.9 all collect more than 10%. (WSJ) Those who already pay a high percentage in income taxes will lobby for a VAT tax to increase revenues. Income taxes are progressive and impact higher income households to a greater degree. Poorer households are more affected by a VAT tax. Cue up more debate on what is a “fair share.” Many European countries have a VAT tax and the list of exclusions to the tax are bitterly debated.
Adding even more social and financial pressure is the lower than projected returns earned by major pension funds like CALPERS. For decades, the funds assumed an 8% annual return to pay retirees benefits in the future. In the past ten years many have made 6% or less. Several years ago, CALPERS lowered the expected return to 7.5% and has recently announced that they will be gradually lowering that figure to 7%.
Each percentage point lower return equals more money that must be taken from state and local taxes and put into the pension fund to make up the difference. Afraid to call for higher taxes and lose their jobs, local politicians employ some creative accounting to avoid the expense of properly funding the pension obligations. In a 2010 report, Pew Charitable Trust analyzed the underfunding of many public pension funds like CALPERS and found a $1 trillion gap as of 2008. (Pew Report) The slow but steady recovery since then may have helped annual returns but the inevitable crisis is coming.
In December 2009, I first noted a Financial Times Future of Finance article which quoted Raymond Baer, chairman of Swiss private bank Julius Baer. He warned: “The world is creating the final big bubble. In five years’ time, we will pay the true price of this crisis.”
That warning is two years overdue. Sure hope he’s wrong but … here’s the global government debt clock. The total is approaching $70 trillion, $20 trillion of which belongs to the U.S. We have less than 5% of the world’s population and almost 30% of the world’s government debt. As Homer Simpson would exclaim, “Doh!”
Correction: Posted figure for 10 years ago was originally 9000. Current figure was originally posted at 11,000. Projected for the year 2026 is 11,000.)
///////////////////////
Market Valuation
Comments by President Trump indicating a “sooner than later” schedule for tax cuts helped lift the stock market by 1% for the week. The Shiller CAPE ratio currently stands at 28.7, just shy of the 30 reading on Black Tuesday 1929. (Graph) Since the average of this ratio is about 16, earnings have some catching up to do. Today’s reading is still a bargain compared to the 44 ratio at the height of the dot com boom. Still, the current ratio is the third highest valuation in the past century.
The Shiller Cyclically Adjusted Price Earnings (CAPE) ratio
1) averages the past ten years of inflation adjusted earnings, then
2) divides that figure into the current price of the SP500 to
3) get a P/E ratio that is a broader time sample than the conventional P/E ratio based on the last 12 months of earnings.
The prices of long-dated Treasury bonds usually move opposite to the SP500. In the month after the election, stocks rose and bond prices went lower. Since mid-December an ETF composite of long-dated Treasury bonds (TLT) has risen slightly. A number of investors are wary of the expectations that underlie current stock valuations.
The casual investor might be tempted to chase those expectations. The more prudent course is to stick with an allocation of various investments that manages the risk appropriate for one’s circumstances and goals.
