Different Measures

July 31, 2022

by Stephen Stofka

Inflation around the world is high but the primary contributors to rising prices vary by region. In the U.S., heightened demand has outpaced supply. In Europe, supply and rising costs have had the most influence on inflation. Price growth is outpacing wage growth, adding pressure to many household budgets. This week the first estimate of GDP growth in the second quarter was -0.9%, the second consecutive quarter of negative growth. Economists offered varying definitions of recession while politicians threw blame and accusations for the economic downturn. Only Japan and Germany have lower unemployment rates than the 3.6% rate in the U.S. (OECD, 2022). In the fall of 2019, Mr. Trump bragged when the rate was that low. Political messaging is founded on diversion, delusion and doubt. 

Let’s start with the inflation rate, a crucial factor in the calculation of real GDP, the headline GDP numbers that are highly publicized. The inflation rate is deducted from the quarterly growth in nominal GDP to arrive at an inflation-adjusted measure of output. The higher the inflation rate, the lower the real GDP growth rate. In the 38 developed countries that comprise the OECD, average inflation in the 2nd quarter was 9.6% and GDP quarterly growth was 0.2%, a flatline in growth. Stuck in a three decade economic malaise, only Japan had a reasonable inflation rate of 2.4%. Here are the inflation rates in a few selected countries: U.S. 9.1%, U.K. 8.2%, Germany 7.6%, Italy 8.0%, France 5.8%. The 19 countries of the Eurozone are averaging 8.9% inflation and GDP growth of 0.5%. Only 40% of OECD countries have growth greater than 1% and those countries have relatively small economies (OECD, 2022).

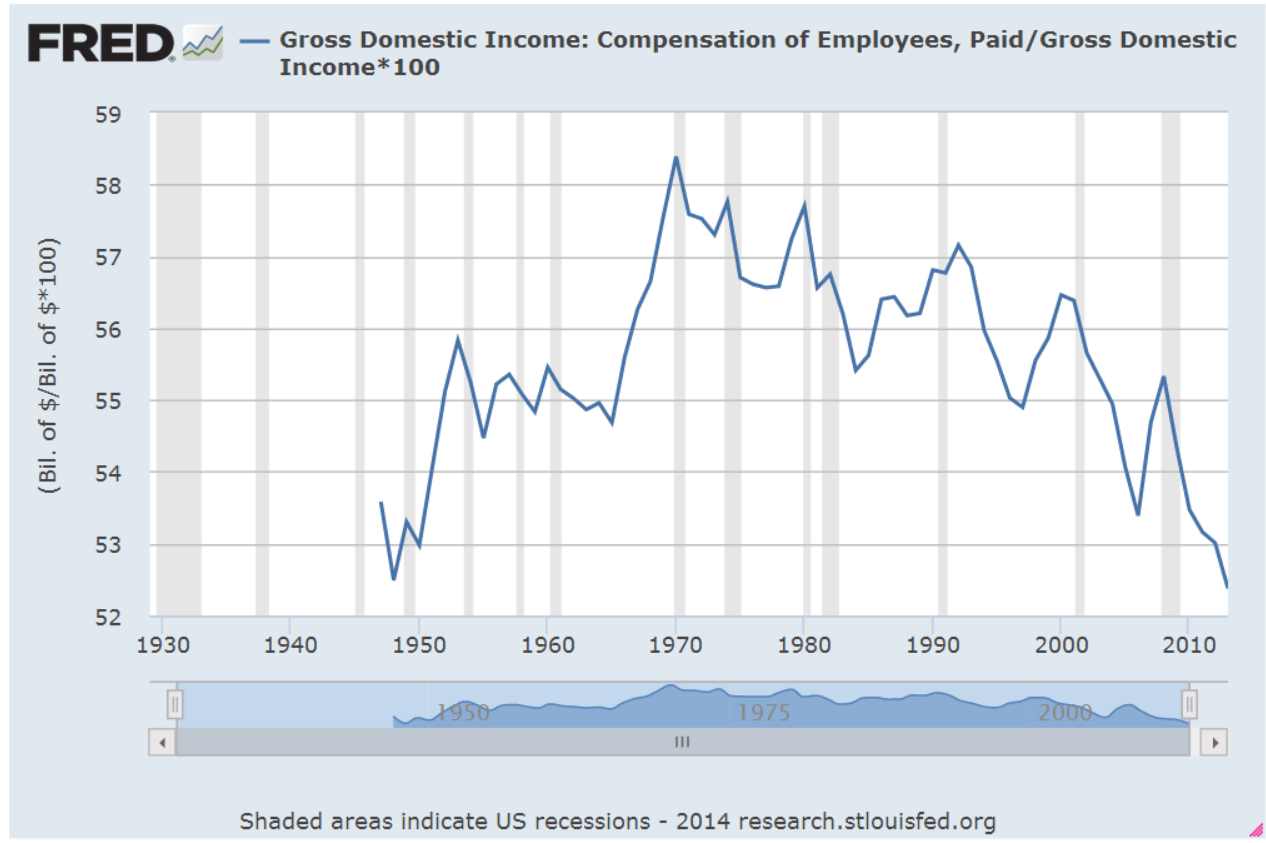
Gross National Product, GDP, is the most widely publicized measure of economic activity but there are alternative measures. GDP emphasizes production within a country’s borders regardless of ownership. If a Japanese firm owns an auto plant in Tennessee, that production is counted even though the profits are flowing to Japanese investors.

Gross Domestic Income, GDI, includes income from all American owned production around the world but would not include income to the Japanese owners of the Tennessee plant. Ford co-owns 50% of Changan Ford Automobile Corporation, Ltd. in China. GDI would include income from that production. U.S. companies have large investments around the world so GDI captures that global presence.

The two measures capture different aspects of a country’s economy. The graph below charts the quarterly growth in real, or inflation-adjusted GDP and GDI (BEA, 2022). Notice that GDI quarterly growth remained positive in the 1st quarter.  The Bureau of Economic Analysis (BEA, 2021) won’t release 2nd quarter data for Gross Domestic Income for another month. A third measure, Final Sales of Domestic Product, excludes inventory adjustments and it turned positive in the second quarter.
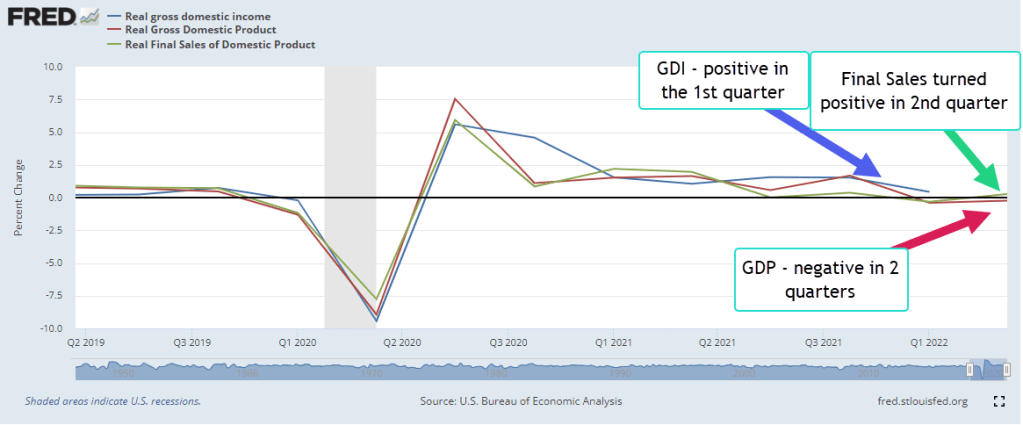
(BEA, 2022)

Major League Baseball uses high frame rate cameras to capture the second-by-second action on the field. With the advantage of multiple angles and slow motion, a review committee in NYC overturns almost 50% of disputed calls (AP, 2020). While the players and fans wait for that review, they argue the call.

In the U.S., the final arbiter of recessions is a recession dating committee at a private, non-partisan organization called the National Bureau of Economic Research (NBER, 2022). The committee requires several months to gather enough data to determine the start of a recession. They announced the start of the 2001 recession at the end of that recession. In the FAQ accompanying the announcing the committee warned that two quarters of negative growth do not always count as a recession because the committee uses monthly data (NBER, 2001). Neither the Fed nor political parties can wait for all the information. The Fed makes monetary decisions in real time. An opposition political party uses even the hint of recession in an election year to sow doubt in the minds of voters.

On June 3, 1980, five months before the Presidential election, the NBER (1980) declared a probable start to a recession in January of that year. That announcement gave Republican challenger Ronald Reagan momentum against incumbent Jimmy Carter. In 1992, as unemployment continued to rise following the 1990 recession, challenger Bill Clinton suggested that we might be headed for another recession and called for a change in leadership. In their campaigns, John F. Kennedy (1960) and George Bush (2000) suggested that the economy might already be in a recession as the election neared. Both called for a change in leadership. This year Republicans will run on economic issues conveniently summarized with one word – inflation and recession. Democrats can highlight historically high employment gains and a low unemployment rate and will certainly run on individual rights.   

In baseball, the MLB central review office makes the final call on disputed calls. In national accounting, the recession dating committee at the NBER makes the determination of the start and end of recessions. In disputed decisions among lower courts, the Supreme Court makes the final determination and rule. In presidential elections, the electoral college makes the final call. We may not like the calls but we agree to live by them. Following the 2020 election, former President Trump and his allies broke that agreement and on January 6th tried to overturn the final call by violence. There’s a single word for that – coup.

///////////////////

Photo by patricia serna on Unsplash

AP. (2020, July 21). MLB doubles camera angles for video reviews of umpires. Tampa Bay Times. Retrieved July 29, 2022, from https://www.tampabay.com/sports/rays/2020/07/21/mlb-doubles-camera-angles-for-video-reviews-of-umpires/

BEA. (2022, June 29). Gross Domestic Income. Gross Domestic Income | U.S. Bureau of Economic Analysis (BEA). Retrieved July 29, 2022, from https://www.bea.gov/data/income-saving/gross-domestic-income

U.S. Bureau of Economic Analysis (BEA). (2022). Real gross domestic income [A261RX1Q020SBEA], retrieved from FRED, Federal Reserve Bank of St. Louis; https://fred.stlouisfed.org/series/A261RX1Q020SBEA, July 29, 2022.

U.S. Bureau of Economic Analysis (BEA). (2022). Real Gross Domestic Product [GDPC1], retrieved from FRED, Federal Reserve Bank of St. Louis; https://fred.stlouisfed.org/series/GDPC1, July 29, 2022.

U.S. Bureau of Economic Analysis (BEA). (2022). Real Final Sales of Domestic Product [FINSLC1], retrieved from FRED, Federal Reserve Bank of St. Louis; https://fred.stlouisfed.org/series/FINSLC1, July 29, 2022.

NBER. (1980, June 3). Business cycle dating committee announcement June 3, 1980. NBER. Retrieved July 29, 2022, from https://www.nber.org/news/business-cycle-dating-committee-announcement-june-3-1980

NBER. (2001). Business cycle dating committee announcement November 26, 2001. NBER. Retrieved July 29, 2022, from https://www.nber.org/news/business-cycle-dating-committee-announcement-november-26-2001#:~:text=of%20this%20memo.-,FAQs,the%20recession%20in%20March%202001.

NBER. (2022). US business cycle expansions and contractions. NBER. Retrieved July 29, 2022, from https://www.nber.org/research/data/us-business-cycle-expansions-and-contractions

OECD. (2021, May 25). OECD welcomes Costa Rica as its 38th member. OECD. Retrieved July 29, 2022, from https://www.oecd.org/newsroom/oecd-welcomes-costa-rica-as-its-38th-member.htm

OECD (2022), Inflation (CPI) (indicator). doi: 10.1787/eee82e6e-en (Accessed on 29 July 2022)

OECD (2022), Quarterly GDP (indicator). doi: 10.1787/b86d1fc8-en (Accessed on 29 July 2022)

OECD (2022), Unemployment rate (indicator). doi: 10.1787/52570002-en (Accessed on 29 July 2022)

Years Past

December 31, 2017

by Steve Stofka

This past week, I found a July 2008 Wall St. Journal used as shelf liner. On the eve of 2018, a look back has some useful reminders for a casual investor.

Journal20080703

Most of us remember the financial crisis that erupted in September 2008. What we may not remember is that the first half of that year was very volatile. In reporting about the first half, there were “warnings of the collapse of the global financial system.”

In the first six months of 2008, 703,000 jobs had been lost. The job losses continued until March of 2010 and totaled a staggering 8 million. In early July 2008, the stock market had lost 16% from its high mark in October 2007 but a balanced portfolio of 60% stocks and 40% bonds had lost only 8%. To prepare for a difficult second half of 2008, investors were cautioned to:
1) Balance
2) Diversity
3) Spend less and invest more
4) Don’t pay high investment fees
5) Don’t get greedy and chase get rich investments

The advice is timeless.

/////////////////////////

Tax Reform

In a holiday week, thousands of residents in coastal states lined up at their local tax assessor in order to pre-pay 2018 property taxes in 2017.  Most of these residents have annual property taxes that exceed the $10,000 cap on all state and local taxes that can be deducted on 2018 Federal taxes.

The IRS said that they would not allow deductions for prepaid taxes unless the local district had assessed the tax by December 31, 2017.  We may see lawsuits over the definition of the word “assess.” When is a homeowner assessed a property tax?  When they receive a bill?  When the district announces the rate for the following year?

In their battle against the IRS, Republicans have cut the agency’s funding so much that the IRS does not have the resources to perform audits on several hundred thousand to determine the status of assessment.  The courts will likely weigh in on the question.  Come next November, voters will register their opinions.

The New York Times featured a several question calculator  to estimate the effect of the tax bill on your 2018 taxes.

///////////////////////

Income

Economists have noted the decades long decline in inflation-adjusted wages.  Since 1973, the share of national income going to wages and salaries has declined by 14%.

WagesSalariesPctGDI

Employee benefits as a percent of gross domestic income have grown by a third since the 1970s. Of course, a person cannot spend benefits.

BenefitsPctGDI

Even after the increase in benefits, total income is down. In 1973, 50% of Gross Domestic Income (GDI) went to wages and salaries + 7.5% to benefits for a total of 57.5%. In 2016, 42% went to wages + 10% to benefits = 52%.  Total compensation is down 10%.

As the wealth of the affluent continues to grow, the ratio of net wealth to disposable income has reached an all-time high.

WealthPctInc
It is inevitable that extreme imbalances must revert to mean.  The last two peaks preceded severe asset repricings.

Follow The Money

June 14th, 2014

This week I’ll take a look at some near-term trends in small business, labor, oil and housing and a few long-term trends in income and debt.

***********************
Small Business

Huzzah, huzzah!  The monthly survey of small business owners by the National Federation of Independent Businesses (NFIB) broke through the 96 level after cracking the 95 level last month.  Sentiment has not been this good since mid-2007.  Hiring plans have been on the rise for the past several months and owners are reporting rising sales.

**********************

JOLTS (Job Openings and Labor Turnover Survey)

The Job Openings report from the Bureau of Labor Statistics (BLS) has a one month delay so the data released this past week was for April.  The number of job openings was 40,000 higher than expected, coming in close to 4.5 million.  As a percent of the workforce, job openings are approaching pre-recession highs.

The decline in construction job openings is a disappointment.  We are near the same level as 2003, a weak year of economic growth.  We should expect to see an uptick in job openings in next month’s report, confirming that projects put on hold during the severe winter in the eastern part of the country are again on track.  Further declines would indicate a spreading malaise.

************************

Gross Domestic Income

On a quarterly basis Gross Domestic Income, GDI, and Gross Domestic Product, GDP, differ somewhat but over the long run closely track each other.  Following up on two previous posts on Thomas Piketty’s book Capital in the 21st Century, I wondered what percent of GDI goes to pay employee compensation.  As we can see in the chart below, total compensation for human labor has been dwindling to post WW2 levels.

This is total compensation, including benefits.  Wage and salary income as a percent of total national income has declined steadily.

As a percent of total income, employee benefits have more than tripled since the end of World War 2 and now comprise more than 10% of the country’s income.

Demographic shifts have contributed to the decline of labor income.  The post war boomer generation, 80 million strong and 25% of the population, contributes to the trend as they save for retirement. As capital gains, interest and dividend income increase, this reduces the share of wage and salary income.

Economic changes have been a major factor in the decline of labor income.  Capital investments in technology, both in hardware and software, have reduced the need for labor for a given level of production.  Capital investment demands income to pay back the investment. For most of the 20th Century, machines replaced human muscle in farming, manufacturing and construction.  In the past two decades, machines are increasingly replacing mental muscle.

How we count labor income has changed.  Tax law changes in 1986 and 1993 reduced the amounts that are included as compensation but the overall effect of these changes is relatively minor.

If we divide the country’s total employee compensation by the number of employees, we might ask “What recession?”  Average annual compensation has climbed from $38-54K in a dozen years.  That’s almost a 50% raise for every employee!

Of course, everyone has not had a 50% increase in income over the past 12 years.  Human capital, the educational and technical training that an employee has to offer, has earned an increasing premium in the past three decades. Those with more of this capital have captured more benefit from the dwindling pool of labor needed for the nation’s production.

Average disposable income tells a more accurate story of the majority of people in this country.  Disposable income is what’s left over after taxes.  The trend is downward.

How do we cope with flat income growth?  Charge it!  It’s the Amurikin way! Per capita Household Debt has increased 75% in the past 13 years.  After a decline from the rather high levels before the recession began in late 2007, per capita debt has leveled off in the past two years.

Rising house prices and stock market values have increased net worth.  As a percent of net worth, household debt has declined to the more sustainable levels of the 1990s.

The percentage of disposable income needed to service that debt is at thirty year lows, meaning that there is room for growth.

In response to the hostilities in Iraq, oil prices have been on the rise.  Historically, a rise in oil prices leads to a rise in prices at the pump which takes an extra bite out of disposable income and puts a damper on consumer spending growth.

***********************

Oil Prices

A blog by Greg McIsaac at the Washington Monthly in May 2012 presents an interesting historical summary of oil prices and production.  The American love of simplicity leads many to credit one man, the President, for the rise and fall in gasoline prices, although the President has little, if any, influence on oil pricing. McIsaac notes The combination of lower energy prices and increased energy efficiency in the 1980s reduced US expenditures on energy by nearly 6 percent of GDP.  Deregulation of energy prices begun under the Carter Administration were largely credited to the Reagan administration.   He writes “crediting Reagan with falling energy prices of the 1980s exaggerates the roles of both Reagan and deregulation and obscures the larger influence of conservation and increased production outside the US.”  Production actually fell for several years after regulatory controls were lifted.

Further increases in oil prices will no doubt be blamed on this President.  The one thing that each outgoing President bequeaths to the newcomer before the inauguration is the Presidential donkey suit.

***********************

Housing

Redfin Research Center reports a sharp decline in the number of houses sold through May. After a 7.6% year-over-year decline in April, home sales slid 10% from May 2013 levels.  Real estate agents are reporting a shift from a seller’s market to a buyer’s market.

***********************

Takeaways

Small business accounts for approximately 60% of new jobs and optimistic sentiment among small business owners is growing.  The labor market continues to show continuing strength in the number of job openings and a decline in new unemployment claims.  Disposable income growth is flat but the portion of income needed to service debt is very low.  Rising oil prices and a slowing housing market will crimp economic growth.
Next week I’ll look at a complex topic – is the stock market fairly valued?  

Things That Spring

April 14th, 2013

Across the land, springtime wakens the trees and flowers, birds chirp and squirrels chatter.  From the buildings where the humans live comes the wailing and gnashing of teeth as many procrastinators spend this last weekend before the tax deadline in a spring ritual of angst.  The lost W-2 form is finally found beneath the Netflix DVD that has lain casually on the bookcase, waiting to be watched.  The 1099DIV form is found beneath a birthday card that was never sent.

Lay aside your problems; let’s climb inside the hot air balloon and look at the big picture.  A few weeks ago, economic growth for the fourth quarter of 2012 was revised marginally higher into positive territory, but dropping from the annualized growth rate of 3.1% in the 3rd quarter of 2012.  Let’s look at GDP from a per person basis since WW2.  Until the recession hit in late 2007, economic growth had consistently outpaced population growth.  Then POOF! went the economy and blew away a big gap in GDP.

Let’s zoom in on the past ten years to see the effect.  On a per person basis, the gap is $5,000 of spending that simply didn’t get spent.

Call it the GDP dust bowl of the 2000s, similar to the dust bowl of the 1930s when the wind blew the top soil from the prairie of the Oklahoma panhandle and forced many families from their farms.  In this case, the wind blew away a lot of jobs and chunks of home equity.

Policy makers in Washington want to close that $5000 per person gap.  If they could write a law forcing everyone to spend that $5000, they would.  Instead, they keep giving away money in unemployment benefits, food stamps, disability benefits, crop subsidies – all to keep people from not spending even less and making the problem worse.

Retail sales account for about 1/3rd of the total economy.  Including automobile sales and parts, consumers are still below twenty year averages.

This past Friday, the monthly report on retail sales showed little change from the past month.  When we look at per person real retail and food sales and take out automotive sales we get a feel for core sales, those that we make on a frequent basis.  Once again, we see the same gap that we saw in GDP.  Since mid-2009, this core consumer spending has grown 2.3% annually, above the 1.8% annual growth trend from 1992 through 2006, but it still down $2000 a year from what we would have spent if we had stayed on the same trend line before this past recession hit.

To make it a bit clearer, let’s look again at that chart and compare the 15 year annual growth rate from 1992 to the longer 21 year growth rate.  It has fallen from 1.8% to 1.1% annual growth.

GDP measures spending; let’s look at Gross Domestic Income, or GDI.  A fundamental principles of economics is that it takes money to spend money.  A six year old asks a parent “Why can’t we just go out and get more money?” to which the parent replies “Whaddya think money grows on trees?!”  End of Chapter One in the Parent’s Guide to Economics.

When we compare the country’s income to spending, we find that a dip in income below production precedes recessions.

After the 2008 – 2009 crash and recovery in national income and spending, both are limping along.

A few weeks ago came the monthly New Orders, an indication of business confidence.  As regular readers know, I have been watching this declining trend since September of last year, when the percent change in New Orders was negative.  The recent rise has been a welcome sign of growing confidence but new orders fell 2.7% in February and now hover around the zero growth line. 

On a quarterly basis, the year over year (y-o-y) percent change is still firmly in negative territory, meaning that businesses are not putting up more money to invest in new equipment.  Why?  Because they are still not sure about consumer spending. The six month run up in the SP500 stock index might lead a casual observer to think that the economy and companies are gearing up.  New Orders indicates that there is much more caution out there than the stock index would indicate.

This past Friday, business’ caution to commit to new investment was only reinforced when the latest Consumer Sentiment index was released.  After climbing the past few months, confidence is sinking again.  Maybe it’s the extra 2% coming out of paychecks since January 1st.  Whatever it is, it doesn’t inspire many business owners to put a lot of money into expanding their production.

When the stock market is trading on hope, it looks six months ahead.  The recent run up is hoping for double digit profit growth in the second half of this year.  When the market trades on fear, it looks ahead about 2 seconds, faster than the normal investor can or should react.  Let me get out my broken record for another spin, cue the needle and play that same old song “Diversify.”

P.S. For those of you who are more active investors, check the latest post from Economic Pic in my blog link list on the right.  It shows the past 40 year returns for a strategy of selling the SP500 index in May and buying the long term government / credit index.  The iShares ETF that tracks this index is ITLB.  A comparable ETF from Vanguard is BLV.