An Explosion of Events

October 4, 2020

by Steve Stofka

This has been a week of surprises. Sunday night, the NY Times released the details of President Trump’s tax documents which he has sought to keep hidden under the pretense that an IRS audit prevents him from doing so. We learned that Mr. Trump’s wealth is a ruse, like that of Bernie Madoff. We discovered the reason for the IRS audit: a $72 million refund that Mr. Trump was paid in 2009 under a dubious interpretation of rules in the Recovery Act following the 2008 financial crisis.

The report contains many instances of rule bending if not outright fraud. It serves as an example of why Republicans have repeatedly cut funding for the IRS. With fewer people, the IRS is unable to monitor the shenanigans of Mr. Trump and his accountants.

The last two decades have seen the largest accounting scandals, and most of them happened while Republicans controlled the majority if not all of the federal government. Enron, Tyco and Health South in the early 2000s were just the prelude to the 2008 financial crisis. The Enron scandal exposed the misdeeds of one of the largest accounting firms in the world, Arthur Anderson, who was forced to surrender their license in 2002. During these past twenty years, Republicans have consistently fought to undermine the mission of all government monitoring, to bend the rules in favor of large industry. Mr. Trump called us working stiffs suckers for paying taxes.

On Tuesday’s debate between both Presidential candidates, Mr. Trump’s interruptions broke debate protocol and the rules he had agreed to. That’s not a surprise. He is a notorious cheater at golf and has a motor mouth. He is an entertainer, not a statesman or a gentleman. The surprise was that Mr. Biden met the verbal assault without fluster. Afflicted with stuttering since he was a child, Mr. Biden has learned to speak with deliberation, a common strategy taught to stutterers. Kids around the country, watch Mr. Biden. This is how you stand up to bullies.

The announcement late Thursday night that Mr. Trump had tested positive for Covid surprised those of us who wondered how the disease had not caught up to the President, who has played the tough guy and pooh-poohed caution. Mr. Trump has several comorbidities, his physician said, without being specific. A lack of prudence might be one of them. Several hours later, Mr. Trump was taken to Walter Reed hospital out of “an abundance of caution.” With a month left before the election, Mr. Trump had a busy election schedule, which is up in the air for the next two weeks, at least. More on that at the end of this post.

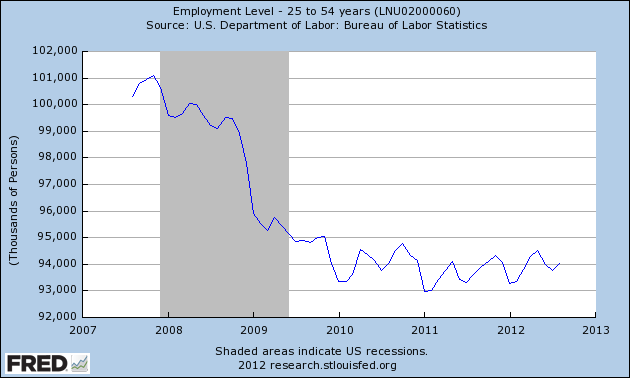
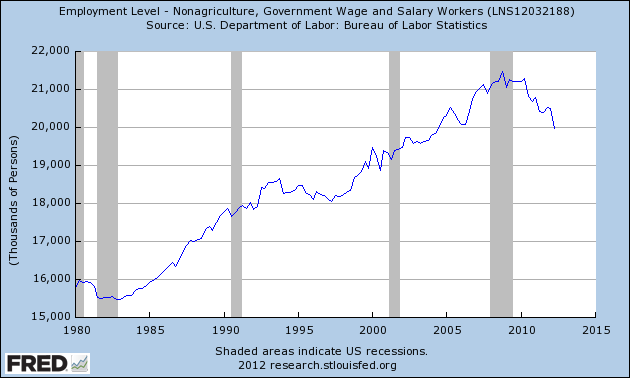
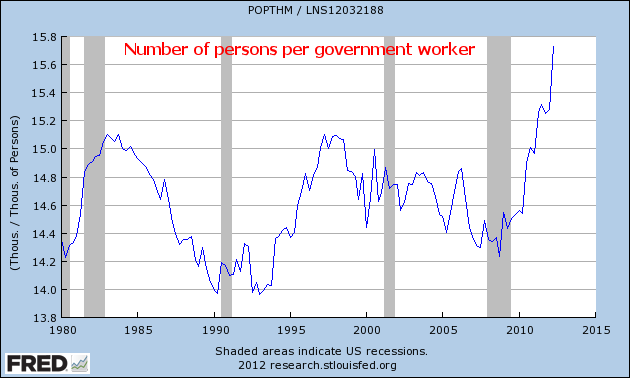
The surprise in Friday’s monthly hiring report was the weak job recovery. The employment population ratio is 56.6%, significantly down from 61% in February, before Covid. In February, 1.5 people working supported each person not working, including children. Now it is 1.3 people supporting each person not working.

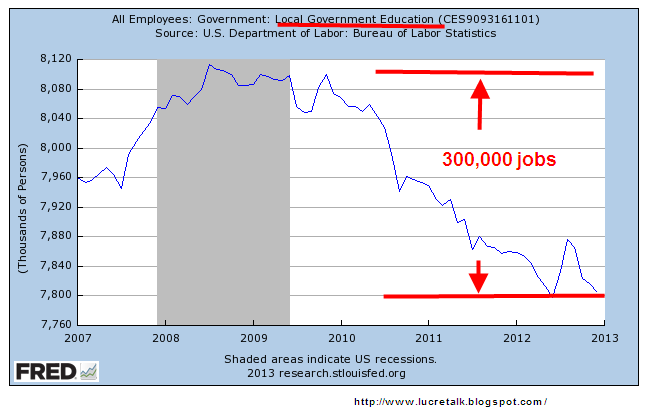
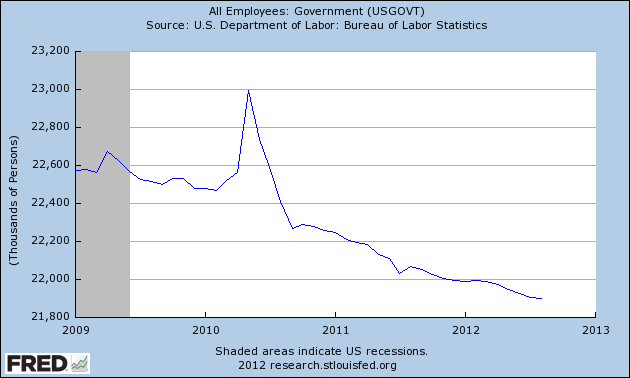
The growing debt of the Federal government has relieved some of the burden on workers, because, in times of crisis, the rest of the world wants to buy U.S. Treasuries. State and local governments are squeezed. Governments laid off 216,000 workers in September. Who will they turn to except the Federal government? Senate Republican Leader Mitch McConnell balks at aid to the states, particularly the “blue” states.

In the past weeks, airlines and other industries have been announcing permanent layoffs. Older people may be taking early retirement. The four industries that have not suffered during this crisis are utilities, consumer staples, technology and health care. The effect of tech on the stock market has been dramatic. The SP500, weighted by market cap, is up 7% since January. An evenly weighted SP500 index is down 17%. That reflects a general economic misery.  

The week was still not done. On Saturday, we learned that the President had known earlier that he had Covid. He met with prominent Republicans and did not tell them he had the disease. Former NJ governor and campaign advisor Chris Christie has now tested positive for the disease. Mr. Christie is younger but is obese, the chief co-morbidity leading to death. Kellyanne Conway, Mr. Trump’s White House advisor, has also tested positive. The White House is doing a trace of all people who came into contact with Mr. Trump. He hates his enemies, but he doesn’t spare his friends either.

//////////////

Photo by Jens Johnsson on Unsplash

Laboring But Not Delivering

January 6th, 2013

No change in employment picture.  Same old, same old.  Go back to sleep.

Although the main message of the latest BLS monthly employment survey is little or no change, there are some interesting trends we can look at.    First the ho-hum stuff – stay with me for a paragraph or two.  Job gains of 155,000 this past month was essentially the average of the past twelve months; it is enough just to keep up with population growth.  The unemployment rate, number of jobless, long term unemployed, participation rate, employment-population ratio and number of involuntary part-timers all were essentially unchanged.  Can’t get more sleepy than that – but stable.

Health care employment continues to zoom upwards, gaining 45,000 this month and averaging over 28,000 monthly in 2012.  Over 2/3rds of the gains this month were in ambulatory care and nursing homes.

We are eating and drinking out at about the same pace as we did in 2011.  Food services and drinking places added an average of 24,000 workers per month this year, same as the previous year.

20% of the job gains this month were in Construction but the industry is still flat.

Now here comes the interesting stuff.  Bill McBride at his Calculated Risk blog for this past week has a chart of job recoveries after recessions.  This blog  is one I read regularly and is on my recommended blog list.  Check it out if you have not already done so.

The graph is measuring the job losses from a previous peak; in the past two recessions those employment peaks before the recession took hold were largely caused by bubbles in tech and real estate.  I wanted to get a more reasonable baseline to measure change.  Below is a 75 year graph of the rolling five year average of employment in this country.  It dramatically shows just how weak the job market has been – depression era weak.

What surprised me in this past month’s report was the further loss of 13,000 jobs in the government sector.  I was expecting few job losses, even perhaps a small gain.  When we look a little closer, it gets interesting.  Since the beginning of 2010, 300,000 teachers, administrators and other workers in local government (these are primarily K-12 schools) have been laid off.

We would expect at least some layoffs at the state education level, which consist mostly of colleges, including community colleges, and universities.  Not so.  Employment has continued to rise.

As property valuations have decreased, so have the taxes based on those valuations.  The states have taken their share of the taxes and left local county, city and village authorities to wrestle with the budget challenges.  Many K-12 teachers have been laid off as a result.

Now I’ll look at some cautionary signs.  Professional and Business Services has seen fairly strong employment gains and employment in this area has reached its prerecession peak.

There is one subcategory, Employment Services, that can often serve as a harbinger of weakness or downturn.  These are the guys whom companies hire to do the hiring.  When employment at these services weaken or fall, there may be something going bad in the fridge.

Another employment indicator is the maintenance and service of buildings.  When stores, industrial spaces and office buildings are vacant or slow, there is less to do.  Doing business takes some wear and tear on buildings.  Less business, less wear and tear.

This a truly historic downturn in both the economy and employment.  The lack of reliable, or at least comparable, data during the 1930s depression and earlier severe recessions make it difficult to do a proper assessment but we can say – to use a technical term – its a doozer.  When I hear someone comparing this recession to the 1980s and advocating, with the assertive crystal clarity that only the uninformed can summon up, that the same policies that got us out of the recession of the early 1980s will get us out of this extended recession, I know I am listening to a fool.  When I hear someone firmly pronounce that pumping vast amounts of federal money into the economy, the tactic tried with arguable success during the 1930s Depression, will solve the problem, that is the chatter of another fool.

Labor Report – August Doldrums

This past Friday, the Bureau of Labor Statistics (BLS) released their monthly report for August and the employment gains of 96,000 were below the already muted expectations of 120,000 jobs gained.  Many economists estimate that it takes 150,000 jobs per month just to keep up with population growth.  On the day before the BLS report, the large payroll processing company, ADP, released their estimate of 201,000 private job gains in August, leading some to speculate that total job gains for the month would be above 150,000.  As you can see below, the BLS and ADP counts of private employment closely track each other. (Click to enlarge charts in a separate tab)

On Thursday afternoon before the Friday morning release of the BLS report, the White House is notified of the numbers.  The disappointing numbers may have led President Obama to tone down the rhetoric of his speech that evening at the Democratic National Convention.  He did not seem to have the “fire in the belly” when he delivered his acceptance speech.  The unemployment rate ticked down from 8.3% to 8.1% because 368,000 dropped out of the work force and are no longer counted as unemployed.  Some of this number retired, either voluntarily or involuntarily.  Some have simply become discouraged.  Some have gone back to school.  The average number of weeks of unemployment is still at high levels. 

Some of this is due to changes in BLS reporting since Obama took office.  Before January 2011, the BLS allowed a maxiumum of 2 years, or 104 weeks in their survey.  Starting in 2011, the BLS allows a maximum of five years, or 260 weeks.  Since a small number of unemployed forces the average number higher, the BLS recommends using the mean for comparison. (BLS Source

Most of Europe is in recession; growth in South America, China and India have slowed.  Several strong economic reports in the winter and spring of this year led many to think that the U.S. economy might be less tethered to this global malaise.  The stock market rose over 10% in the first few months of 2012; then China reported contracting manufacturing and real estate sectors, and European leaders showed their continued inability to resolve the fiscal and monetary policy challenges that threaten to crack the European Union.  We realized that we were not immune to the global financial flu and the stock market fell 10% in May, wiping out the gains of the winter and spring. The monthly employment gains dropped during the summer.

Recent employment and industrial reports have showed that our growth, while still positive, is struggling.  Private job growth has been hampered by the layoffs of government workers, as the chart below shows.

The shedding of government jobs halted this past month as Federal employees actually gained about 3,000.  Those on the left have criticized the Republican House for aggravating job losses in state and local governments by blocking any further federal aid to the states.  A comparison with the first term of the Reagan administration shows a similar decline in government employment during the 1981 – 1982 recession.  However, following the end of the recession, government employment increased in the last two years of his first term and helped Reagan get elected to a second term.  The Democratic House was kinder to Reagan than the current Republican House is to Obama.

The slow growth of the past several months has fueled speculation that the Federal Reserve will once again come to the rescue with a bond buying program.  Since the beginning of June, the stock market has “melted up” on very low volume.  Once again, it is at the peak reached earlier this year and in 2007 before the recession began.

The uninspiring lack of job growth among what I call the core labor force, those aged 25 – 54, is a predictor of a sluggish economy in the near future.  These workers buy a lot of stuff. No jobs, no stuff.

The larger group of adult workers, those aged 25 plus, continues to show gains, indicating that older workers are continuing to keep and get jobs.  The old are simply not making way for the young.  Severe declines in house values and the loss of value in their retirement funds has forced many older workers to continue working longer than they may have planned.  Older workers do no buy a lot of stuff.

During the 2010 elections, Republican candidates for the House promised that job programs would be first priority.  We have been waiting two years.  Both houses of Congress have historically low voter approval ratings yet the burden of the sluggish job growth continues to fall on the President’s shoulders.  Politicians on the Republican side of this dysfunctional Congress point to the President as the cause of the muddle through labor market; they know most voters can’t remember what they learned in civics class in grade school and don’t understand that it is Congress, not the President, that initiates legislation.  It is Congress, both Democrats and Republicans in the House and Senate, that is responsible for the lack of job growth.  Who elected these men and women to the Congress?  Look in the mirror.  That’s who’s responsible for the slow job growth. 

Government Unemployment

Since the beginning of 2010, approximately 1.3 million government workers have lost their jobs.  Most of these jobs are at the state and local levels and have affected women more so than men.

The initial payouts from the stimulus bill passed in the spring of 2009 went to state and local governments to help them cope with declining tax revenues.  This federal support (all of it borrowed) helped to soften the effect of the recession on women earners, leading some observers to call the recession a “mancession”.  The unemployment rate for men shot up far above that for women.


As stimulus spending declined in 2010, government workers, particularly teachers, lost their jobs as state and local governments made hard choices to balance their budgets. 

Have they gone too far?  Below is the ratio of total population served by each government worker and it is at a historic high.

Each government worker is “servicing” one extra person more than the thirty year average of just under 15 people per worker.  Second only to the law of gravity is the law of averages; we will return to average, resulting in an increase in government jobs.  Politics is a bloodsport.  In the coming years, Republican politicians in office will take credit for the inevitable addition of these government jobs as the “result of our pro-growth policies” when it is anything but.  The reality is that Republican political leaders and strategists wanted to choke off funding for government jobs while the other party was in power.  The individual carnage of unemployment serves the aims of those desiring political power.  Should Republicans take the Presidency and make gains in the Senate in the upcoming elections, they will stuff their rhetoric about limited government in their pockets, then  announce that – surprise, surprise – the job cuts at the state and local levels have been too much.  The spending spree will continue.

Government Employees

As federal, state and local programs, agencies and bureaucracies grow, so too do the employees at the various levels of government.  In 1950, the population of the U.S. was 152 million, according to U.S. census data compiled by Data360.  In 2006, the population was 301 million or about double.  In 1950, the total government civilian workforce was 6.4 million, or a ratio of 1 government worker to 24 people.  In 2006, the total government workforce had grown to almost 20 million, a threefold increase and a ratio of 1 worker per 15 people.  The government employee growth rate of 1.5 times the growth rate of the population has occurred despite the efficiencies of computerization and communication and reveals the ever larger presence that government plays in our lives.

With about half of the population of working age, the ratio of 15 people to 1 government civilian worker means that about 7 people support each worker. The Census Bureau estimates the U.S. population at 367 million in 2030, an increase of 22%.  If the government workforce increases at the same 1.5 times the population growth rate, government employees will total more than 26 million in 2030, so that it will take one government worker to service 14 people.

What does not appear in the government employee totals is the increase in outsourcing of tasks that used to be done by government employees, a pattern that clearly emerged by 2000.  From 1996 to 2006, there was little change in the number of government employees.  Some of this was due to computerization but we can only guess at the number of federal, state and local jobs that were outsourced to private companies.  What is the true ratio of population to government worker?  Perhaps 13 to 1?

Some people and politicians clamor for more programs, more regulation, and more in general from government.  When is it enough?