The Magical Beast

February 23, 2025

by Stephen Stofka

This is second in a series on centralized power. I decided to use a more conventional narrative rather than the debate format of previous posts. Research on this topic upset my “apple cart” of preconceptions regarding spending, taxes, and Republican support for some social programs. I survived.

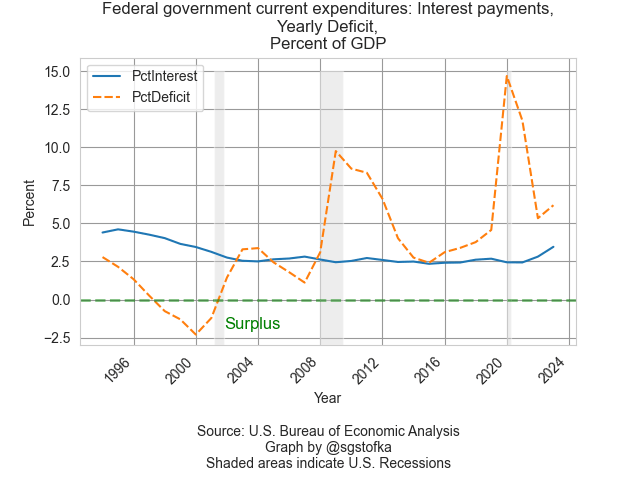
Proponents of smaller government aim to restrain the growth of government spending by reducing tax revenue. In a 1981 Address to the Nation shortly after taking office, President Ronald Reagan first proposed the idea. If Congress would not cut back spending, then reducing tax revenues would force them to cut spending. As many political leaders did, Reagan assumed that the public would not tolerate the nation running large fiscal deficits. For most of the eight years he was in office, government spending stayed fairly constant at about 22% of GDP and the federal deficit remained at the same percent of GDP as during Jimmy Carter’s term. After 9-11, the public’s tolerance for deficits grew. The feckless Bush administration promised that Iraqi oil production would pay for the costs of invading the country. In 2003, the Republican Congress passed tax cuts and Bush won reelection despite the many failures of the Iraqi invasion. This time, he did so without the help of the conservative justices on the Supreme Court. It was the last time a Republican would win the popular vote until the election of Donald Trump in 2024.

A 2006 analysis by Christina and David Romer found little support for the Starve the Beast hypothesis and suggested that lowering taxes may, in fact, increase spending. In a 2006 paper, William Niskanen, former head of the Cato Institute, found that spending and tax revenues moved in opposite directions. One of the pathways for this phenomenon may be that taxpayers come to disconnect the two forces, taxes and spending, and don’t hold politicians responsible. For a politician, cutting taxes is a popular brand but they keep their seats by “bringing home the bacon” for their constituents. A farming community does not want to see decreases in crop subsidies or favorable tax breaks. Voters magnify the burden of spending cuts, feeling as though they are shouldering more of the burden than other voter groups.

In his second term, Donald Trump has adopted a different approach – kill the beast. Readers of William Golding’s Lord of the Flies will remember the scene where a mob mentality overtakes a group of shipwrecked boys and they start a feverish chant after a hunt, “Kill the pig, spill its blood.” The cuts that Musk and his DOGE team are making on the federal work force resemble less the precision of a surgeon and more the frantic swinging of a knife in the dark. They have targeted recent hires with few job protections and paid little attention to what those workers do. In their zeal to kill or wound the bloated government – the beast – they have laid off nuclear safety and food safety workers,  infectious disease specialists and IRS workers near the height of tax filing season. Both Musk and Trump are among the wealthy elite. Neither is dependent on a tax refund.

In his recently published book Why Nothing Works: Who Killed Progress—and How to Bring It Back, Marc J. Dunkelman recounts the expansion of the federal government, starting with the Progressive movement that began under Theodore Roosevelt’s administration over a hundred years ago. The movement embodies two instincts that are in constant tension, a “progressive schism” whose roots began when the nation was founded (pg. 22). Alexander Hamilton favored a strong central government whose institutions could facilitate the commerce and defense of the new American republic. Thomas Jefferson believed that the integrity and character of the new nation depended on the yeoman farmer, who must be protected from the power of government. Jefferson was horrified by the abuses of a strong British government headed by a monarch.

Progressives want to expand the reach of government – the Hamiltonian instinct – but are fearful of the power of government – the Jeffersonian instinct. The struggle between these two sentiments frustrates the aims of the Progressive movement. Progressives’ “cultural aversion to power renders government incompetent, and incompetent government undermines progressivism’s political appeal” (pg. 15).

For more than a century conservatives in both political parties have tried to check the ambitions of the progressives and the expansion of the federal government. For almost a century following the civil war, southern Democrats fought to preserve their political dominance and cultural institutions from the imposition of reformist norms by “northern elites.” There is still a strong antipathy to federal power but most of us have adapted to and enjoy federal institutions created by progressive legislation. Millions of Americans enjoy our national parks and monuments but over a century ago, local groups protested federal interference in the management of lands within state boundaries like Yellowstone Park, Glacier National Park and Grand Canyon National Park.

We no longer argue over child labor laws introduced by progressives in the early 20th century. Though popular today, conservative groups fought against the Social Security program when it was first introduced in the 1930s. Congressional Republicans, however, were largely unopposed, according to this 1966 interview with George Bigge. Opposition to “socialized medicine” stymied proponents of a Medicare type system first proposed in 1942. In the 1950s, President Eisenhower initially supported a health plan financed through the Social Security system but dropped his endorsement over objections that the program was a slippery slope to socialized medicine (Source). Wilbur Mills, the powerful Chairman of the House Ways and Means Committee, overcame Republican opposition to the Medicare program by introducing a Part B system for physician payments that would be voluntary. Many of us make an uneasy truce with federal power when those policies produce a net gain for our well-being, or there are limits to federal mandates.

This week, Donald Trump completed the first month of his second presidential term with a whirlwind of federal job cuts and controversial remarks. The first ninety days of a presidential term are said to be the honeymoon period when public opinion is still forming but recent polls by Quinnipiac University and CNN indicate that initial favorable sentiment has soured. More respondents disapprove of Trump’s policies than approve. Trump has promised to downsize both spending and taxes but preserve the Social Security and Medicare programs. Both programs are popular, as many voters feel that people have earned the benefits after a lifetime of paying taxes. The taxes, or dues, come first; the benefits come later.

There are no dues for the Medicaid program which provides health care insurance for low-income households. The federal government and states share the costs of this program in varying degrees, with the federal government picking up the majority of the costs. The Republican majority in the House has proposed $880 billion in cuts to the Medicaid program and Trump has expressed support for the cuts, surprising some Republican lawmakers and Trump’s own staff.

Trump acts with the impulsiveness of a 14-year-old boy. In an earlier age, the public wanted a stable hand in control of a vast nuclear arsenal. Thirty years after the end of the Cold War, voters seemed less concerned with Trump’s erratic behavior. Some excuse it as a negotiating ploy; others see it as a tactical maneuver. In Washington, where everyone has a “loaded weapon,” so to speak, Trump presents a moving target. Others see the policy moves as sheer incompetence. Over a thousand employees at the National Park Service were laid off and seasonal hiring was frozen (Source). Oops. Seasonal employees fight forest fires and clean bathrooms at National Parks. The Trump administration did an about face and promised to hire even more seasonal employees than the Biden administration did (Source). The daily two-step is a boon for news organizations and pundits. Lots of copy. Not a dull moment in the 24-hour news cycle.

Advocates may clamor for the death of the beast – the government – but many of the functions that the beast provides are popular. In 1963, the folk group Peter, Paul and Mary released the song Puff, the Magic Dragon. Although Puff was an eternal creature, his friend Jackie Paper eventually lost interest in Puff as he grew up. After his friend abandoned him, Puff lost all his vigor and retreated into his cave by the sea. Some wish that the federal government would do the same. Lobbyist Grover Norquist wished that government would become so small that “we can drown it in a bathtub” (Source). Unlike Jackie Paper, the majority of the public has not outgrown its affection for government programs or its belief in the magic of government power.

//////////////////

Image by ChatGPT at the suggestion “draw a picture of a multi-colored dragon on the shore of the ocean with a cliff behind him.”

The Conflict in Policy

March 10, 2024

by Stephen Stofka

This week’s letter continues my analysis of the many roles of the federal government, comparing spending, tax revenues and the federal debt that has accumulated since 9-11. Governments accumulate debt by spending more than they collect in tax revenues. Farmers, businesses and households appreciate the subsidies and support from government but resist paying the taxes to fund those programs. The private marketplace depends on government funding of nascent technologies that may take decades to commercialize. Examples include the internet, the development of semiconductors, lithium batteries and the funding of pharmaceutical research. Investment in military readiness has spurred advancements in aerospace and satellite technology, the GPS that connects our phones and the Kevlar clothing that protects our soldiers and police officers. Critics may ridicule a government investment in solar manufacturer Solyndra, but it was also heavy government funding that provided the cash flow for SpaceX and Tesla.

In last week’s letter I showed that private investment and government spending and investment both averaged about 18% of GDP over the past three decades. A closer look at those two series shows how they complement and compete with each other. In the graph below, private investment dipped from 19% of GDP in 2006 to below 14% in 2009. As a percent of GDP, government spending and investment took up some of the slack.

As many people lost their jobs, they became eligible for Medicaid or food stamps. Both of these programs are included in government spending because the programs directly or indirectly provide people with goods or services. The graph above does not include increased unemployment insurance payments during the recession. These are included in government transfers since this is money, not services, transferred from the government to individuals. Policymakers refer to this combination of support programs as automatic stabilizers, providing assistance to households during hard economic times.

A recent analysis by the Congressional Budget Office (CBO) found that these automatic stabilizers were not “key drivers of debt over the long-term.” The federal debt was growing because government spending was increasing at a faster pace than revenues. The chart below shows spending and revenues for the past thirty years in a natural log form to portray the trends of change more clearly.

For most of the past three decades, revenue growth, the orange dashed line in the graph above, lagged government spending, the blue line. Note that this revenue series (FRED Series FYFR) does not include Social Security taxes. The growth in government spending showed some moderation only during Obama’s term and that was the worst time to slow the growth of government spending and investment. The Great Recession of 2007-2009 was the worst economic downturn since the 1930s Depression, surpassing the pain of the back-to-back recessions of the early 1980s.

Biden was vice-President during that recovery and was determined not to repeat that mistake in the aftermath of the Covid-19 pandemic. Although the Democratic majorities in the House and Senate were slim, unified government helped the effort to pass the Inflation Reduction Act and the CHIPS Act. Both pieces of legislation committed government funds to support investment in clean energy development and semiconductor manufacturing. Such commitment spurred private investment in the energy industry. In 2023 field production of crude oil surpassed 2019 levels, according to the Energy Information Administration (EIA). They report that natural gas output was up 2% in the first year of Biden’s term, then accelerated to 5% growth in 2022 and 2023 following Russia’s attack on Ukraine.

Despite big increases in the deficit after 9-11, and an accumulated debt of $22 trillion held by the public, the interest share of GDP has remained below the levels of the 1990s. In 2001, China was admitted into the World Trade Organization. As imports from China increased, we paid for them with U.S. Treasury debt, helping to keep interest rates low for most of the past two decades.

Unlike individuals and corporations, governments can buy their own debt. Unless a majority of that debt is sold in the private marketplace, there is no independent evaluation of the creditworthiness of that debt. At the end of last year, 65% of the total Federal debt was privately held, the highest percentage since 1997 (see notes). Including the Treasuries held by independent Federal Reserve banks, the percentage is close to 80%. A recent report from the Center for Strategic and International Studies (CSIS) calculates the percentage of debt held by two of our largest trading partners, China and Japan, at 5.8%. The wide ownership of U.S. debt validates it as a low-risk financial instrument.

The global financial system depends on tradeable sound securities. When the financial crisis undermined confidence in mortgage securities, private investment declined sharply, and it would do so again if investors doubted the soundness of Treasury securities. The recent CBO report points out a weakness in public policy that the Congress must resolve or risk damaging the credit of U.S. securities. 1997 was the last year when Congress submitted a budget by the deadline, according to the Congressional Research Service. When is the moment when the private debt market loses hope that Congress can match its spending and revenues? No one can forecast a stampede to safety but in hindsight many will claim to have seen the exit signs.

///////////

Photo by Manki Kim on Unsplash

Keywords: investment, debt, interest, Treasuries, government spending, taxes, automatic stabilizers

According the March 2024 Treasury bulletin, total Federal debt was $34 trillion. $21.7 trillion was privately held – about 65%. See Table OFS-2 of the March bulletin. Privately held debt plus $5.2 trillion of Treasuries held by independent Federal Reserve banks constitute Federal Debt Held by the Public (FRED Series FYGFDPUN) and is close to 80% of total federal debt. For a thirty-year series of the public’s portion of total debt, see https://fred.stlouisfed.org/graph/?g=1hYFV. Until the 2008 financial crisis Federal Reserve banks held less than 10% of total debt. During the pandemic, that share rose to 21%. At the end of 2023, the share was 15.4%.

The Role of Government

March 3, 2024

by Stephen Stofka

This week’s letter is about the federal government, its expenses and the role it plays in our lives. As originally designed in 1787, the federal government was to act as an arbiter between the states and provide for the common defense against both Indians and the colonial powers of England, France and Spain. James Madison and others considered a Bill of Rights unnecessary since the powers of Congress were clearly set forth in Article 1, Section 8 of the Constitution. However, they agreed to attach those first ten amendments to the ratification of the Constitution to soften objections to a more powerful central government (Klarman, 2016, p. 594). After the Civil War, the federal government was given a more expanded role to protect citizens from the authoritarianism of the states. The authority to do so came from the amendments, particularly the recently ratified 13th, 14th and 15th additions to the Constitution (Epstein, 2014, p. 15).

After the Civil War, the Congress awarded pensions to Union soldiers, their widows, children and dependent parents. In 2008, there were still three Civil War dependents receiving pensions! (link below). This program indebted future generations for the sacrifices of a past generation. Aging soldiers sometimes married young women who would help take care of them in return for a lifetime pension until they remarried. The provision of revenues for these pensions provoked debate in Congress. In the decades after the Civil War, the federal government’s primary source of revenue was customs duties on manufactured goods and excise taxes on products like whiskey. Farmers and advocates for working families complained that this tax burden fell heaviest on them, according to an account at the National Archives. There were several attempts to enact an income tax, but these efforts ran afoul of the taxing provision in the Constitution and courts ruled them invalid. Fed up with progressive efforts to attach an income tax to legislation, conservatives in Congress proposed a 16th amendment to the Constitution, betting that the amendment would not win ratification by three-quarters of the states. Surprisingly, the amendment passed the ratification hurdle in 1913. In its initial implementation, the burden of the tax fell to the top 1% so many disregarded the danger of extending federal power. Filling out our income tax forms is a reminder that our daily lives are impacted by events 150 years in the past.

In the decade after the stock market crash of 1929, the government extended its reach across the generations. Under the Franklin D. Roosevelt (FDR) administration, the newly enacted Social Security program bound successive generations into a “pay-go” compact where those of working age paid taxes to support the pensions of older Americans. The government assumed a larger role in the economy to correct the imbalance of a free-market system which could not find a satisfying equilibrium. This expanded role of government and the writing of John Maynard Keynes (1936) helped spawn a new branch of economics called macroeconomics. This new discipline studied the economy as a whole and a new bureaucracy was born to measure national output and income.

Students in macroeconomics learn that the four components of output, or GDP, are Consumption, Investment, Government Spending and Net Exports. In its simplest definitional form, GDP = C+I+G+NX. In the American economy each of these four components has a fixed portion of output. Net exports (FRED Series NETEXP) are a small share of the economy and are negative, meaning that America imports more goods and services than it exports. The largest share is consumption (PCE), averaging 67% over the past thirty years. Government spending and investment (GCE) and private investment (GPDI) have averaged an 18% share during that time. Because these two components have an equal share of the economy, more government spending and taxes will come at the expense of private investment. This helps explain the intense debates in Congress over federal spending and taxes. Federal investment includes the building of government facilities, military hardware, and scientific R&D. I have included a link to these series in the notes.

The Social Security program is as controversial as the pensions to Civil War veterans and their survivors. The long-term obligations of the Social Security program are underfunded so that the program cannot fully meet the promises made to future generations of seniors. The payments under this program are not counted as government spending because they are counted elsewhere, either in Consumption or Investment. They are treated as transfers because the federal government takes taxes from one taxpayer and gives them to another taxpayer. The taxpayer who pays the tax has less to spend on consumption or saving and the person who receives the tax has more to spend on consumption or saving. However, those transfer payments represent already committed tax revenues.

The chart below shows total transfer payments as a percent of GDP. Even though they are not counted in GDP, it gives a common divisor to measure the impact of those payments. The first boomers born in 1946 were entitled to full retirement benefits in 2012 at age 66. In the graph below those extra payments have raised the total amount of transfers to a new level. After the pandemic related relief transfers, total transfers are returning to this higher level of about 15% of GDP. I have again included government spending and investment on the chart to illustrate the impact that the federal government alone has on our daily lives. In one form or another, government policy at the federal level steers one-third of the money flows into the economy.

For decades, the large Boomer generation contributed more Social Security taxes than were paid out and the excess was put in a trust fund, allowing Congress to borrow from the fund and minimize the bond market distortions of government deficits. Outgoing payments first exceeded incoming taxes in 2021 and Congress has had to “pay back” the money it has borrowed these many years. To some it seems like a silly accounting exercise of the right pants pocket borrowing from the left pocket, but the accounting is true to the spirit of the Social Security program as an insurance program. Paul Fisher, undersecretary of the Treasury, quipped in 2002 that the US government had become “an insurance company with an army” but the quip underscores public expectations. Workers who have been paying Social Security taxes their entire working life expect the government to make good on its promises.

We are mortal beings who create long-lived governments that act as a compact between generations. We argue the terms and scope of that compact. What is the role of government? The founding generation debated the words to include in the Constitution and even after the words were on the page, they could not agree on what those words meant. The current generations are partners in that compact, still debating the meaning of the text of our laws and the role of government in our lives.

///////////////////

[20240303Government.jpg]

Photo by Samuel Schroth on Unsplash

Civil War pensions – a National Archives six page PDF https://www.archives.gov/files/calendar/genealogy-fair/2010/handouts/anatomy-pension-file.pdf

Data: a link to the four data series at FRED https://fred.stlouisfed.org/graph/?g=1hxIK. There is a small statistical discrepancy, and that series is SB0000081Q027SBEA.

Social Security: Notes on the adoption of a 75-year actuarial window used by the trustees of the Social Security funds to assess the ability of the program to meet its obligations. https://www.ssa.gov/history/reports/65council/65report.html. In 2021, the Congressional Research Service published a three-page PDF explainer for the choice of a 75-year term.

Epstein, Richard Allen. (2014). The classical liberal constitution: The uncertain quest for limited government. Harvard University Press.

Keynes, J. M. (1936). The general theory of employment interest and money. Harcourt, Brace & World.

Klarman, M. J. (2016). The Framers’ Coup: The Making of the United States Constitution. Oxford University Press.

The Long and Short Run

August 16, 2020

by Steve Stofka

Gold is at an all-time high. Like wheat and other commodities, it pays no interest. Gold’s price moves up or down based on expectations about the value of money used to buy gold. If inflation is expected to increase, the price of gold will go up. Eight years ago, after several rounds of quantitative easing by central banks, gold traders bet that inflation would rise. It didn’t, and the price of gold declined by a third.

Since mid-February, the U.S. central bank has pumped almost $3 trillion of liquidity into the economy (Federal Reserve, 2020). Numbers like that hardly seem real. Let’s look at it another way. The overnight interest rate is so low that it is essentially zero – like gold. People around the world regard U.S. money and Treasury debt as safe assets – like gold. Imagine that the central bank went to Fort Knox, loaded up 1.5 billion troy ounces of gold – about 103 million pounds – in gold coins and dropped them on everyone in the U.S. There are about 190,000 tonnes (2204 lbs./tonne) of gold in the world, a 70-year supply at current production. A helicopter drop of gold would be almost 47,000 tonnes, or 25% of the world supply. It would take five C-5 cargo planes to haul all that.

Milton Friedman was an economist who believed in the quantity theory of money. His model of money and inflation held “inflation is always and everywhere a monetary phenomenon.” If the growth of money was greater than the growth of the economy, inflation resulted. The data from the past decade has refuted this model. Former chairman of the Federal Reserve Ben Bernanke noted that the evidence suggests that economists do not fully understand the causes of inflation (C-Span, 2020, July). He was including himself in that group of economists because he had been an advocate of that model (Fiebiger & LaVoie, 2020).

What has the Federal Reserve and the government done to navigate the difficult path created by this pandemic? Helicopter Money for businesses and consumers. Lots of toilet tissue, so to speak. No reason to hoard, folks. There’s plenty. They have followed the first of John Maynard Keynes’ prescriptions for a downturn. The government should spend money. Why? It is the only economic actor that can make long-term decisions. Everyone else is focused on the short term.  Keynes badly mis-estimated the short-term thinking of politicians, particularly in an election year.

Will the flood of money cause inflation as gold bugs assert? Some point to the recent rise in food prices as evidence of inflationary forces. However, the July Consumer report indicates only a 1% annual rise in prices, half of the Fed’s 2% inflation target. The rise in food prices this spring was probably a temporary phenomenon. It suggests that the Fed is fighting deflation, as Ben Bernanke noted this past April (C-Span, 2020 April).

Since March, government spending has helped millions of American families stay afloat during this pandemic. Congress has gone home without extending unemployment relief and other programs. Many families are being used as election year hostages by both sides. House Democrats put their cards on the table three months ago. Republicans in the Senate and White House have dawdled and delayed. Faced with a chaotic consensus in his own coalition, Senate Majority Leader McConnell has largely abdicated control of the Senate to the White House and the wishy-washy whims of the President.

We return to where we began – gold. It is neither debt, equity nor land. As a commodity, only a small part is used each year. It has been used as a medium of exchange and a store of value. Except for a few years during and after the Civil War, gold held the same price from 1850 until the 1929 Depression – $20.67. In the long run, longer than a person’s retirement, gold is good store of value. In the ninety years since the Great Depression began, the price of gold has grown 100 times. Yet it is still lower than its price in 1980. The U.S. dollar does not hold its value over several decades, but it is predictable in the near-term. In a tumultuous world, predictability is valuable. The dollar has become the new gold.

//////////////////////

Photo by Lucas Benjamin on Unsplash

C-Span. (2020, April 7). Firefighting. Retrieved August 12, 2020, from https://www.c-span.org/video/?471049-1%2Ffirefighting (00:21:15).

C-Span. (2020, July 18). Ben Bernanke and Janet Yellen Testify on COVID-19 Economic Inequities. Retrieved August 12, 2020, from https://www.c-span.org/video/?473950-1%2Fben-bernanke-janet-yellen-testify-covid-19-economic-inequities (01:35:20)

Federal Reserve. (2020, July 29). Recent Balance Sheet Trends. Retrieved August 12, 2020, from https://www.federalreserve.gov/monetarypolicy/bst_recenttrends.htm

Fiebiger, B., & LaVoie, M. (2020, March 4). Helicopter Ben, Monetarism, The New Keynesian Credit View and Loanable Funds. Retrieved August 12, 2020, from https://www.tandfonline.com/doi/abs/10.1080/00213624.2020.1720567?journalCode=mjei20

Green Debt

March 17, 2019

by Steve Stofka

Imagine a world where, each year, the U.S. government (USG) gave $1000 to each of it’s approximately 300 million citizens (Note #1). The annual cost of the program would be $300 billion, about $120 billion more than the 2017 tax cuts (Note #2). As it does every year, the USG would borrow the money and issue Treasury bills, which are traded around the world. Although there is more than $23 trillion of Treasury debt – a plentiful supply – there is not enough to meet world demand.

Let’s say that the American people spent 80% of that $300 billion each year and saved the rest (Note #3). Let’s also calculate a multiplier of 1.5 so that the extra $240 billion of spending generates $360 billion of GDP (Note #4), about 1.7% of last year’s GDP. The increase in GDP would return about $60 billion to the USG in tax revenues (Note #5). The net cost to the USG is $300 billion less $60 billion in additional tax revenue = $240 billion.

Will the slight increase in GDP each year generate higher inflation? Inflation occurs when too much money chases too few goods and resources. Efficiencies in world production of goods and services has caused a continuing deflation in developed economies. Against those headwinds, inflationary pressures will be modest.

At the end of ten years, this program would create an additional $3.5 trillion in U.S. debt, the same amount of debt that the Federal Reserve accumulated in 2008 to protect the jobs and bonuses of Wall St. bankers. The Fed still owns most of that debt (Note #6). Which is fairer? A program to distribute money equally to everyone or a program to distribute the same amount to a select few?

Implementation of such a program is unlikely but illustrates the lack of a moral rudder in our Congress. Self-branded fiscal conservatives in both parties promote the fiction that the Social Security and Medicare funds will “run out of money” at a certain date in the future. These funds are part of the Federal government and are nothing more than bookkeeping entries on the Federal government’s books. The Social Security Administration explains this: “[the funds] provide 1) an accounting mechanism for tracking all income to and disbursements from the trust funds, and (2) they hold the accumulated assets. These accumulated assets provide automatic spending authority to pay benefits” [my emphasis] (Note #7). The accumulated assets are paper IOUs from the government to itself so that Social Security benefits are beyond the reach of Congressional infighting and debate each year. When it was created, President Roosevelt called Social Security an insurance program because it was insured against Congressional tampering.

Republicans propose to privatize Social Security while Democrats propose additional taxes to “fully fund” Social Security. These schemes are built on accounting fictions and sold to the general public as prudent solutions. Will the trust funds run out of money? Congress can change this with a stroke of a pen. Just as they “borrowed” from the funds, they can “loan” to the funds (Note #8). Both parties are trying to convince voters that big changes must be made because Congress is too incompetent to make a small legislative change. Will voters buy this nonsense and let them keep their jobs?

Around the world, the value of US Treasury debt is more trusted than gold. It is more than a bond because it trades among commercial banks like currency. The U.S. enjoys a unique position. Its debt is a trusted part of the world’s savings. This country has worked hard and prudently to make the U.S. dollar the world’s money. Over the past century, the U.S. has managed its economy and debt better than other large developed countries. Let us take advantage of that position. Let’s stop the political ploys around Social Security and other federal entitlement programs. Let’s have a serious discussion about investing in building new schools and transportation solutions, as well as needed infrastructure repairs. Let’s stop posturing like buffoons and start behaving like the leader we are.

//////////////////////
Notes:

1. Census Quick Facts
2. Annual loss of tax revenue about $180 billion times 10 years = $1.8 trillion per CBO estimate 
3. Americans usually save about 5% of income.
4. More on fiscal multipliers. 1.5 is an average of various multipliers.
5. USG revenues average 17% of GDP.
6. Fed’s balance sheet over time. The Fed buys Treasury debt in the secondary market from large banks that buy the debt at Treasury auctions. The Fed continues to hold $1.6 trillion of mortgage-backed securities, the same kind of debt that led to the Financial Crisis. Current balance sheet.
7. Social Security Administration FAQ #1 on the nature of the funds . Also, see their page debunking SS myths promoted on the Internet
8. The Federal government pays below market interest rates for the money that it “borrowed” from the SSA funds. Decades ago, the interest rate was set at approx. the five-year average for funds “borrowed” for several decades. If 20 or 30 year rates had been used, the SS funds would be much larger. There would be no “crisis” to argue about.

The Role of Government

December 18, 2016

What role should government at many levels – Federal, state and local – play in our lives?  Some want a large role, some small.  Does the Constitution give the Federal government a diminished role in our lives? That is the viewpoint of those on the right side of the political divide in this country.  As Donald Trump gets ready to lead a Republican dominated Federal government, the debate burns white hot, as it did at the founding of this country.

Let’s turn the time dial back to 1936, the middle of the Great Depression, to appreciate just how much we depend on government today.  At that time, the unemployment rate had declined from a soul crushing 24%, but was still high at 17%.  The Roosevelt administration had ushered in many programs to alleviate joblessness.  In 1936, total government spending at all levels was $257 billion. (Dollar amounts don’t include what is called transfer payments like Social Security. and are in 2016 dollars.)

Eighty years later, it is $6 trillion, about 24 times the 1936 level.  Some might counter that the population has grown so, of course, government spending has grown.  The population has indeed increased, but only 2.7 times, far below the 24 times that government spending has multiplied.  In 1936, per person spending was $2,000.  Today it is $19,000.

During World War 2, government spending climbed six times to $1.6 trillion, about 25% of today’s level.  We are not currently engaged in a global war which occupies most of our economy as it did in the 1940s.  We do not have millions of young men in combat.  And remember, these figures don’t include Social Security, welfare and business subsidies.

Now let’s look at this from another viewpoint, one that might lead to a different conclusion.  Let’s look at government spending as it relates to family income.  According to the IRS and BLS, average family income was about $26,000 in 1936. (IRS and BLS See note below).  Remember, this was during the most severe Depression in our nation’s history.  So, per capita government spending was about 6% of this rather low family income.  Today, it is 33% of the $56,000 median family income.  So, we squint at these figures from two viewpoints and we are still left with the same conclusion.  As a percent of income and on a per capita basis, government spending has become a significant part of our lives.

When Republicans talk about smaller government, the “small” in that catch phrase should be kept in perspective.  At best, Republicans might want to lower spending growth to eight times, not ten times, the spending of 1936.  Those on the left might want to accelerate that growth to 12 times.  In either case, neither party advocates the frugal spending levels of 1936.  I should note that President Roosevelt himself was concerned that this low (to us) level of government spending – most of them his New Deal programs – was becoming too high.

The current fad is speaking in hyperbole.  Many daily experiences in our lives are awesome.  Our kids, our vacation, the latte we had yesterday – all awesome. It is no surprise, then, that we would  use hyperbole to describe those who don’t agree with our political views.  They are communists, or socialists, or capitalist anarchists, or [insert epithet here].  The voices of moderation are growing smaller by the year.

Half of the voters in this country want less government, half want more.  If each of us wants “our” views to prevail, we need to get up off our asses and pull on the rope in this political tug of war.  When “our” side gets into power, the other half has to suffer through it, and vice-versa.  This battle of ideas will continue throughout our lifetimes and – God Forbid! – we might even change sides.

/////////////////////////////

Endnotes

According to the IRS, only 4.3% of tax returns reported positive taxable income in 1936.  One out of 20 families footed the entire bill for Federal government spending. 95% of families had no federal taxable income. 

Real wage growth in the U.K. has turned negative for the first time since the 1860s.
(Bloomberg)

The most common job in a lot of states:  truck driver.  (NPR)

Investment Flows

October 18, 2015

When economists tally up the output or Gross Domestic Product (GDP) of a country, they use an agreed upon accounting identity: GDP = C + I + G + NX where C = Consumption Spending, I = Investment or Savings, G = net government spending, and NX is Net Exports, which is sometimes shown as X-M for eXports less iMports. {Lecture on calculating output}

In past blogs I have looked at the private domestic spending part of the equation – the C.  Let’s look at the G, government spending, in the equation.  Let’s construct a simple model based more on money flows into and out of the private sector.  Let’s regard “the government” as a foreign country to see what we can learn.  In this sense, the federal, state and local governments are foreign, or outside, the private sector.

The private sector exchanges goods and services with the government sector in the form of money, either as taxes (out) or money (in).  Taxes paid to a government are a cost for goods and services received from the government. Services can be ethereal, as in a sense of justice and order, a right to a trial, or a promise of a Social Security pension.  Transfer payments and taxes are not included in the calculation of GDP but we will include them here.  These include Social Security, Medicare, Medicaid, food stamps and other social programs.  If the private sector receives more from the government than the government takes in the form of taxes, that’s a good thing in this simplified money flow model. There are two types of spending in this model: inside (private sector) and outside (all else) spending.

Let’s turn to investment, the “I” in the GDP equation.  In the simplified money flow model, an investment in a new business is treated the same as a consumption purchase like buying  a new car.  Investment and larger ticket purchase decisions like an automobile depend heavily on a person’s confidence in the future.  If I think the stock market is way overpriced or I am worried about the economy, I am less likely to invest in an index fund.  If I am worried about my job, I am much less likely to buy a new car.  In its simplicity this model may capture the “animal spirits” that Depression era economist John Maynard Keynes wrote about.

We like to think that an investment is a well informed gamble on the future.  Well informed it can not be because we don’t know what the future brings.  We can only extrapolate from the present and much of what is happening in the present is not available to us, or is fuzzy.  While an investment decision may not be as “chanciful” as the roll of a dice an investment decision is truly a gamble.

Remember, in the GDP equation GDP = C + I + G + NX, investment (the I in the equation) is a component of GDP and includes investments in residential housing. In the first decade of this century, people invested way too much in residential housing.

In the recession following the dot-com bust and the slow recovery that followed the 9-11 tragedy, private investment was a higher percentage of GDP than it is today, six years after the last recession’s end.  Much of this swell was due to the inflow of capital into residental housing.

The inflation-adjusted swell of dollars is clearly visible in the chart below.  It is only in the second quarter of this year that we have surpassed the peak of investment in 2006, when housing prices were at their peak.

Investment spending is like a game of whack-a-mole.  Investment dollars flow in trends, bubbling up in one area, or hole, before popping or receding, then emerging in another area.  Where have investment dollars gone since the housing bust?  An investment in a stock or bond index is not counted as investment, the “I” in the equation, when calculating GDP.  The price of a stock or bond index can give us an indirect reading of the investment flow into these financial products.  An investment in the stock market index SP500 has tripled since the low in the spring of 2009 {Portfolio Visualizer includes reinvestment of dividends}

Now, just suppose that some banks and pension funds were to move more of those stock and bond investments back into residential housing or into another area?

June Labor Report and Plaques

On a recent vacation road trip, I enjoyed a number of tourist sites.  At Carlsbad Caverns in New Mexico, I learned that 2000 men with the CCC (Civilian Conservation Corp) built most of the visitor walkways and accomodations in the caverns between 1938 and 1942. Not only did the Caverns project provide enjoyment and a learning experience for me seventy years later, it provided work for a country still suffering through a long depression.  In Corpus Christi, I learned that, in the early 1970s, the sand dunes had been reclaimed by a joint effort of Texas and the Federal Government.  Stopping at a scenic site in west Texas, I read that visitor accommodations had been built as part of the Federal Highway project in the 1950s. At Big Bend National Park, I learned that Texas had turned these deep canyonlands into a state park in 1935, providing work for many in the process. 

What tourist sites will our children and grandchildren visit?  Will they read any signs that herald the hard work of those who lived through this Great Recession?  Why not?  Politicians argued about the budget and the national debt in the 1930s, in the 1950s, in the 1970s, just as they do today.  Then they got to work and made something happen.  Democrats and Republicans have sat on opposite sides of the fence and pointed fingers at each other in those past decades – then grudgingly came to a compromise and got something done, putting thousands to work on enduring projects.  Fifty to a hundred years from now, will there be any projects built by this generation that will have visitor plaques that our great grandchildren can read while on vacation?

With that, I’ll turn to the June employment report.  The headline number was a disappointment to many.  Although the number of jobs increased by about 75,000, it was less than the 120,000 hoped for.  The good news is that the year over year percent increase in jobs for most of the working population continued to increase.

The core working force – as I call it – those aged 25 – 54 continued to show modest positive increases as well.

The problem is that it is still not enough.  In the larger work force, aged 25+, we would like to see sustained 1.5% to 2% year on year growth to pull the economy up and out of the quicksand.  Despite all the rhetoric from the politicians who claim they know how to create jobs, those of us who actually create jobs know that the chief reason for the lack of stronger hiring is the politicians themselves.  The June survey of the National Federation of Independent Business (NFIB) a small business organization, reported that about 25% of business owners “who say it is a bad time to expand blame the current political mess.”  Another quarter of respondents blame weak sales, a fifth blame taxes and another fifth blame “unreasonable regulation and red tape.”  The number of firms planning to hire in the next six months offset approximately the same number of firms planning on reducing jobs.  In short, a lackluster preview of the second half of the year.

Over the past two years, business loans are continuing to grow, indicating increasing investment.

Businesses are preparing – cautiously – for increased consumer spending.  But consumer loan growth has stalled after a severe decline at the onset of the recession several years ago.  The spike in the first quarter of 2010 was an accounting change (explanation)

A bright spot – or dark spot – is the increase in overall consumer credit, approaching the levels of 2007.  Are consumers more confident?  Recent surveys don’t show that.  Are consumers more desperate and charging more to make up for  a lack of income growth?  Probably.

Disregard the rants and promises of blowhard politicians.  Consumer demand initiates most of the job creation in this country.  Businesses respond to that consumer demand by hiring more employees.  Without the demand, business owners create few jobs.  The only jobs created are sales and advertising jobs as business owners try to increase demand or take sales away from competitors.

In the coming months before this election, I encourage all of you to ask two questions of your representatives, senators, president and presidential contender:
1.  If consumers are still cautious, what policy can you implement that will encourage consumers to spend more? 
2.  If businesses are still cautious in their outlook, what policy can you implement that will encourage them to invest more in new jobs and equipment?

If the politician is a Republican, he or she will say that reducing regulations and taxes for businesses will help them create more jobs.  Ask them how that will help create jobs if the business has only tepid sales growth.  Should businesses hire more people just to sit around and fiddle their thumbs?

If the politician is a Democrat, they will talk about “investment” but what they mean is government spending to take the place of the lack of consumer spending.  How are they going to encourage consumers to spend more?  Silence.

Neither party has an answer to the problem of deleveraging, which is what consumers have been doing for the past several years.  They borrowed against their homes and their homes went down in value.  They charged more on their credit cards to make up for the lack of growth in their real incomes.  They had to pay down or default on that credit before charging more.  Deleveraging is a process that must be endured.

Unlike the individual states, the federal government has the constitutional capability of borrowing money.  While the federal government can not solve the problem of consumer deleveraging, it can soften the impact by borrowing to initiate the same kind of projects that the federal government, together with the states, did in previous decades: build and improve stuff that we can put a plaque on!  I do not like increasing government debt but I do like visitor plaques and informational signs at scenic and tourist sites.  Fifty years from now, will the Boomers be known as the Stumble Bum Generation or the Plaque Generation?

Starve The Beast

Fiscal realists have often championed a Starve the Beast theory, which aims to restrain the growth of government spending by restricting or reducing the growth of tax revenue to that government. The theory intuitively makes sense.  With less money to spend, politicians will be forced to lower spending.  During the past thirty years, however, the exact opposite has happened at the federal level.  When tax cuts were enacted, spending went up.  When taxes were raised, spending went down.  How to explain this curious phenomenon?

Jerry referred me to two articles written in 2004 and published by two think tanks commonly thought to be at opposite ends of the political spectrum, the libertarian leaning Cato Institute and the liberal leaning Brookings Institution.  In an article at About.com, Mike Moffat cites a one page summary by William Niskanen, Chairman of the Cato Institute, of a study that Niskanen did in 2002 which examined the relationship between tax cuts and spending.  He found an inverse relationship; taxes went up, spending went down and vice versa.

Two authors at the Brookings Institution, also writing in 2004, examined the voting records of mostly Republican lawmakers who had taken the “No New Taxes” pledge that year and found that the majority were, in fact, liberal spenders.  In 2004, the authors predicted that the combination of tax cuts and liberal spending by a Republican majority would dramatically increase the deficits.  Ballooning deficits during the following four years did lead to a doubling of the national debt, just as they predicted.

How many of the 258 original pledge signers are still in office?  I don’t have time for that analysis but the Americans For Tax Reform lists 235 Representatives and 41 Senators in the upcoming Congress who have taken a reiteration of the no tax pledge, called the Taxpayer Protection Pledge.

This past weekend President Obama and Republican leaders from the upcoming Congress hammered out a “framework” of compromise over the renewal of the Bush Era tax cuts.  Republicans were adamant that the top 3 – 5% of incomes retain the slightly lower tax rates of the past decade.  While Democrats may ridicule Republican politicians as paid stooges for the rich, many Republicans openly took the pledge, were presumably voted or retained in office because of the pledge and are honoring that pledge to their voters.

 Neither Republicans or Democrats have taken a pledge to reduce spending.  Below is a graph of Federal spending without transfer payments like Social Security, unemployment insurance and other social welfare programs.

Notice that leveling off in the 90s?  To decrease the ballooning debt incurred during the Reagan years, taxes were increased in 1993 under the newly elected Clinton Administration.  Voters balked, sending Republicans to Congress in 1994 on a pledge to cut spending, which they did.  The Starve the Beast theory works in reverse.  When voters have to come up with more taxes now, they demand reductions in government spending.  When taxes are cut, voters lose any urgency to insist that their representatives cut spending.  They talk about leaving a tax burden for their children but they don’t flood the offices of their representatives with phone calls, letters and emails.  That flood happens when the tax burden for government spending falls on voters now

Federal spending is only a third of the problem.  The 50 states constitute 2/3 of total government spending.  Below is a graph, in real dollars, of total government spending less transfer payments.

Tax cuts produce less real tax revenue and disincentivize voters to scrutinize the spending habits of their elected officials, thus increasing our national debt.  Tax increases produce more real tax revenue and stir up a passion in voters to get spending in control, thus reducing the national debt.  Over the long term, the choice should be clear – increase taxes which cuts spending.

What is the framework that Obama and Republican leaders worked out this past weekend?  Provisions include a two year extension of the tax cuts for all income earners, a 2% payroll tax reduction, an extension of federal unemployment benefits and an accelerated write off of business investment.  The two year cost of this is over $850B.  In short, this is Stimulus 2, slightly larger in cost than the $800+ billion that Stimulus 1 cost.  Stimulus 1 featured stimulus spending controlled from the commanding heights of the federal and state government.  Stimulus 2, if passed, will feature spending controlled by the people and businesses of this country.  The real risk of Stimulus 2 is that the receivers of these tax breaks will not spend the savings but continue to pay down accumulated debt.  Businesses are already holding onto an estimated $2 trillion in cash, reluctant to invest the money until there is a sure sign that the economy is turning around and they can make some return on their investment. 

Will accelerated tax deductions for investment induce businesses to loosen their purse strings?  Stay tuned as the Great Recession continues….and continues.