Thirty Year Horizon

April 10, 2022

by Stephen Stofka

In the period leading up to the financial crisis a speculative fever engaged many of the actors in the housing market. This included homebuyers, agents, mortgage brokers, investment firms and risk managers convinced that housing prices could only rise. Homebuyers, struck by FOMO fever, jumped into the home lottery, gambling on a quick flip for a profitable gain with little investment. The frenzy of this market is marked by an opposite phenomenon. Small investors with a portfolio of ten or fewer houses are outbidding conventional buyers with all cash offers. Investment capital is at war with consumption capital.

The Atlanta branch of the Federal Reserve (2022) maintains a Home Ownership Affordability Monitor (HOAM) that ranks the affordability of a home at current prices and interest rates in cities and counties through the country. Readers can select the city, county they are interested in and they’ll see the affordability index. Hover over a county on the map and they’ll see the median home price, median household income and the share of income a house payment would be. The mortgage payment is based on the 3.6% interest rate of two months ago. After the recent rise in interest rates, you can add on at least $200 or more to the monthly payment.

A total housing cost of up to 30% of gross income is considered affordable according to the HOAM guidelines. A rule of thumb to calculate an affordable housing budget is to divide annual gross income by 40. For instance, $80,000 / 40 = $2000 per month. An index above 100 is affordable. The metro Denver area is in the 70s. With an index below 50, a typical household in the LA area would spend more than 50% of their gross income on housing. Some of the counties in the Dallas-Ft. Worth, Texas area and most of the counties in the Atlanta, Georgia area are affordable and that helps explain a growing population in some southern states.

Few will be surprised to learn that housing prices in many cities are unaffordable. Since the housing crisis, not enough housing has been built and low interest rates have increased the pool of qualified buyers. The higher demand puts upward pressure on prices. Older homeowners on a reduced income may resist selling because they cannot find a suitable replacement – a paradox of rising home prices.

In the chart below I’ve added on the Fed’s 2% inflation target to real GDP growth as a benchmark for the 30-year mortgage rate. Rates have been low the past decade but GDP growth has been low as well.

The red line is real economic growth after inflation + 2%. In the last quarter of 2021, economic growth was just 5% above the same quarter of 2019. That two year growth rate is moderate but not strong. The one year growth rate of 5.5% is due to what economists call base effects. Because of the pandemic the 2020 base number was weak, making moderate growth look stronger than it is.

The Fed is expecting growth to average 2.75% this year and decline to 2.3% in 2023 (FRED Series GDPC1CTM). Add in the Fed’s 2% inflation target as I done and the 30 year rate should find a balance in the range of 4.5-5.0%. However, that rate will probably overshoot before finding an equilibrium. The war in Ukraine will make it more difficult for that balance to happen. Homebuyers should not expect 30-year rates to fall below 4% in the near term.

/////////////////

Photo by Laib Khaled on Unsplash

Federal Reserve. (2022). Home Ownership Affordability Monitor. Federal Reserve Bank of Atlanta. Retrieved April 7, 2022, from https://www.atlantafed.org/center-for-housing-and-policy/data-and-tools/home-ownership-affordability-monitor Link updated 2/23/2025 → https://www.atlantafed.org/research/data-and-tools/home-ownership-affordability-monitor#Tab2

Home, Sweet Home

April 3, 2022

by Stephen Stofka

Interest rates belong to the world of money assets where changes can happen as fast as a keystroke. Prices are “sticky,” moving slower in the concrete world of real goods and services. This week the 30-year mortgage rate rose to 4.67% (MORTGAGE30US), but home prices are still high, reflecting the higher demand for homes at low interest rates. Denver was 11th in the country with an annual price increase of more than 20%, according to the Case Shiller index for January (DNXRSA see note). Six months ago, a 30-year rate was 2.87%, near a historic low. The difference in monthly payments on a 30-year $240K mortgage is $245.

When we buy a home, we leverage our down payment into a stable asset and become our own landlord. When the BLS computes the CPI inflation index, they include an item called Owner Equivalent Rent (OER) and it contributes 25% to the CPI index, the largest component of that index. Based on a survey of actual rental housing, OER represents the opportunity cost of renting our home to ourselves rather than to someone else at the going market price. While this might seem contorted, it reminds us that a home represents consumption capital, an investment whose benefits we consume during the time we own the asset. A home is the largest component of most household wealth.

The Federal Reserve charts changes various components of household wealth (Fed, 2022). Our homes represent a stable base of change, as the chart below shows.

The light green shaded area is the change in our home equity. You can visit the site and play with the time controls. Because the change is so stable, people’s expectations became anchored until the housing and financial crisis when the change in housing equity turned negative. People were shocked that such a thing could happen on a broad national scale. It is not unusual for home prices to turn down in a local area, usually in response to a substantial shift in the economic base of an area. Home prices in some Midwest cities experienced substantial losses as manufacturing went to other countries with lower labor costs. In the 1980s, the decline in oil prices made investments in oil shale on Colorado’s western slope unprofitable. Thousands lost their jobs and the prices of working class homes in Denver experienced a 10% decline (DNXRLTSA). Over several decades across the entire country, home prices are sure to rise but the probability of regional economic declines is equally sure.

The blue bars in the graph above represent the volatile changes in stock market equity. Compare that volatility to the stable changes in bond equity (orange). That’s why financial advisors recommend a growing portfolio allocation to bonds as we grow older. The small deviations in bond and real estate prices help anchor the large deviations in stock market wealth.

As mortgage rates rise, people can afford less home and the decrease in demand should relieve the upward momentum of rising home prices. There are those who play momentum in stock prices, buying and selling to take advantage of short term changes in sentiment. The graph above highlights the difference in deviations of stocks and homes. Playing the real estate market like it was the stock market got a lot of people in trouble during the 2000s. A home is an investment in stability, not a raffle ticket to riches.

////////////////////

Photo by Scott Webb on Unsplash

Home Price, Denver Note: Even affordable homes in Denver have experienced sharp prices increases, rising 19.6% in January (DNXRLTSA).

Fed. (2022, March 10). Board of governors of the Federal Reserve System. The Fed – Chart: Changes in Net Worth: Households and Nonprofit Organizations, 1952 – 2021. Retrieved April 2, 2022, from https://www.federalreserve.gov/releases/z1/dataviz/z1/changes_in_net_worth/chart/

Growth Periods

July 28, 2019

by Steve Stofka

Did you know that housing costs double every twenty years? The predictability surprised me. Both rents and home prices double. Based on the last forty years of data the average annual increase is about 3-1/2% (Note #1).

House prices can only get ahead of earnings for so long before a correction occurs. Take a look at the chart below. Yes, low interest rates reduce mortgage payments so people can afford more home. That’s what we said in the 2000s. This trend does not look sustainable to me.

I was doing some work on potential GDP and wondered which president since World War 2 has enjoyed the longest and strongest run of real (inflation-adjusted) GDP above potential. Potential GDP is estimated as a nation’s output at full employment.

I won’t start with the #1 award because that would be no fun. Nixon came in fourth place with a run of strong economic growth from 1971 – 1973. The oil embargo that followed the Arab-Israeli War of 1973 sent this country into a hard tailspin that ended that growth spurt.

Ronald Reagan comes in third with a cumulative total of 24.5% growth above potential GDP. The expansion began in the third quarter of 1983 and ran through the second quarter of 1986. These strong growth periods seem to last two to three years.

Second place goes to President Truman with a short (less than two years), sharp 25.2% gain that ended with the beginning of the Korean War.

And the award goes to…the envelope please…Jimmy Carter. Wha!!? Yep, Jimmy Carter. The growth streak began in 1976, the year Carter was elected, and ended in 1979 when Iran overthrew their Shah, oil production sank, and oil prices doubled. At its end, the expansion had totaled 25.5% above potential GDP. In less than two years, the nation soured on Carter and put Reagan in office.

What about other Presidential administrations? We might remember the late 1990s as a heady time of skyrocketing stock prices during the second Clinton administration. The output above potential was only 11.5% but is the longest period of strong growth, lasting almost four years, from the first quarter of 1996 through the last quarter of 1999.

George Bush’s growth streak was only slightly higher at 12.8% but is the second longest growth period, beginning in the third quarter of 2003 and ending in the last quarter of 2006. A year later began the Great Recession that lasted more than 1-1/2 years.

Barack Obama’s presidency began with the nation deep in a financial crisis. By the time he took office fourteen months after the recession began, the economy had shed 5 million jobs, 3.6% of the employed. Employment was more than 6 million jobs below trend. The economy did not start growing above potential until the first quarter of 2010. The growth period ended in the third quarter of 2012, but employment did not regain its 2007 pre-recession level until May of 2014, 6-1/2 years after the recession began. It is the weakest strong growth period of the post-WW2 economy.

President Trump’s streak of strong growth began in the last few months of Obama’s term and is still ongoing with a cumulative gain of 7.5%. Unlike other growth periods, this one is marked by steadily accelerating growth above potential.

I’ve charted the cumulative growth above potential and the period length for each president.

As the economy shifted away from manufacturing in the 1980s, the days of 20-plus percent growth ended. Manufacturing is more cyclic than the whole economy. The manufacturing sector contributes to strong growth in recovery and pronounced weakness at the end of the business cycle each decade. In the 1980s, economists and policy makers in both government and the Federal Reserve welcomed this shift away from manufacturing. They dubbed it the Great Moderation and it ended twenty years later with the Great Recession.

President Trump is on a mission to begin another “Great” period – the resurgence of manufacturing in America. It is a monumental task because manufacturing depends on a supply chain that is presently located in Asia. In 2013, Apple tried to manufacture and assemble its high-end computer, the Mac Pro, in Texas. Production faltered on the availability of a tiny screw (Note #2). Six years later, the Trump administration is levying 25% tariffs on Apple products to encourage them to manufacture computers again in Texas.

The widespread use of tariffs usually leads to fewer imports. As other countries retaliate, exports decrease. Slowing global growth poses additional challenges to repatriating manufacturing to this country. If Trump can realize his passion, we may again return to those days of heady growth and more severe business cycle corrections.

////////////////////

Notes:

  1. The Case-Shiller home price index (HPI) for home prices. The Consumer Price Index’s rent of a primary residence.
  2. A NY Times account of Apple’s last attempt to manufacture in the U.S.A.

A Real Minimum Wage

November 18, 2018

by Steve Stofka

Near the top of the Democratic agenda in the new Congress is a minimum wage of $15. The bill is unlikely to pass the Senate, but it will signal to the voters that the Democratic House is meeting campaign promises. The states with the most solid Democratic support are those on the west coast and northeast coast where the cost of living is much higher. A single minimum wage for the entire country is not appropriate. Republicans control the Senate and they are from states with much lower costs of living. They will reject an ambitious minimum wage that is one-size fits all.

Housing is the largest monthly expense for most families. Below is a graph of home prices in several western metropolitan areas (MSAs) and the national average of twenty large MSAs. Home prices in Dallas and Phoenix are a 1/3 less than Los Angeles and San Francisco. Housing costs in many smaller cities will be below Dallas and Phoenix.

CaseShillerComps

Why isn’t the minimum wage indexed to inflation? Because politicians of both parties, but particularly Democrats, have used it as a wedge issue to gain voter support. If the House Democrats wanted to pass bi-partisan legislation on a minimum wage, they could use a flexible minimum wage that is indexed to the average wages for each region within the country. These are published regularly by the Bureau of Labor Statistics, the same agency that publishes the monthly report of job gains and the unemployment rate. I’ve charted the annual figures for those same cities.

HourlyEarnComp

A $15 minimum wage is 40% of the average wage in San Francisco, and a bit more than half of the average wage in Los Angeles. It is almost 60% of the national average. The current minimum of $7.25 is 28% of the national average.

If the House passed a minimum wage bill that set the wage to 40% of the average wage for each region, Senate Republicans might at least consider it. In Denver and L.A., the minimum wage would be about $11.50. In Dallas and Phoenix, it would be about $10.60. Democrats could show that they are in Washington to pass legislation for working families, not pound some ideological stump as Republicans did for eight years with the repeal of Obamacare.

//////////////////////

Stocks and Taxes

There is a close correlation between stock prices and corporate tax collections. The tax bill passed last December lowered corporate tax revenues in the hope that businesses would invest more in the U.S. The divergence between prices and collections has to correct. Either tax collections increase because of greater profitability or stock prices come down.

StocksVTaxes
/////////////////////////
Income Growth

The financial crisis severely undercut income growth. Real, or inflation-adjusted, per capita income after taxes decreased for three years from 2008 through 2010, and again in 2014. It is the longest period of negative growth since the 1930s Depression.

IncomeRealPerCapGrowth

The Reputation of Money

To be respected, authority has got to be respectable. – Tom Robbins

September 9, 2018

by Steve Stofka

Most nations create their own money, a super power of the modern state. The politicians and central bankers of each country have the responsibility to maintain the reputation of its money. Each nation is both the creator and net seller of its money, able to lower but not raise its comparative value. To raise that value, each nation depends on others to be net buyers of its money.

Nations carefully study the behavior of each other’s central banks. Argentina cut interest rates in January 2018 even though the country was experiencing high inflation. This action was the opposite of good central banker behavior, and hurt the reputation of the Argentine peso, which has lost half its value since January. Money traders suspected that the Argentine central bank had become captive to political control. Few trusted a politician with money super powers.

The reputation of a nation’s money rests on the steadiness of its tax revenues. As I have noted before, revenue from the sale of nationalized resources acts as a tax. Those commodity revenues do not build a money’s reputation as much as the tax revenues from the economic production of a nation’s people and businesses.

A nation can print its own money at little cost. A greater supply of anything, given a constant demand, lowers the price of that thing. The real cost of printing money is borne by the nation’s people and businesses who use that money for daily exchange. As a money’s value declines, that loss of value acts as a sales tax on each money unit exchanged. Let’s call that the king’s tax. This undeclared tax revenue does not build a money’s reputation.

A nation supports the reputation of its money by using its super powers with restraint. When a nation receives most of its tax revenues from its own internal production, that is a sign of a healthy economy, with a reasonable monetary and fiscal policy. When the king’s tax (inflation) and commodity resource revenues exceed half of a nation’s revenue, the value of its money becomes like two day old bread.

A nation’s money rises in reputation when it is bought, and there are two reasons for buying a nation’s money: 1) buying goods and services from that nation, and 2) loaning money to the governments and businesses of that nation. In 2017, China, the United States and Germany were the top exporters, putting their currencies in demand (Note #2). Loans to borrowers in emerging markets are often priced in U.S. dollars, the current reserve money of the world. If the money in that nation loses its value against the dollar, the borrowers effectively pay a king’s tax as they make their loan payments (Note #1). Typically, a nation will blame the tax on rapacious money dealers.

A nation’s money reputation relies on several factors that a nation can control: inflation, tax revenue and the source of that revenue. A nation is judged on its current and historical behavior with money and debt. Its political structure and the independence of its central bank are important factors as well. On an international stage, its money must compete with other nations in all these categories. Call it the daily beauty contest – no swimsuits.

///////////////////////////////

1. EMB is a basket of emerging market debt priced in USD (http://etfdb.com/etf/EMB/). It is off 5% from its high at the beginning of the year and pays a dividend of 4.6%. Its annual return for the past ten years was 6.5%, the same as a long Treasury ETF like TLT. A broad bond index fund like Vanguard’s BND earned 3.8%.

2. Germany uses the Euro, not its own national currency. In 2017, China exported $2.35 trillion, the U.S. $1.55T and Germany $1.45T. Visual Capitalist picture graph. The site is a picture book for curious minds. Here’s one on the biggest employer in each state. For southern states, the answer is Wal-Mart. Universities and health care systems are prominent employers in many states.

Related: The U.S. owes $6.2 trillion to the rest of the world. China’s share of that debt is $1.8 trillion. The U.S. holds $125 billion in foreign reserves, similar to the amount Turkey holds. As the world’s reserve money, the U.S. holds enough foreign reserves to counter any distortions in currency markets.

/////////////////////////////

Miscellaneous

In a survey of 5000 workers, Gallup found that only 51% had a single full-time job.  36% were gig workers.

Since 1991, real purchase only house prices have gone up 1.7% annually. FRED series HPIPONM226S / PCEPI, index 3/1991 = 100. Real rents and owner equivalent rent (OER) nationally have gone up 8/10ths percent annually. This is about half the rate of home price growth. Urban residents must pay an extra price. In Denver, rental prices have gone up 1.9% annually since 1991. OER has risen 1.7% annually. No doubt, California cities have even higher annual growth rates than national averages. Owner Equivalent Rent is a BLS-calculated rent that a homeowner pays themselves for use of the residence. This includes mortgage, repair and maintenance costs on the home.

Grandma’s Kids

May 27, 2018

by Steve Stofka

The birth rate has touched a 30-year low, repeating a cycle of generational boom and bust since World War 2. The first boom was the Boomer generation born in the years 1946-1964 (approx). They were followed by the baby bust Generation X, born 1964-1982. The Millennials, sometimes called Generation Y and born 1982 – 2001, surpassed even the Boomers in numbers. Based on the latest census data, Generation Z, born 2002- 2020, will be another low birth rate cohort.

These numbers matter. They form the population tide that keeps the entitlement system afloat. Social Security and Medicare are “pay as you go” systems. Older generations who receive the benefits depend on taxes from younger generations for those benefits. As the population surge of Boomers draws benefits, the surge of Millennials is entering their peak earning years.

To maintain a steady population level, each woman needs to average 2.1 births. During the Great Recession, the birth rate for native-born Hispanic and Black women fell below that replacement level. White and Asian women fell below that level during the recession following the dot-com boom in the early 2000s. Foreign born Hispanic and Black women are averaging a bit more than 2-1/2 births. The average of foreign born White and Asian women is just about replacement rate.

Around the world, birth rates are falling. Social welfare programs depend on inter-generational transfers of income. When a smaller and younger generation must pay for a larger and older cohort, there is an inevitable stress.

I will distinguish between social welfare programs and socialist welfare programs with one rule: the former require that a person pay into the program before being entitled to the benefits from the program. In this regard, they are like insurance programs except that private insurance policies are funded by asset reserves held by an insurance company. Government “insurance” programs are “pay as you go” systems. Current taxes pay for current benefits. The Social Security “reserve” is an accounting fiction that the Federal government uses to track how much it has borrowed from itself.

Examples of social welfare programs that require the previous payment of dues are: Social Security, Medicare, Unemployment and Workmen’s Compensation Insurance. Although the latter two are paid directly by employers, they are effectively taken out of an employee’s pay by reducing the wage or salary that the employer pays the employee. Employers who fail to understand this go out of business early in the life of the business. I have known some.

Examples of socialist welfare programs that are based on income, or need: Medicaid, TANF (Welfare), WIC, Food Stamps, Housing and Education Subsidies. There is no requirement that a person pays “dues” into a specific program before receiving benefits.

Health care in America is primarily a social welfare program with socialist elements. The Federal government does subsidize all employer provided health insurance and most private insurance through the tax system or the Affordable Care Act. However, most beneficiaries must pay some kind of insurance to access benefits. Under the 1986 EMTALA act, emergency rooms are notable exceptions to this policy. They are required to treat, or medically stabilize, all patients insured or not.

As Grandma begins to draw benefits from Social Security and Medicare, she relies on the earnings of her kids who form the core work force aged 25 – 54. Grandma has paid a lifetime of dues into the social welfare programs and wants her benefits. Grandma votes.

Her grandkids want government subsidies for educational needs and job training. They depend on socialist welfare programs with no dues. The grandkids don’t vote.

The kids are caught in a generational squeeze.  Their taxes are paying for both their parent’s benefits and their kid’s benefits.

/////////////////////////

Housing Trends

In the spring of 2008, there was an eleven month supply of existing homes on the market.
2010 – 8-1/2 months
2012 – 6-1/2 months
2014 – 5-1/2 months
2016 – 4-1/2 months
2018 – 4 months

In some cities, a median priced home stays on the market less than 24 hours.

Here is another generational shift.  Grandma and Grandpa now own 40% percent of home equity, up from 24% in 2006. Their kids, the age cohort 45 – 60, own 45%. Those under 45 have only 14% of home equity, down from 24% in 2006.

//////////////////////

Brave New World

E-Commerce is now 9.5% of all retail sales, almost triple the percentage ten years ago. (Fed Reserve series ECOMPCTSA). In 2000, the percentage was less than 1%.

Debt and Housing

March 18, 2018

by Steve Stofka

Republicans used to care about yearly budget deficits when Obama was President. Since Obama left office, the budget deficit is up 20%. As a percentage of GDP, 2017’s deficit was above the forty-year average of deficits (Treasury Dept press release).  At the end of the Obama term, the gross federal debt was 77% of GDP. In ten years, the Congressional Budget Office estimates that percentage will be over 90%. (Spreadsheet ) That estimate does not include the lower revenues from the tax cuts passed in December.

During the two Bush terms, Republican deficit hawks, genuinely concerned about budget deficits, were overruled by a majority of Republicans who paid only political lip service to common sense budgeting.

The Federal Government’s fiscal year runs from October to September. At the end of February, the fiscal year was five months old. According to the Treasury’s monthly budget statement, this fiscal year’s deficit has gone up 10%. Because of the tax cut passed in December, payroll tax collections are down. Because of higher interest rates, the government paid an extra $40 billion on the federal debt in the first five months of this fiscal year, which began October 2017. $40 billion is half of the food stamp program. Debt matters. The government is going into more debt to pay the interest on the existing debt.

The government paid $550 billion in interest last year and is estimated to pay over $600 billion this year. That is just a $100 billion less than the defense budget. Because interest rates are historically low, the interest as a percent of GDP is low. We cannot expect that they will remain low.

InterestPctGDP

Interest rates were low in the 1950s. By 1970, they were over 7% and had climbed to 14% by 1980. Since the financial crisis ten years ago, central banks in China, Europe and the U.S. have been buying government debt. Central banks don’t demand higher interest. As their role diminishes, price-sensitive buyers like pension funds and households will demand higher interest rates (Bloomberg article). Recent Treasury debt auctions have been lightly subscribed, and the Fed is having to step in as a buyer to artificially make a market. Remember, the Fed is just another pants pocket of the Federal Government. In essence, the Federal Government is buying its own debt.   What can’t continue forever, won’t.

///////////////////

Housing

Have you gotten the impression that the housing market is going gangbusters? As a percent of GDP, housing investment is double what it was at the lows of the recession. The bad news is that current levels are near the historic lows of the post WW2 economy.

ResInvest

On the other hand, housing affordability has hit all time lows. A prudent rule of thumb is that a person or family should not spend more than 25% of their income on housing. A corollary of that rule is that a household should not buy a home that is more than 4 times their annual income. At 5.2, the current ratio is far above a prudent rule of thumb.

HousingIncomeRuleOf4

Government debt levels make the government, and us, vulnerable to any loss of confidence.  Low housing investment makes the economy less resilient.  High housing costs make it more difficult for families to save.  In a downturn, more families must turn to government for benefits.  Saddled with high debt levels and interest payments, government is less able and willing to extend benefits. The cycle turns vicious.


Portfolio Stability

February 14, 2016

Disturbed by the recent volatility in the stock market, some investors may be tempted to trade in some of their stock holdings for the price stability of a CD or savings account.  After a year of relatively little change, stock prices have oscillated wildly since China began to devalue the yuan at the beginning of the year.

Just this week, the price of JPMorgan Chase (JPM), one of the largest banks in the world, fell almost 5% one day then rose 7% the next.  Such abrupt price moves in a large multi-national company are driven less by fundamentals and more by fear.  As the price of oil fell below $30, hedge fund and investment managers began to doubt the safety of bank loans to energy companies, particularly those smaller companies whose fortunes have risen recently during the fracking boom.  Even if these types of loans were a miniscule portion of JPM’s total loan portfolio, investors remember that the financial crash began in 2007 with growing defaults of home loans that started a financial chain reaction of derivatives that blew up.  Sell, sell, sell, then buy, buy, buy.

Price stability is a term usually associated with measurements of inflation like the Consumer Price Index (CPI). A basket of typical goods is priced each month by the BLS and the changes in those prices are charted.  Each of us has a basket of investment goods that have varying degrees of price stability.  Stock prices vary a lot;  bond prices less so; house prices even less.  Cash type instruments like savings accounts and CDs have no nominal variation.

Each of us desires some degree of stability as we chug through the waters of our lives.  Like a ship we must make a tradeoff between speed and stability.  A stable ship must compromise between the depth and breadth of its keel, that part of the ship which is below water.  A deep keel provides stability but puts the ship at the risk of running aground in shallow water.  A broad keel is stable but increases the water’s drag, slowing the ship. (Cool stuff about ships)

It is no surprise that stocks provide the power to drive our investment ship.  Few investors realize that housing assets provide more power and stability than bonds.  We judge stability by the rate with which the price of an asset changes.  The slower the price change, the more stable the asset.  Over decades, residential housing has better returns and steadier pricing than bonds, although that might surprise readers who remember the housing bubble and its aftermath.

Many investors include the value of their home in their net worth but not necessarily in their investment portfolio and may underestimate the stability of their portfolio. Let’s imagine an investor with $750,000 in stocks, bonds, CDs, savings accounts and the cash value of a life insurance policy.  Let’s say that $375K is invested in stocks, $375K in bonds and cash equivalents.  That appears to be a middle of the road allocation of 50/50 stocks/bonds.  I will use bonds as a stand in for less volatile investments.

Let’s also assume that this investor has a house valued at $215K with no mortgage.  If we add in the $215K value of the house, we have a total portfolio of $965K and a conservative allocation closer to 40/60 stocks/bonds, not the 50/50 allocation using a more standard model.

We arrive at a conservative estimate of a house value based on the income or rental value that the house can generate, not the current market value of the house, which can be more volatile.  In previous posts, I have noted that houses have historically averaged 16x their annual net operating income, which is their gross annual rental income less their non-mortgage operating expenses. For real estate geeks, this multiplier is 1 divided by the cap rate.

Let’s use an example to see how this multiplier works.  Let’s say that the going rent for a modest sized house is $1600 per month and we guesstimate an average 30% operating expense, leaving a net monthly income of $1120.  Multiplying that amount by 12 months = $13,440 annual net operating income.  Multiply that by our 16x multiplier and we get a valuation of $215K.  Depending on location, this house might have a market value of $260K but we use  historic income multiples to calculate a conservative evaluation.

Our revised portfolio provides a more comprehensive perpective on our investment allocation and the stability of our “buckets.” During the past year, we may have seen a 5 – 10% increase in the value of our home, offsetting some of the apparent riskiness of a 10% or 20% move in the stock market.  Adjusting our portfolio assessment to allow for a home’s value might reveal that our stock allocation is actually a bit on the low side after the recent market decline and – quelle horreur! – we should be selling safer assets and buying stocks to maintain our target portfolio balance.  But OMG, what if stocks fall further?!  Then we might have to buy even more stocks to meet our target allocation percentages!  This is the essential strategy of buying low and selling high, yet it is so counterintuitive to our natural impulses.  We buy some assets when we are fearful of them.  We sell other assets when we think they are doing well.

****************

For anyone interested in housing as a business, the Wall St. Journal published a comprehensive guide, Wall St. Journal Complete Real Estate Investing Guidebook by David Crook in 2006. Recently, Moody’s noted that apartment building cap rates had declined to 5.5%, resulting in a multiplier of 18x that is above historical norms.

**********************

A Pause On the Road

August 30, 2015

For the past few weeks, the volatility in the stock market has been front and center.  I finished last week’s blog with a note that the market would be conducting a vote of confidence in the coming weeks.  In the opening minutes last Monday morning, the Dow Jones index dropped a 1000 points, almost 6%.  No doubt many investors had spent the weekend worrying and put their sell orders in the night before.  By Friday’s close, however, the SP500 had gained almost 1% for the week.

A few weeks ago the Dow Jones index, composed of just 30 large company stocks, marked a death cross. The death cross is the crossing of the 50 day price average below the 200 day average.  See last week’s blog if you are unfamiliar with this.  This week the broader SP500 index, composed of the largest 500 U.S. companies, marked it’s own death cross.

Two weeks ago, I noted the attitude of one Wall St. Journal reporter to the dreaded death cross. In one word: blarney.  In two words: hocus-pocus.  So why do some investors and the press give this any attention?  Used as a trading system in the broader SP500 the death cross (sell) and it’s companion golden cross (buy) signal have produced a winning trade 4 out of 5 times.  Where do I sign up?, you might be thinking.  In an almost sixty year period of the SP500, however, the extra annual return is slight – about  8/100ths of a percent, or 8 basis points  – over no timing strategy, i.e. buy and hold.  To the average small investor, taxes and other fees more than offset this negligible advantage.

In contrast to any technical stock market price indicators, the fundamentals of the U.S. economy are mostly strong or expanding. Consumer Confidence rose above 100 this past month, surpassing the optimism of the benchmark set in 1985.  The second estimate of GDP growth released this past week was above some of the high estimates.  After inflation, real GDP growth continues at 2.65%.

Corporate profits are growing at 7.3%, home prices are up 5%.  Real, or inflation-adjusted, consumption spending and income is  growing at more than 3%, equaling the heights of pre-recession spending and income growth in early 2007.

Housing prices are increasing for a good reason.  Inventory of homes for sales is relatively low.  In the middle of the 2000s, prices rose even though inventory of homes for sale were going up, a sign of a speculative bubble.  Ah, things look so clear in the rear view mirror.

New jobless claims remain at historically low levels and job growth has been consistently solid.  There are more involuntary part-timers than we would like to see and the participation rate is low.  Gloom and doomers will tend to focus on the relatively few negative points in an otherwise optimistic economic panorama.  Gloom and doomers think that those who disregard  negative signs are Pollyannas.  Eventually, years later, the gloom and doomers are right.  “My timing was off but, see, I was right!” they exclaim. The lesson of the death cross and the golden cross are this: a person can be right most of the time.  The secret to successful investing is knowing when we are wrong and acting on it.

For the individual investor, signals like the death cross can be calls to check our assets and needs.  Older investors may depend on some stability in their portfolio’s equity value for income, selling some equities every quarter to generate some cash.   Financial advisors will often recommend that these investors keep two to five years of income in liquid, low volatility investments.  These include cash, savings accounts, and short to medium term corporate bonds and Treasuries.  Younger investors may see this price correction as an opportunity to put some cash to work.

A Week In The Life

September 28, 2014

This past Monday George was out in the backyard when his wife Mabel came out on the back deck to announce that lunch was ready.  From the deciduous vines that grew on the backyard fence George was pulling leaves that had turned an autumn shade of red.

“George, what are you doing?”
“I thought I would pull these leaves off before they fall.  This way I won’t have to stoop so much a few weeks from now to pick them out of the rock garden.  The leaves are getting in the pond and clogging up the filter.”
“Well, come on, dear.  Lunch is ready.  I heard on the radio a little while ago that the market is down.  You know how I worry about that.”
“Oh, really?” George replied.  “It was down last Friday.  Did they give any reason?”
“Something about housing.  I’m sure you’ll find out all about it while you are eating.”

Mabel had set a nice lunch plate of panini bread, cheese and vegetables.  George was a tall man, a big boned man, prone to weight gain in retirement. Although George was fairly fit for his age, she worried about his health, particularly his heart, the male curse.  Mabel made sure that they both ate sensible, healthy meals.

Mabel took her lunch into the living room, leaving George alone in the kitchen.  He liked to check in on the stock market a few hours before the close to get a sense of the direction of the day’s action.  She would have chosen to keep all their savings in CDs and savings accounts but the interest rates were so low that living expenses would slowly erode their principle.

“We’ll put just 25% of our money in the market,” George had told her.  “I’ll watch it carefully and if anything like 2008 happens again, we can pull it out right away.  I’ll know what the signs are.”

George had studied a book on technical indicators which were supposed to help a person understand the direction of the market.  Despite her confidence in George’s ability and sensibility, Mabel still worried.  The stock market had always seemed to her like gambling.

At the kitchen table, George turned on the computer while he chewed his carrots and celery.  He had never been fond of vegetables but found that his likes and dislikes had mellowed with age.  He liked that Mabel cared.  The market helped distract him from the vegetables.  He paged through the daily calendar at Bloomberg, then checked out the headlines at Yahoo Finance. Existing home sales in August had fallen more than 5% from the previous August but that was a tough comparison because 2013 had been a pretty strong year.  Existing home sales were still above 5 million.

Before George had invested some of their savings in the stock market, he had bought several books on how to read financial statements but soon gave up when he realized that knowing the fundamentals of a company would not protect their savings in the case of another meltdown like the recent financial crisis.  Patient though she might be, Mabel would be extremely upset with him if he lost half of his investment in the market.

He then turned to the study of technical indicators which analyzed the behavior of other buyers and sellers in the stock market.  As an insurance adjuster, he had learned C programming back in the 1990s and found a charting program whose language was familiar to him.  As a former adjuster for the insurance of commercial buildings, he was used to making judgments based on a complex interplay of many factors.  He played with several indicators, found a few that seemed to be reliable, but got burned when the market melted down in the summer of 2011.  He got out quickly but not quickly enough for he had lost more than 10% of his investment in the market.  The market healed but at the time it seemed as though there might be a repeat of the 2008 crisis.  Had George and Mabel been younger, George could have just ridden out the storm.  Retirement had made him cautious and the 2011 downturn made George almost as leery of the market as Mabel.

Tuesday was a fine day in late September.  Mabel put her crochet down and made the two of them some soup, with fruit, crackers and cheese.  She took pride in the variety of food that she prepared.  When she walked out on the deck to call George in for lunch, a startled crow took to flight.  George was sitting on the edge of the deck where the crow had been.

“What are you doing, George?”
“I was teaching that little crow how to break open a peanut,” George replied. “I think they learn how to do stuff like that from their parents but I haven’t seen the flock in a few days and this guy was just wandering around the backyard looking for something to eat.  When I gave him a peanut, he didn’t seem to know what to do with it.  He’d pick it up in his beak, then drop it and stare at it.  He pecked at it a few times but that only made the peanut skitter away. “
George held up a branch.  “I carved a claw into the end of this branch and held down the peanut for him.”  George held up half a peanut shell.  “See, he got it figured out.  He flew off when the door opened but I’ll betcha he’ll be back.”
“Well, come on in then.  Lunch is ready.  The market is down again.  Something about housing again.”
“Hmmm,” George grunted and followed Mabel into the kitchen.  “Hmmm, that soup smells good.”
“A little beef vegetable that I doctored up a bit,” Mabel said with a smile.
George gave her a little hug. “I sure like your doctoring.”

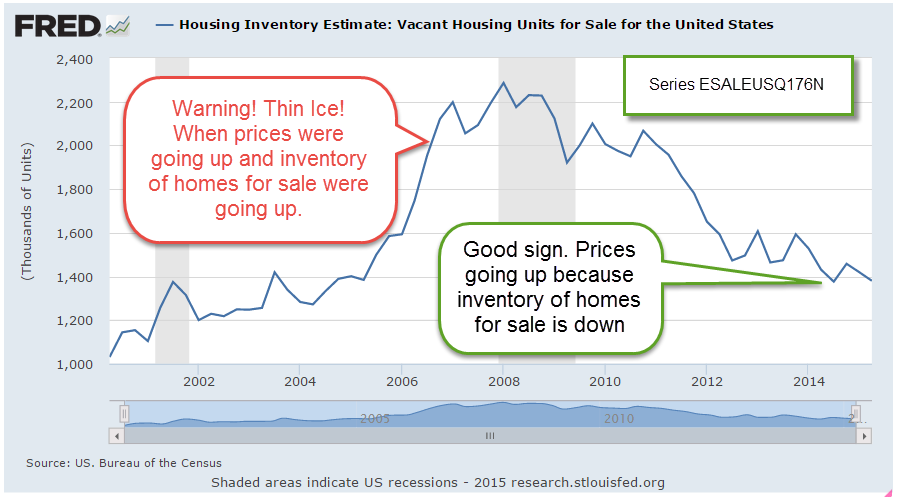
He sat down to eat, wondering what all the fuss in the market was.  Checking the Bloomberg Calendar, he saw that it was the House Price index from the Federal Housing Administration that had dampened spirits.  The monthly change was drifting down to zero, a sign of weakness.  Although housing prices were still rising, the rise was slowing down.

A disappointment, George thought, but not a catastrophe.  However, the market had been down for three days in a row.  He finished his lunch and went into the living room.  Mabel was reading a book.
“You know, Mabel, I think it’s just a short term thing.  The bankers from the developed countries met last week and they kinda put out a wake up call to the market.  I think there’s a bit more caution and common sense after that.”
“Well, as long as you’re watching it, dear.”
“You know, we did good this last year,” he reassured her.
“I just worry that it was too good.  We should have taken some of that out of the market and put it somewhere safe.”
 “Well, I’m keeping an eye on it,” he said.  “I checked CD rates last week and they are paying like 1% for a one year CD.  It just ain’t like it used to be. We just have to take some risk.”

They had a 3-year CD coming due in a month. He didn’t want to tell her that he was thinking about not rolling over the CD.  Maybe buy a bond fund.  She wouldn’t like that. For a time he had dabbled in some short to medium term trading but barely broke even.  He had lost sight of his original goal – to keep their savings safe while taking some risk with the money.  Fortunately, this insight had come to him toward the end of 2012.  The market had been mostly up since then, rewarding those who sat out the small downturns.

Late Wednesday morning, Mabel could hear George on the side of the house clearing brush or some such thing.  He said he was going to cut down an elm tree sapling that was growing near the house but when she went out to call him into lunch, he had cut everything but the elm sapling.

“I thought you were going to cut that down, dear.”
“Well, I was but the squirrels are using it to climb up to the old swamp cooler we have perched up there.  You remember the litter from early this spring?  Well, I think there’s another litter in there.  I haven’t seen any young ones but there’s a squirrel carrying twigs up that sapling to the cooler.  She’s even got a piece of one of my rags.  Must’ve fallen out of my pocket.”

Mabel looked up at the platform George had mounted to the side of the house years ago.  On top of the platform sat the old abandoned cooler.  George had meant to take it down and disassemble the platform but then the squirrels had used it as a nursery this winter and neither of them had been able to dismantle it while the little ones were scampering around in and out of the cooler.  Of course, George was supposed to take the cooler down during the summer but never got around to it.  Now she saw that he had tied a cord from the platform to the sapling to bend the sapling close to the platform, making it easier for the squirrel to get from the tree to the platform.

She shook her head and said “George Liscomb, I hope you don’t let that sapling get out of hand.  You know how elm trees are.  They grow faster than a puppy.”
“Well, the tree won’t grow much during the winter and I’ll cut it down in the spring.”
“Ok, well, come on it.  Lunch is ready.  I heard on the radio that the market is up a lot today.  Housing again.  Maybe you were right about it being short term.”
“Well, of course, I’m right,” he made a grand gesture.  “The squirrels will confirm that.”

His lunch plate held some broccoli spears and six, no more and no less, tater tots.  “I know you don’t particularly like broccoli so I thought a few tater tots might ease the pain,” Mabel said with a slightly sardonic smile.

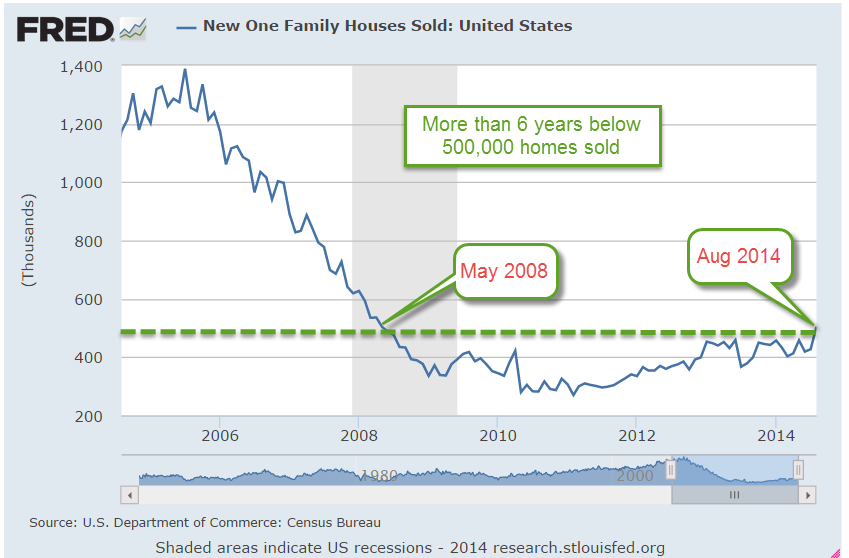
He laughed.  “I’m married to a kind prison guard.”  He sat down at the table, wondering what could have buoyed the market so much.  Housing yet again.  “Holy moly!” he called out to Mabel. He went into the living room to tell her the good news. “Finally, after more than six years, new homes are selling at a rate of more than half a million a year.  That’s what’s got the market dancing.”

On Thursday, she found George working on the stream that he had built in the rock garden.  A few feet from George a squirrel cautiously sipped water from the stream.  The squirrel saw her and scampered up the nearby fence.  “It’s remarkable how comfortable they are with you,” she told him.  “I try to move slowly when I’m working,” George replied. “They seem to be less anxious.”
“What are you doing today?” she asked.
“Got a leak somewhere.  I’ve lost about 15 gallons since last night.  Still haven’t found it.”
“Well, you’re not going to like what going on in the market.  It’s way down today and it’s not about housing.”

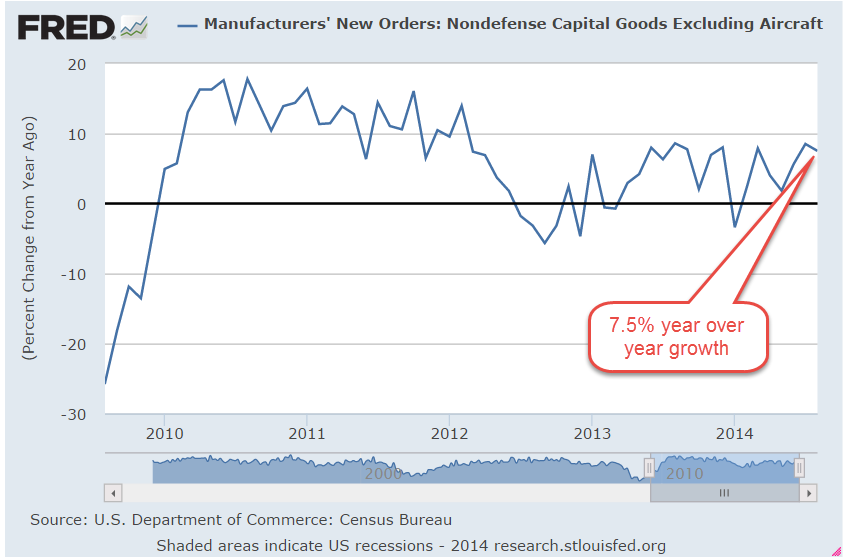
He followed her into the house and broke into a big grin when he saw what was for lunch. “Tuna fish!”  Mabel had dressed up her famous tuna fish salad with lettuce, tomatoes, some green onions and put it open faced on some toasted bread.  It was scrumptious.  Not so the market.  The SP500 was down about 1-1/2% on several news releases.  The whopper was that Durable Goods Orders were down 18% in August from the previous month.  But most of that drop was a decline in aircraft orders after a surge in those same orders in July.  Aircraft orders were notoriously volatile. Year-over-year gains in non-defense capital goods, the core reading, were up almost 8%.

The weekly report of new unemployment claims had risen slightly but was still below 300,000.  September’s advance reading of the services sector, the PMI Services Flash, was slightly less than the robust reading of August but still very strong.  So what was causing these overreactions to news releases?  The short term traders execute buy or sell orders within seconds of a news release.  Computer algorithms trade within nanoseconds of the release.  If new unemployment claims are up even by 1, the word “up” or “rise” or some variation will occur within the release.  Sell.  New home sales up?  Up is good for this report.  Buy.  Why would the short-termers be so active this week?  Because they are trading against each other.  The mid and long termers, the portfolio managers, will take the stage at the beginning of next week to adjust their positions at quarter end when funds report their allocations.

Late Friday morning, Mabel stood out on the back deck, her mouth open at the sight of George hunched down as he came out of the shed in the backyard.  Hundreds of wasps swarmed above him.  He knelt down and closed the doors to the shed and hurried to her on the deck.

“My God, George!  Are you all right?”
“Oh, yeah, no worries.  Anything on me?” he asked.
“No.”  There were just a few wasps visible outside the closed doors.  “What on earth?!”
“Well, they’ve really built themselves a city since I was in there last,” George explained.  He sat down on the deck.  The shed was where they kept old tax records and camping gear that they hadn’t used in quite a long time but hadn’t given away or sold – just in case they went camping again.  “I should have sprayed them earlier in the summer but it was such a small hive.  Those doors get sun most of the day so they like it in there.  They’re right above the doorway so they’re not bothering any of our stuff and I was able to stand up in the shed and they just left me alone.”
“I don’t care. What if I had gone out there to get something?!” she said angrily.
“Yeh, you’re right.  I’ll take care of them this weekend.  I was kinda waiting for the cold weather to do its job.”  He held up his hands a couple of feet apart from each other.  “That hive is like this, strung out along the studs that frame the doorway.”
“Why were you out there?” she asked.
“Well, I wanted to see if we still had the box that the TV came in a few years ago.”
“Didn’t you throw it out?” she asked.
“Well, I thought that in case we had trouble with the TV but then the box was behind a bunch of stuff and it was hard to get to and I guess I forgot,” he admitted.
“Well, come on it and eat your lunch.  The market is up again today, I heard them say.”

George settled down at the kitchen table.  A few salami slices, some macaroni salad, carrots, olives and crackers sat on the plate.  “Working man’s antipasto, hey?”
“There are some sardines in there, too” she said.
“I have the best wife and cook in the world.  Anthony Bourdain, move ovah!  Mah honey’s takin’ ovah!”
Mabel laughed.  “Now let me get back to my book.  Second to last chapter and I think the niece did it.  I haven’t trusted her since the first chapter.”

The 3rd estimate of 2nd quarter GDP had been revised up from 4.2% to 4.6%, helping to compensate for the weak first quarter.  Good stuff, thought George.  The U. of Michigan Consumer Sentiment Survey had risen in September to 84.6 from August’s 82.5.  Confident consumers buy stuff, a good sign.  Anything above 80 was welcome and more was better.  To round out the daily trifecta of news releases, corporate profits for the second quarter were revised upward.  The year over year gain without inventory and depreciation adjustments was 12.5%.  Not spectacular but solid.

Even with Friday’s triply good news, the market closed below what it opened at the previous day.  This was usually an indication that the short term downward trend in the market might have a little way to run.  Then he promised Mabel that he would get rid of the wasps this weekend, and yes, he would be careful.  Did she remember seeing the wasp spray that he bought earlier that summer?