Money Flows

Since the election, the SP500 index has risen about 10%. A broad bond composite has lost about 3%. Investors are clearly willing to take on a bit more risk. Prices are generally a good indicator of trend, but let’s take a few minutes to look at the flows of money into various investment products to understand the shifts in sentiment and confidence.  In the first two weeks of February the flows of money have been staggering.

The Investment Company Institute (ICI) tracks (Stats) the money flows into long-term equity and bond mutual funds as well as hybrid funds that contain both stocks and bonds (Target date funds, for example).  ICI also includes data on ETFs that can be bought and sold like stocks during the trading day. To avoid confusion, I’ll use “products” to describe combined data of mutual funds and ETFs. These long-term products reflect investors’ broader outlook on the market and economy rather than a short-term trading opportunity. For most of 2016, investors withdrew money from equities. Since the election, there has been a surge of $45 billion into equity products, causing a surge in prices.

icifundflows2014-2016

Financial advisors recommend some combination of both stocks and bonds for most investors. Let’s look at the money flows into bond products over the past year. When investors withdraw money from stocks, they tend to put them in bonds or money market funds, a shift from risk to safety.

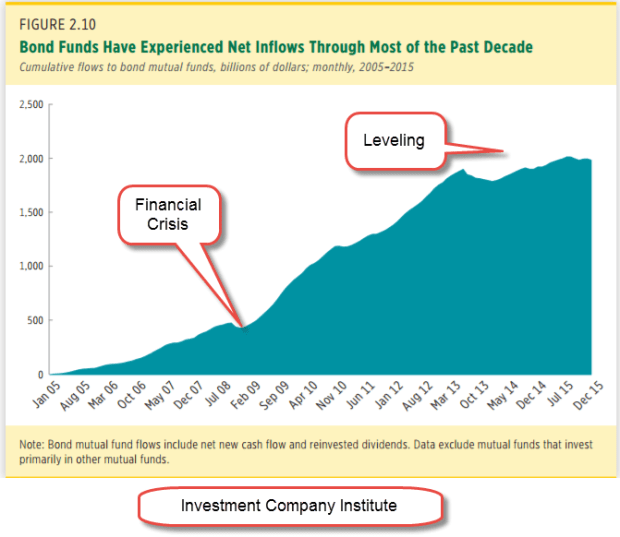
Older people are more cautious and have more of a preference for the price stability and dividends of bond products. The aging population and the painful memories of the financial crisis prompted a rush into bond mutual funds. The cumulative money flows into bond funds has increased from $500 billion in the summer of 2008 just before the financial crisis to over $2 trillion in 2015. (ICI chart)

icibondflows2005-2015

In the chart below we can see inflows into bonds during 2016, counterbalancing the outflows from equities. Since the election, investors have shifted $17 billion from bonds to riskier equity products. Not shown here was a further outflow of $20 billion from balanced hybrid products containing both stocks and bonds.

icibondflows2014-2016
Let’s review those totals. In November and December, there was a net INflow of $8 billion. Compare that with the $43 billion OUTflow in November and December 2015. Clearly, there was an increased appetite for risk. In 2015 and 2016, inflows into stock, bond and hybrid products declined rather dramatically from 2014’s totals.

icistockbondhybrid2014-16

In the first six weeks of this year, that lack of confidence has disappeared. Investors have pumped $63 billion into stock, bond and hybrid products, almost as much as the $74 billion invested in ALL of 2016. Should that pace continue – unlikely, yes – the inflow would be about $550 billion, far outpacing the inflows of 2014.  Over $40 billion of that $63 billion has come in during the first two weeks of February.  That is a $1.1 trillion annual pace. Where has this 2 week surge of money gone?  Half into equity – about $20 billion – and half into bonds -about $20 billion.

Had that money surge gone mostly into equities or mostly into bonds, I would be especially worried of a mini-bubble.  As I wrote last week, I am concerned that anticipated profits have already been priced in. Somewhat reassuring is the Buddha-like balance of flows – the “middle way.”

///////////////////////////

Tools

I have added some resources on the Tools page.  You can click on the menu item at the top of this page to access.  If you have any suggestions or additions, please let me know.


Easter Egg

April 5, 2015

On this Easter Sunday, Christians celebrate the Resurrection of Jesus, Jews observe Passover, basketball fans await the final contest of the Final Four and baseball fans look forward to the start of the new season.  After Friday’s disappointing report of job gains in March, investors might be wondering what will happen Monday when markets in the U.S. reopen following Good Friday.  In overseas markets, yields on the 10 year Treasury bond fell on the employment news.  Job gains that were about half of expectations helped allay fears of a June rate increase.  We may see a positive response from both the bond and equity markets on Monday as the time table for rate increases might start in September.  On the other hand, the weekend might allow more rational judgment to prevail. One month’s disappointment does not a trend make.  Year over year gains in employment are especially strong.

April is usually a good month in the stock   market.  Since breaking the 2000 mark in August, the index has neither gained or lost much ground.  Gains in the technology companies that are included in the SP500 (Apple, for example) have been offset by losses in the oil sector of the SP500 (Exxon, Chevron, for example).  Long term Treasuries (TLT) have risen 10% in the past six months, despite the prospect of rising interest rates in 2015.

ICI reports that domestic long term equity mutual funds had an outflow of about $8 billion in March. Investors have not abandoned equity funds by any means but have changed focus. During this past month, $14 billion flowed into world equity funds.   Bond funds continue to post strong inflows – $10 billion in March.

The boomer generation amassed a lot of pension promises through their working years.  Pension funds must balance both equity and bond risk in their investment portfolios  and yet try to meet their assumed growth rates of 7% – 8%.  Caught on the horns of this dilemma, pension funds straddle both the equity and bond markets.  During the past ten years, many have become underfunded because they have not been able to match their projected growth rates.   This delicate balance of risk and reward sets the stage for a catastrophic decline in response to even a relatively small monetary shock because pension funds can not afford to wait out another three or four year decline.  Too many boomers will start cashing in those promises accumulated during the past decades.

The relatively low number of new jobs created in March was probably due to the severe winter in the eastern part of the country.  The BLS revised downward their previous estimates of employment gains in January and February.  Even with the downward revisions and this past month’s relatively anemic 126,000 gains, the average for the quarter is still about 200,000 per month, a particularly strong figure when one considers the impact that plummeting oil prices have had. In the first 3 months of this year, companies in oil and gas exploration have shed 3/4 of the jobs added during all of last year.  The strong dollar makes U.S. exports more expensive and hurts manufacturing.  The employment diffusion index in manufacturing industries dropped below 50, a sign that there is some contraction in the 83 industries included in this index.  However, March’s Manufacturing Purchasing Managers Index showed some slight expansion still and employment in manufacturing is still strong.  Across all private industries, the diffusion index remains strong at 61.4.

Fed chair Janet Yellen has repeatedly said that interest rate decisions will be based on data.  If the data of subsequent months show a resumption of strong growth, an interest rate increase at the FOMC meeting in late July could still be in the cards.  The CWPI composite built on the PMI anticipated a declining trend in growth this winter and spring before resuming an upward climb.  When the non-manufacturing  PMI is released this coming Monday, I’ll update that and show the results in next week’s blog.  Based on the numbers already released, I do anticipate a further decline in March then an evening out in April.  The particularly strong dollar  has cast some doubt on growth predictions, particularly in manufacturing. Both oil and the dollar have made sharp moves in the previous months and it is the rate of change which can be disruptive in an economy.

**********************

Unemployment

New claims for unemployment were the lowest since the spring of 2000, just as the bubble of the dot-com boom began to deflate.  As a percent of those working, this is the third time since WW2 that new claims have reached these very low levels.  The last two times did not turn out well for the economy or the stock market.

**********************

Oil

Going back through some old notes.  Here’s an October 2009 article where Deutsche Bank estimates the price of oil at $175 in 2016.  2009 was just about the time that newer techniques in horizontal drilling were being developed.  The fracking boom was just about to get underway.  Whether you are an investor or a second baseman, the future is tough to figure out so stay balanced, stay prepared and keep your knees bent.