The Haves and Have-Nots

June 29, 2025

By Stephen Stofka

Sunday morning and another breakfast with the boys as they discuss world events and persistent problems. The conversations are voiced by Abel, a Wilsonian with a faith that government can ameliorate social and economic injustices to improve society’s welfare, and Cain, who believes that individual autonomy, the free market and the price system promote the greatest good.

Cain smiled as he asked Abel, “You used to live in New York. So, are they getting ready to elect their first socialist mayor?”

Abel chuckled as he spread the linen napkin across his lap. “Mamdani is the Trump of the left. Knows how to work social media and promises he’ll make food and housing affordable again. Just like Trump. Neither one of them has a workable plan. Maybe that’s the age we live in. The age of blowhards on social media. Anyway, I wanted to ask you what you thought about the court’s decision this week. Can lower level courts issue nationwide injunctions? What’s the verdict, Mr. Court Watcher?”

Cain stared into his coffee cup then looked at Abel. “Well, I liked that part. Last year, Reuters did a study (Source). There have been almost 130 injunctions issued in the past sixty years. So, during the 1960s and 1970s, there were two injunctions. Two! Then it got political. Sixty injunctions during Trump’s first term. California judges were a go-to for Democrats.  Maybe twenty injunctions during Biden’s term. Republicans running to Texas judges. Now the Democrats have started again in Trump’s second term. It’s abusive tit-for-tat.”

Abel asked, “So you like the decision? How did it stand up to the famous Cain consequentialist rule?”

Cain held up his right hand, thumb down. “Failed. It confuses more issues than it clarifies. The court stayed Trump’s executive order for thirty days. Not a whole lot of time to get a class certification and a whole bunch of procedures (Source). A district judge can issue an injunction on the likelihood of class certification, but it only applies to the parties named in the suit (Source). Meanwhile there will be confusion everywhere. Confusion equals bad court decision in my book.”

Abel lifted his eyebrows. “A ‘Keep It Simple, Stupid’ approach. But this decision permits the White House to keep drafting unconstitutional orders then enforce them wherever there is no applicable injunction. I mean, this is a case where you can’t separate legal rules and procedures from the merits of the case, the Constitutional right to citizenship at birth.”

Cain frowned, then settled back as their food arrived. “Justice Sotomayor basically made that point in her dissent. The consequence of the court’s ruling is that the burden of protecting our constitutional rights falls on ‘we, the people.’”

Abel pursed his lips. “That’s expensive.”

Cain sighed. “It’s also depressing. Anyway, change of subject. We were talking last week about the One Big Beautiful Bill, the cuts to Medicaid.”

Able interrupted, “Oh yeah, why people vote against their best interests. What was that book?  What’s the Matter With Kansas? Thomas Frank.”

Cain nodded. “So you said you didn’t understand how Republican representatives could propose cuts to Medicaid that would hurt their constituents. I said that it was the principle of the thing and the huge costs to the states even after the cost-sharing with the federal government.. So, I was reading this week that some of the Republican members are concerned about the blowback from voters in the midterms (Source). “

Abel glanced at his phone. “Boy, I love this thing. My personal librarian. Last week, you made me aware of how much the states were spending on Medicaid. I did some digging this past week and I was surprised at how dependent we all are on Medicaid. It’s red states, blue states. Did you know that Medicaid finances 42% of all births (Source)?”

Cain shook his head. “Wow, I didn’t know it was that much. Now I’m remembering Romney’s remark about the 47% dependent on federal programs. He might have lost the 2012 election over that but maybe that’s what he was talking about.”

Abel frowned. “You know, when I think of poor rural states, Louisiana, Mississippi and Alabama come to mind. They have high percentages of  children who are covered by Medicaid. Like more than 60% in some cases. North Dakota is up there at 63%. Kansas and Iowa are above 50%. But there’s also blue states in that category. In Minnesota, it’s more than 60% and in Colorado it’s more than 50% (Source).”

Cain asked, “Colorado is a blue state? I thought it was purple.”

Abel shook his head. “Nah, they have a trifecta now. Governor, state House and Senate. All Democrat. In fact, most of the states have trifectas now, like almost 40 states (Source). Shows how polarized we are in this country. Forget about what happened to Kansas. What happened to divided government?”

Cain smiled. “For many years, that’s how I voted. I was against the Democrat, Republican duopoly. If Republicans held a lot of seats, I voted Democrat just to keep a balance of power. Groups get crazy when they have all the power. What did you call it? The monster in us. We start to uncage the monster. We want to enact revenge. We want what we want just to enjoy the power of getting what we want.”

Abel raised his eyebrows. “Wow, talk about dark. Well, you weren’t alone. I was reading that, in the 1970s, voters split their ticket like 30% of the time. That started to decline in the 1980s. Now, it’s less than 5% (Source).

Cain nodded. “Like I said last week, we’re in our silos. We got our political clubhouses with big signs that say, ‘Keep Out!’ That’s why I believe in the price system, supply and demand. Keeps people from getting their own way.”

Abel frowned. “You’ve talked about that before. I mean, how does a price system work in a democracy?”

Cain smiled. “I’ll talk about it another time. It’s simple. Most of us have social security numbers. Everybody living in a state votes, whether they cast a vote or not.”

Abel looked puzzled. “How would that work?”

Cain gave a Cheshire grin. “Not this week. Anyhow, back to Medicaid. So, I said last week that a lot of Republicans don’t respect dependency. It’s a bad word. That’s why they are against these big federal programs.”

Abel interrupted, “That’s  you.”

Cain nodded. “Yeah, but I’m not against dependency as such. We’re all dependent on each other in a lot of ways that we take for granted. That was Adam Smith’s point. My eggs here. Someone had to grow them, spread feed, and muck out the chicken coops. I appreciate that when I eat eggs. I’m connected to those farmers.”

Abel interrupted, “An illegal immigrant probably mucked out those chicken coops.”

Cain nodded. “Yeah, or the farmer’s kids before they went to school that morning. People who work hard. Eggs are under $3 a dozen now after the industry has recovered from the mass killing of chickens to stop the virus (Source). So, it’s like 25 cents an egg. That’s less than a minute of someone’s hourly wage, let’s say. So the farmer, the kids, or the illegal immigrant, as you point out, work their butts off and I get to buy an egg for less than a minute of work. A great deal.”

Abel set his water glass down on the table. “You put it like that, and I can understand the two different worlds perspective.”

Cain mopped up some egg yoke with his toast. “What were the two groups in the Time Machine story? The Eloi and I forget the name of the other group. In Wells’ book, they represented the working class of England (Source).”

Abel smiled. “The Morlocks. So, you’re saying that the Eloi are urban dwellers and rural people are Morlocks? That’s kind of stretching an analogy.”

Cain laughed. “No, not exactly. The Eloi are the ‘haves’ and the Morlocks are the ‘have-nots.’ That’s what I’m thinking. In any society, there are those two groups. That was Machiavelli’s point in the Republic. He thought the haves were the more dangerous group because they fought harder to keep what they had.”

Abel whistled softly. “Whoa. From Medicaid to political philosophy. Let me buckle my seat belt. Although, now that I think about it, that was a big cause of the Civil War. The plantation owners in the South wanted to keep on expanding. I was reading Alan Taylor’s book American Civil Wars and I was shocked to learn that Lincoln agreed to let the southern states keep slavery legal. This was even before the war started. His red line was no more expansion into federal territories or any new states. If the slave owners had agreed to that, would we have avoided a civil war? Anyway, the slave owners needed to expand to keep up the value of their slaves. New markets, new demand.”

Cain smirked. “A rich man’s war, for sure. Can you imagine paying a substitute to fight instead of your own son? (Source)”

Abel shrugged. “Reading that book, I could understand why we don’t learn a lot of that stuff in grade school. Too dark for grade school kids.”

Cain interrupted, “It’s the monster inside. So, you think the Republicans who vote for Trump’s big, beautiful bill are heartless?”

Abel replied, “No, I think that Trump is gambling that he won’t lose that much support from blue-collar workers even if those voters lose some or all of their Medicaid. These rural states showed strong support for Trump in the 2024 election (Source). They elect far more Republicans than Democrats to Congress (Source). It’s a political gamble. He’ll blame Democrats if he’s wrong.”

Cain frowned. “Yeah, but if that gives Democrats enough support to flip the House, they will try and block his agenda in the last two years.”

Abel shook his head. “He’s a gambler. He ran for President in 2016 to boost his brand. His businesses were failing, and he had trouble getting financing (Source). He didn’t think he had a chance to win the Presidency (Source). He admitted he didn’t know what he was doing his first term in office. He’s rolling the dice this term.”

Cain sighed. “Talk about the Time Machine. I wish I could get in a time machine and go to four years from now. Trump, Trump, Trump all the time. I kind of miss the days when we talked about who shot J.R. on the TV show Dallas, or something like that.”

Abel laughed. “I think there will be someone like Trump after Trump. Someone who knows how to maximize social media. Kyla Scanlon on Substack used the word ‘virality’ (Source). Someone who knows how to go viral. We talked about Mamdani earlier. He’s the same. Maybe that’s the new vanguard in the political arena. We will only elect people who get and keep our attention.”

Cain shook his head. “God, I hope not. So, we were talking about two groups, the haves and have-nots. I accept the fact that there will always be inequality in society. Life is multi-dimensional so it’s impossible to have equality. Each of us is like a soap bubble on an ocean wave. We’re all at different locations and elevations, different times in our lives.”

Abel raised his eyebrows. “That’s a good point, but I think a lot of us would like to reduce the growing economic inequality in this country. You think that these big government programs just aren’t very effective. That’s what you said last week.”

Cain nodded. “I think the data backs me up. The best way to reduce inequality is more economic growth. More jobs, more opportunities, more income. Democrats just focus on redistributing the profits. It’s like someone who spends all their time adjusting the heat vents in a home so that everyone feels comfortable. The problem is that Democrats don’t do maintenance on the furnace itself. Then the furnace breaks and no one has any heat.”

Abel chuckled. “Yet, economic growth is stronger under Democratic administrations. More job growth, lower unemployment, higher GDP growth (Source). Using your analogy, it’s the Republicans who don’t maintain the furnace. They make sure the gas valve is wide open. Low taxes, big investment. Republicans expect that the furnace will just keep running. Adam Smith’s Invisible Hand. The will of God, or something.”

Cain laughed. “Ok, you ran away with my analogy. You are watching too much Democratic propaganda. Under eight years of Obama, real per capita economic growth increased 11%. In Trump’s four years, it increased almost 7%. On an annualized basis, that’s better than Obama. Under Biden’s four years, it increased 8%. The big winners were Reagan and Clinton with 20% growth during their two terms (Source).”

Abel tapped notes in his phone. “You’re using per capita growth?”

Cain nodded. “Sure, that’s what people care about. If there is a bigger population, there will be higher overall growth. You have to divide by the population to get a sense of what people are experiencing in their daily lives.”

Abel nodded. “Ok, makes sense. The thing is, there was a lot illegal immigration during the Reagan administration. That’s why he agreed to grant amnesty in 1986 (Source). There was still high growth.”

Cain smirked. “And high deficits, don’t forget. Reagan had to work with a big spending Democratic Congress. And he needed to rebuild the military after the Carter administration.”

Abel laughed. “Sure, it was all the Democrats fault. For the first six years Reagan had a Republican Senate, don’t forget. Clinton raised taxes and there were actual budget surpluses and big growth. So Republicans are against illegal immigration and taxes but neither of those interfered with economic growth during the Reagan and Clinton administrations. So, what’s the secret sauce, professor?”

Cain grunted. “I’m just saying that Democrats need to focus on economic growth more than income inequality.”

Abel sighed. “You’re using per capita economic growth but that doesn’t capture the real effect of inequality on households since the start of Reagan’s first term.”

Cain shook his head. “No, remember we talked a little bit about this. The official measure of inequality doesn’t capture a lot of the income and benefits that lower households receive. In 2016, a Congressional Budget Office found a much lower GINI coefficient than the Census Bureau reported (Source). That lower figure was after taxes and government transfers were accounted for. The World Bank also computes a GINI coefficient that is closer to the CBO estimate (Source).”

Abel asked, “Does that include Medicaid or food stamps?”

Cain shook his head. “No. There is a lot of what’s called ‘in-kind’ support for lower income households that is not included in these inequality measures. Section 8 housing vouchers. The Census Bureau lists all the different types of income streams and which are counted (Source). Yet Democrats just throw these inequality figures around without acknowledging the subtleties.”

Abel interrupted, “Ok, I’ll admit that housing support can be sizeable. I had customers who paid maybe $300 for an apartment that normally rented for like $1500. Ok, go on.”

Glancing at this phone, Cain continued,  “Yeah, so that’s like almost $15,000 in after-tax income and it’s not counted. Food stamps or SNAP, they call it now, are not included and neither are school lunches. Medicaid, Medicare and employer health insurance are not counted (Source).”

Abel said, “So, I’ve been reading about all the horrible things Americans did to each other during the Civil War, and you’ve been digging up data. Ok, so how much was it before and after all these in-kind transfers?”

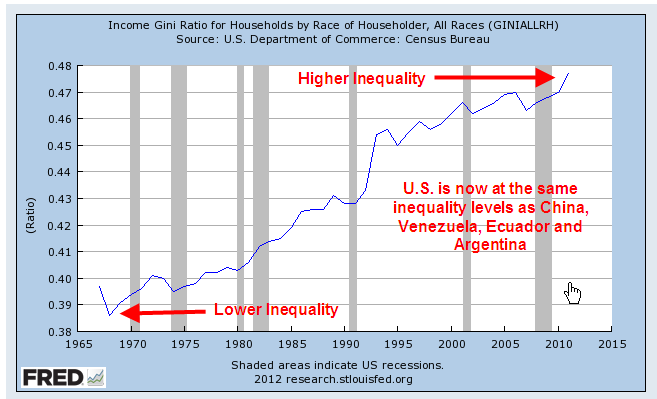
Cain replied, “Well, the GINI coefficient before those was .42. Lower numbers mean more equality of incomes.”

Abel interrupted, “What’s Mexico and Canada?”

Cain looked up at the ceiling, searching his memory. “Mexico is about the same as the U.S. Canada is low. Like 30 or so.”

Abel nodded. “Ok, so what was the GINI coefficient after including in-kind transfers?”

Cain shook his head. “I couldn’t find a GINI number for that. I mean, there are so many income measures. Before tax, after tax, with transfers, without, with capital gains and without. Survey data like the Census Bureau or figures from IRS tax records.”

Abel smiled. “Like you said, it’s complicated.”

Cain sighed. “Yeah. Some researchers have developed an ‘augmented’ income measure that adjusts a conventional measure called the ’90/10 ratio.’  You know, they compare the top 10% to the bottom 10%. One paper estimated a 30% reduction in that ratio in 2012 (Source).”

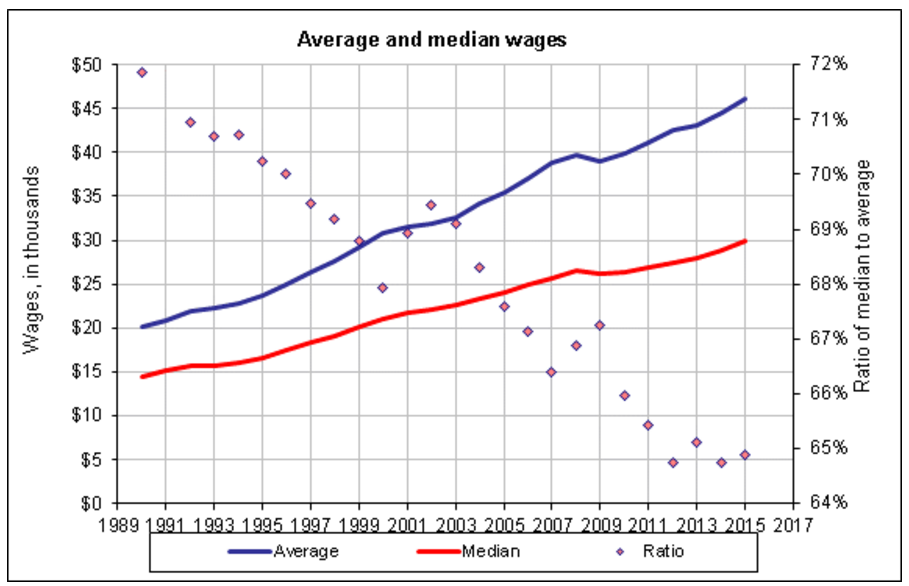
Abel smiled. “That sounds like a Bernie Sanders measure, comparing the very top and very bottom. What was the top compared to the middle? I’ve read that top incomes have been growing a lot faster than median household incomes.”

Cain squinted at his phone. “Geez, I need new glasses, I think. Hold on. Ok, that 90/10 ratio grew by a third between 1980 and 2018 (Source).”

Abel interrupted, “No taxes figured in?”

Cain shook his head. “No, just cash income. They do subtract capital gains. You know, they are trying to measure current year income (Source).”

Abel asked, “Ok, so do they compare the top and the middle?”

Cain expanded his screen with a flick of two fingers. “Yeah, it’s called a 90/50 ratio. So the top 10% has grown a lot. From 1979 to 2012, their incomes grew like 30%. The middle only grew by 7% (Source).

Abel nodded. “So that shows what I was talking about. The top has grown four times as fast as the middle in the past few decades. They are doing way better than the middle and yet the Republicans want to keep cutting taxes on the top. You’re saying that these inequality measures don’t include food stamps and housing vouchers and stuff like that. Well, the middle is mostly not getting those, so there’s no confusion. I mean, you can see the inequality in the data.”

Cain argued, “It’s a lot more complicated than that because the top 1% skew the comparison so much. If you dig into the income data for 2012, you find that the top 1% had 40% of the income in the top 10%. An income measure used by the Congressional Budget Office shows that the top 1% now have almost 14% of total income. That’s almost tripled (Note).”

Abel argued, “Ok, so what’s the 99/50 ratio, I guess it would be called. What’s that?”

Cain sighed. “The BEA didn’t have that.”

Abel sighed. “You seem skeptical about the accuracy of the measures themselves.”

Cain replied, “I am. The GINI coefficient jumped up like 6% in two years during a slight recession in 1990 and 1991. That tells me there was some change in the categorization of incomes, some anomaly in those years. During the Great Recession, that coefficient only dropped 2%. Like I said, there’s something doesn’t make sense about that jump in 1990.”

Abel said, “I want to do some research on poverty, but I suspect I’m going to run into the same problem. A lot of different income streams and measures of poverty?”

Cain nodded. “Exactly. The Census Bureau uses self-reported income, and several studies have found that lower income households underreport their income. One study compared self-reported income to actual Social Security checks sent to the people in the study and found that their reported income was lower than what they actually received (Source).”

Abel asked, “How much lower?”

Cain shrugged. “Well, it wasn’t a lot, like 7-8%.”

Abel replied, “So, slight underreporting of lower incomes. That’s not going to change the picture all that much. Income inequality is still a problem. Maybe a little bit less, but not a whole lot.”

Cain smiled. “I can see that I haven’t convinced you to focus on economic growth.”

Abel argued, “I think you are taking some slight imperfections in measurement and using that to cast doubt on the whole idea that inequality is a big problem in this country. During the Clinton years, taxes were raised on higher income families and that basically stopped the growth of inequality under Reagan and H.W. Bush (Source). Republicans just keep fighting any Democratic effort to reduce inequality through higher taxation.”

Cain shook his head. “Clinton was an anomaly. A lot of investment poured into the tech sector and stock prices tripled during Clinton’s eight years (Source). The result of that was a lot of capital gains taxes. It was an anomaly. Normally, higher taxes hurt economic growth. End of story.”

Abel let his head fall. “If we can’t resolve the disagreements in this country with the available data, what hope is there? I think of the story of the blind men touching different parts of an elephant and trying to identify it. If one person is convinced it’s a snake they will just keep searching the animal for a trunk then reason that the snake ate a big meal and is lying on a table with four stout legs.”

Cain laughed. “It’s like our brains are tuned to specific types of information. You know, the way our eyes see the world differently than birds or dogs.”

Abel said, “Well, nice data hunt this week. I just wish you would look at things the correct way. You bought last week. I’ll pick it up this week.”

Cain smiled. “Well, if you are buying, then I totally agree with you. See you next week.”

///////////////

Image by ChatGPT

Note: Clarke, C., & Kopczuk, W. (2025). Measuring Income and Income Inequality. https://doi.org/10.3386/w33678

Chasing the Why

May 25, 2025

By Stephen Stofka

This is part of a series on persistent problems. The conversations are voiced by Abel, a Wilsonian with a faith that government can ameliorate social and economic injustices to improve society’s welfare, and Cain, who believes that individual autonomy, the free market and the price system promote the greatest good.

Cain said, “We left off last week talking about the strong correlation between personal income and life expectancy in the U.S.”

Abel looked up to the acoustic ceiling tile as he searched his memory, then looked at Cain. “I think it was .85 across the states.”

Cain glanced down at his phone. “I wondered how strong the correlation was among developed countries. It’s not pretty. Mexico and the U.S. are the only two countries below 80 years life expectancy. Oh wait, and the Slovak Republic, what people call Slovakia.”

Abel asked, “Is that where Melania Trump comes from?”

Cain shook his head. “No. Her family is from Slovenia, another central European country. Slovakia is the eastern half of what used to be Czechoslovakia. A fun fact. They are not a top producer of automobiles, but for the size of their population, they have the world’s largest auto manufacturing per capita (Source).

Abel asked, “How small is their population?”

Cain replied, “About 5.4 million. So, a little less than Denmark. Well, I started digging into auto production figures for the other two countries with relatively low life expectancy.”

Abel spread some honey on his toast. “What, like there’s a link between auto production and life expectancy?”

Cain shrugged. “I don’t know. Environmental hazards? Just wandering around in the data maze. Never know what I’ll find. I was surprised to find that the U.S. and Mexico have about the same auto production per capita. Not the same overall. Just per capita. Volume wise, the U.S is the number two producer in the world (Source).”

Abel asked, “Who is #1? China?”

Cain nodded. “Yeah, they produce three times what the U.S. does. Of course, they have four times the population. Anyway, I looked at what has happened to auto production in the U.S. We are producing the same amount of vehicles as we did thirty years ago (Source). Meanwhile, the population in this country has grown 30%.”

Abel raised his eyebrows. “And Trump is going to restore that imbalance with tariffs somehow?”

Cain smirked. “All presidential candidates overpromise. Trump’s not the only one. In a deep housing and financial crisis, Obama promised to do what was best for working class families like the grandparents who raised him. What a bunch of B.S. that was. He did what was best for the banks and broker bonuses as millions lost their homes and most of their net worth.”

Abel sighed. “I don’t think most presidential candidates understand the forces that control the energy in this country. Trump says it’s the deep state. It’s the deep everything. The deep oil and gas industry, the deep defense industry, finance, healthcare, education and the tech ‘bros.’”

Cain laughed. “Good point. And they all have their lobbyists in Washington. It’s the swamp and its deep.”

Abel smiled. “And each president promises to clean up some part of that swamp. Then the gators in the swamp get a hold of their ankle.”

Cain shook his head. “I think it’s us the gators get a hold of. The politicians always seem to get away somehow.”

Abel grunted. “Too true. Anyway, so get back to life expectancy across developed countries.”

Cain replied, “Oh, yeah. So, the correlation between income and life expectancy across developed countries was not as strong the correlation between states, but it was still a moderately strong .6 (Source). I thought GDP growth would help produce better health outcomes and life expectancy, but no.”

Abel asked, “What if a lot of Americans are not benefitting from that economic growth? Too much inequality? We were comparing the U.S. and Great Britain last week on obesity in school kids. Great Britain has a much lower GINI coefficient than the U.S. so incomes over there are more evenly distributed (Source).”

Cain asked. “That measure includes transfer payments in income, right? Pretax or after tax?”

Abel nodded. “Yeah. It includes Social Security, Medicare, Medicaid and supplemental income. Any income that doesn’t involve an exchange of goods or services (Source). The OECD tracks both before and after tax. England has the same GINI index as the U.S. in pre-tax income, but their tax system reduces inequality more than the U.S.”

Cain shrugged. “What’s the GINI for Mexico?”

Abel flicked a finger across his phone. “Wow. The same as the U.S. after taxes. Boy, I thought we would be better than Mexico. Let’s see, what about Slovakia? No, that breaks the trend. They have an even lower GINI index than Great Britain, so more equality, and a low life expectancy as well.”

Cain smiled. “Every time I think, ‘that’s the key indicator,’ the data throws me a curve.”

Abel said, “So far what we are seeing is that average income has a strong influence on life expectancy but not the distribution of income. Is that the secret sauce to longer life expectancy? Raise average incomes?”

Cain replied, “It’s not that simple. We have a high income but relatively low life expectancy. But comparing the U.S. and Great Britain over time was interesting. Forty years ago the two countries had the same life expectancy. Since then the U.S. has averaged 3.6% real GDP growth (Source). That means that real GDP doubles in 20 years. Great Britain, on the other hand, has had only 2.5% annual growth, so it takes like 28 years for their GDP to double. Yet improvements in U.S. life expectancy have been far lower than Great Britain over that time.”

Abel asked, “What about healthcare spending? Inefficient overspending on healthcare and the military increases GDP. Any insights there?”

Cain sighed. “Well, you have a point there. The U.S. spends the highest amount of developed countries on healthcare, almost double the average (Source).”

Abel replied, “So other countries are spending less and getting better health outcomes. The public-private partnership in U.S. healthcare is not working and is not efficient. Are you ready to endorse universal health care?”

Cain smiled. “Them’s fighting words. Mexico has universal health care and it’s life expectancy is worse than the U.S. The same story for Slovakia.”

Abel argued, “Yeah, but Mexico and Slovakia are both rated poor in healthcare quality and innovation. The U.S. has good quality health care and the highest innovation ranking, but poor access and a fiscally unsustainable system (Source). Quality healthcare has to be accompanied by easy access to care. Will you agree with that?”

Cain frowned. “On the face of it, yes, but there are all these other factors we’ve looked at. This is a big country.”

Abel asked, “Ok, what about population density? There was a .5 correlation between life expectancy and density among the states.”

Cain nodded. “That was weird. It was the same between countries, so density has some effect on life expectancy, but the stronger factor was income.”

Abel frowned. “That’s surprising. In many European countries, the government provides healthcare so income should be a weaker factor.”

Cain replied, “The contradictions in these indicators drives me nuts. That’s why I say it’s too complicated to point to one or even two factors and say, ‘fix these and you’ll fix the problem.’”

Abel argued, “Well, we can’t sacrifice the good for the perfect.”

Cain studied the pancake on his fork for a moment. “I want simplicity. I dream of a society where we make clear rules, a society where people play by the rules.”

Abel laughed. “I was reading a book by David Graeber this week called The Utopia of Rules. He says it’s a wish that many of us have. You know, everybody knows and plays by the rules and those who play by the rules can win.”

Cain lifted his eyebrows. “Yeah, it seems like it’s the cheaters who win. That was the bitter truth that many of us learned during the financial crisis. No accountability for the cheaters.”

Abel argued, “Even before that. No accountability for actions in the Iraq war. Abu Ghraib. Hollywood had constructed a noble portrayal of American soldiers in combat. John Wayne. Gregory Peck and the like. Torturing prisoners was something the North Koreans and Chinese did. Not American soldiers.”

Cain sighed. “A reminder of Vietnam? Something’s happened in the past few decades. I’m still trying to get my head around it.”

Abel replied. “Graeber talks about sovereignty, something we normally associate with countries. In the post-Watergate consensus, Congress put constraints on the president. That’s changed in recent decades after 9-11, when Congress began to defer to the president. As Graeber notes, presidents can now order people assassinated, extradite prisoners of war to places where they can be tortured. They can conduct surveillance on ordinary citizens with flimsy pretext and sporadic oversight.”

Cain leaned back in his seat. “In Trump v. United States (Source) last year, the court conferred legal sovereignty on a president. A former president has absolute immunity for ‘official acts,’ although the court declined to define those. They used a previous 5-4 decision in Nixon v Fitzgerald holding that a former president had absolute immunity against civil litigation for damages.”

Abel argued, “But Trump v. United States was a criminal matter, not civil. The court just expanded the scope of the previous decision. I mean, this court has overruled previous court precedents about abortion and gun rights made during the 1970s. Then they base their ruling on a closely decided case in 1982?”

Cain nodded. “They created a radical expansion of presidential immunity, then didn’t have the backbone to establish any limits on official acts. I mean, Fitzgerald was a civil case about back pay and wrongful employment termination, not trying to overturn an election. To use that as a basis for their decision indicates just how arbitrary the conservative justices have become.”

Abel argued, “They might say that it is incremental jurisprudence.”

Cain smirked. “Incremental policymaking is a hallmark of our political system. That’s what these conservative justices have become. Activist politicians.”

Abel raised his eyebrows. “Why did you vote for him?”

Cain took a deep breath. “You keep asking me that. The better of two bad alternatives. Why did you vote for Harris?”

Abel laughed. “The better of two bad alternatives.”

Cain replied, “I thought that there was still a Republican Party that would restrain Trump’s impulses. The party is gone. Only the nationalist radicals and hesitant members remain. The name is an empty shell.”

Abel said, “Last week, you mentioned activist courts and an activist executive branch. I don’t attach much meaning to the word. If people don’t like certain policies they attach the word “activist” to whoever made the policy.”

Cain shook his head. “You’re right. A lot of people do that. I mean it in the sense that some political actor makes a rule that makes it likely there will be more rules to refine that first rule.”

Abel argued, “We’ve got a complex society managed by a big bureaucracy. The proliferation of rules is inevitable.”

Cain took a sip of coffee. “Those are procedural rules. What I’m talking about is something different. ‘Principle’ would be better rule. Like sailors back in the old days using the north star as a guiding rule. Then they had a bunch of procedural rules to help them keep to that guiding rule.”

Abel interrupted, “You said political actors made the rule. So you’re not talking about some rule made at an office meeting.”

Cain nodded. “Right. The Supreme Court’s Heller decision in 2008 established an individual right to have a gun (Source). Since then there have two more decisions. McDonald in 2010 extended that right to include the states. The Bruen decision in 2022 ruled that gun laws could no longer use state interests as a balancing test. They had to be consistent with historic tradition. Three cases in fourteen years made it to the Supreme Court? That indicates that the Heller decision was not a well constructed principle. Of course, that applies to a lot of laws.”

Abel replied, “So compare that to Roe, the abortion decision in 1973. The Casey decision in 1992, then Gonzalez in 2007. That’s 34 years for two refinements.”

Cain nodded. “Someone could argue with the reasoning in Roe, but the length of time between refinements of the rule indicates that it was a well constructed rule, as rules go.”

Abel continued, “Maybe I’m not clear on the distinction. If the precedent or outcome of a rule is flawed, how can it be a good rule?”

Cain smiled. “A rule should be clear. It should have as few exceptions as possible.”

Abel looked doubtful. “That’s unreasonable. Take, for example, the rule against killing. There are lots of exceptions. War, self-defense. Is abortion an act of killing? Depends on your definition. Hunting animals? Isn’t that killing? This is the real world. It’s complicated.”

Cain smirked. “Of course it is. I said, ‘as few exceptions as possible.’ I didn’t say ‘no exceptions.’ When lawmakers make rules, they should ask themselves, ‘Does this rule invite a lot of exceptions? How can I change the wording of the rule to reduce exceptions?’ It’s just a principle to keep in mind.”

Abel asked, “So give me an example of a rule that you like as a rule, even though you might disagree with the reasoning.”

Cain barely paused. “The DOGE cuts. The rule was simple. Cut anyone who had less than a year’s employment, I believe. While the rule was clear, it produced undesirable outcomes. They had to hire some critical people back. We won’t know the full impact of the DOGE cuts for a while.”

Abel nodded. “They will cover up the mistakes. That decision was more a programming rule. Code in a criteria and get a list of employee names, then give them notice. Can you think of a law, like something that a legislature deliberated over?”

Cain stared into his coffee cup as though it held the answer. “How about a so-called bathroom bill? They are clear. Only people of a particular sex as listed on their birth certificate can use a single sex bathroom (Source). I might sympathize with people who are struggling with their gender identity. But the language of the bill is clear.”

Abel shook his head. “That, to you, is a good rule? How many of us carry our birth certificates with us when we use the bathroom? It has an impractical condition.”

Cain nodded. “But that’s not what I’m talking about. That’s the distinction. The language of the bill itself is clear. Take for instance the 1972 Clean Water Act. It gave the EPA regulatory power over the ‘waters of the United States.’ Courts and agencies have been fighting over that term and its, let’s see, boundaries for decades. What does that term include and exclude? A clear rule has terms in it with good boundaries.”

Abel frowned. “The Supreme Court often asks what is the limiting principle.”

Cain replied, “Yeah, a good defining characteristic.”

Abel asked, “So you don’t like the term ‘general welfare’ in the Constitution.”

Cain smiled. “You’re right. I don’t. The anti-Federalists at the Constitutional Convention didn’t like it either.”

Abel nodded. “Right. Yeah, Michael Klarman discussed that in his book The Framers’ Coup.’ Did you ever think that politicians might purposely choose a term that has no clear boundaries? It’s the only way that lawmakers can agree on something. The astronomer Carl Sagan once said that people find agreement when they use a broad term like ‘God,’ which encompasses a lot of different concepts (Source).”

Cain nodded. “Good point. It’s a way of kicking the can down the road. It signals that lawmakers wanted to complete some law, to claim an accomplishment when there were still parts not done. So they take the undone stuff, the stuff they can not agree on, and slap a label on it, like ‘general welfare’ or ‘waters of the united states.’”

Abel set his glass of water down. “Those conservative justices who use a textualist approach to analyze a case may be looking at text that was written using ill-defined terms, terms without clear boundaries, to use your term. The textualists claim that their approach is grounded in empirical evidence, but the evidence itself, the text of the law, lacks definition.”

Cain smiled. “I like that connection. It shows the limits of any judicial interpretation.”

Abel replied, “So let’s get back to activist policies. You sounded fed up last week.”

Cain nodded. “Yeah, Democrats are activist. That’s their brand. A hallmark of the Republican Party used to be a certain policy restraint, a prudent caution. No more. It’s so disappointing and it leaves a lot of voters like me in a political limbo. Neither party represents our approach to governing. You know, quit meddling. This tariff business is meddling in the extreme.”

Abel raised his eyebrows. “It was a Republican president and strongly Republican House and Senate that initiated the Smoot-Hawley tariffs in 1930. They imposed tariffs on more than 20,000 goods.”

Cain interrupted, “And imposed no tariff or low rates on a lot of goods. As I said, the hallmark of a badly constructed rule is a lot of exceptions.”

Abel continued, “Ok, the tariffs were activist policymaking by Republicans who held the Presidency and strong majorities in the House and Senate. The Republicans are all about restraint. They restrain free trade, individual choice, government support of child care, to name a few.”

Cain smirked, “Like the Democrats don’t do the same. Restrict guns, oil and gas drilling, dictate to automakers the kinds of cars they can produce. I mean, it’s the Democrats who created the bureaucratic state. All that rule-making limits choices.”

Abel laughed as he slid out of the booth. “Ironic. In his book, David Graeber writes about a paradox. He calls it the Iron Law of Liberalism. When a government tries to promote the free market, it often creates even more regulations. In their own way, both parties are guilty of making too many rules, of creating bureaucratic tangles.”

Cain looked up at Abel. “I wish we could change that somehow. See you next week.”

Abel gave a short wave. “I’ll pick up the check. Till next week.”

////////////////////

Image by ChatGPT

Choice and Chance

October 22, 2023

by Stephen Stofka

This week’s letter is about income and wealth distribution. I’ll take a look at a recent report on those topics through the lens of a  perspective first proposed 70 years ago by a Nobel economist.

This past Wednesday the Federal Reserve released the triennial 2022 Survey of Consumer Finances, or SCF. Gains in household wealth (assets less liabilities) were much more widely distributed than gains in annual income. Real median household net worth increased 37% while its cousin, the mean or average, increased only 23%. Remember that these are percentage gains and percentages depend on the base, or divisor.

A $1 million net worth household with a gain of $200,000 in net worth experiences a 20% increase. A household starting from half that net worth, or $500,000, might have a gain of $150,000 which represents a 30% gain. The second household has experienced a smaller monetary gain but a higher percent gain.

This recent Fed survey found that the median increase was higher than the mean increase, indicating that the increases in wealth were widely distributed. Government support programs during the pandemic helped households reduce their debt levels. Double digit increases in home prices raised the primary asset that is the cornerstone of household wealth. Median net housing values (appraisal value less outstanding mortgage) rose by 45% in the three years between surveys the report found. Gains in income, however, did not exhibit the same equanimity.

I’ll be mentioning top half and bottom half of households a lot in the next sections so I will just refer to them as the Uppers and Lowers. Income gains were not widely distributed. Real median household incomes rose by 1% in each of the three years, but real mean incomes rose by 5% annually. The income gains went to the Uppers and a college degree was a consistent characteristic of the Uppers. Our specialized workplace puts a premium on education. During the period 2019-2022, the retirement account balances of the Uppers rose while those of the Lowers fell. 

Half of Upper households owned their own business but only 1 in 7 of Lower households did so. Let’s visit a paper written by Milton Friedman (1953) called Choice, Chance, and the Personal Distribution of Income. Remember those two words: choice and chance. Friedman remarked “every enterprise in our society is in part an arrangement to change the probability distribution of wealth” (p. 281). Large or small, a business owner takes risks to increase the chance of reaping more income. If an employer cannot sell what their employees produce, the employer’s profit is reduced or disappears entirely. Eventually that business goes out of business.

In his own imaginative way Friedman examined the relationship between employer and employee. An employer makes a profit from the work of an employee in return for the promise of a wage. To the employee, a wage reduces income uncertainty. Friedman reasoned that the calculation of a wage must include an implied premium like that of an insurance policy. Included in an employer’s profit is the price of an insurance policy that the employer sells the employee who desires income certainty.

Friedman pointed out that there is an element of preference in an employee’s decision to work for an employer. He challenged the simplicity of the conventional narrative that the Lowers had, by chance, lacked access to inherited wealth and natural endowments. Friedman constructed a more complex mechanism of income distribution that involved the choices that people made to reduce risk. Yes, those choices might be bounded by the resources available to a person. Their circumstances might induce a preference for certainty but it would be a mistake to disregard the choices that people made as they sought safety in their lives. Imagine a single woman who is the sole provider for two children. For the sake of her children, she needs the certainty of a wage income and is more likely to choose a steady paycheck from an employer rather than start up a business.

On a macro scale, Friedman pointed out that a society makes choices that make it more or less likely that individuals will prefer certainty. If more individuals choose the certainty of wages and there are fewer employers to provide that certainty, employees will be paying higher insurance premiums, i.e. lower wages, to employers in return for that certainty. That is a prediction conforming to the law of supply and demand. Inevitably that will lead to growing income inequality. To make that distribution more equal, a government will have to adopt redistributionist policies that tax employers, essentially stripping away part of the insurance premium and returning it to employees.

Changing mores and welfare policies in the 1960s supported individual independence but inadvertently promoted the growth of a vulnerable demographic. These were single head of households, mostly women, who would be less tolerant of uncertainty. While our society championed the new emphasis on personal freedom, many individuals were becoming less free in their economic circumstances and choosing the certainty of wages rather than risk the unpredictability of business profits. Since the late 1960s, income inequality has grown steadily.

If Friedman’s perspective had some predictive power, economic crisis and redistributive government policies should induce more people to desire certainty. That reach for safety should lead to a decrease in small business startups, enabling employers to pay lower wages to employees seeking income certainty. Does the data support Friedman’s hypothesis? I will look at historical SBA data for businesses with fewer than 20 employees to keep the analysis consistent (see Note). I will call them Smallees, or little small businesses. I will compare the ratio of such businesses to the number of employees in the country.

In 1988, there were 4.4 million Smallees and 105.4 million employees, a ratio of 4.2 Smallees per 100 employees. In 2006,  there were 5.4 million businesses and 136.4 million employees, resulting in a ratio of 4 businesses per 100 employees. Then came the financial crisis and a slow recovery. In 2019, the year before the pandemic, there were the same 5.4 million Smallees and an employee count of 150.8 million, a ratio of only 3.6 small businesses of this size per 100 employees. Perhaps Friedman had an insight into human behavior after all.

Friedman’s talent was his ability to communicate a change of perspective to his colleagues, his readers and the audiences of his popular lectures. He consistently focused on choices that people make in their personal lives and within the institutions where they work. Friedman concluded that “the foregoing analysis is exceedingly tentative and preliminary” (p. 289) and noted the faults in the simplified model he had presented. The implications of his thought experiment could have undermined a central assumption in neoclassical economics: that workers are paid the marginal product of their labor. More on that next week.

///////////////////

Photo by Alexander Schimmeck on Unsplash

Keywords: income, choice, chance, small business, income distribution, income inequality

SBA Note: The SBA’s definition of a small business varies with business revenue and number of employees. A micro business is generally one to four employees. Businesses with more than 100 employees is considered a medium business. A small business is in between. The agency used to track businesses with 20 – 49 employees and those with 50 – 49 employees as two distinct groups but now groups them together.

Friedman, M. (1953). Choice, chance, and the personal distribution of income. Journal of Political Economy, 61(4), 277–290. https://doi.org/10.1086/257390

Experimental Philosophy

March 21, 2021

by Steve Stofka

At a Senate Banking Committee hearing this week Senator Tim Kane presented a comparison of two philosophies of governing. Without any Democratic support, Republicans passed the Tax Cut and Jobs Act (TCJA) in December 2017. Prior to its passing, the non-partisan Congressional Budget Office estimated the loss of revenues at $1.5T over ten years. After two years of data, they revised their estimate of lost revenue to about $1.8T. The bulk of the benefits go to the top 20% of incomes. Without any Republican support, Democrats passed the American Rescue Plan (ARP) two weeks ago. Its estimated cost is $1.9T over ten years. This bill will benefit the bottom 60% of income earners. Two plans, two philosophies, similar costs.

Tim Kane suggested that we are having a real-world experiment. Both laws are projected to cost the same amount. Economists already have performance metrics on the Republican law from 2018-2019, the two years before Covid.  In 2023, economists can compare performance and benefits of ARP which exemplifies the Democratic philosophy.

The essence of the Republican philosophy is an assumption that income and benefits will “trickle down” from the top 20% of income earners, the wealthy in America. After three decades of Republican rhetoric that income should trickle down, many economists find the opposite trend. Those at the top get wealthier.

The Gini coefficient is a measure on equality/inequality. 0 represents perfect equality, 1 represents perfect inequality. In 1972, the Gini coefficient for household income in the U.S. was .4. In the fifty years since, that coefficient has risen to .48 (FRED Series GINIALLRH), near the mid-point of the equality/inequality range. An economic analysis can only confirm what many Americans sense intuitively; life is getting easier for the wealthy and harder for the middle and working classes.

The Republican philosophy espouses tax cuts and a strong defensive posture around the world which has led to a constant state of war. Former President Trump had to fight his own party to cut back troop commitments in Iraq and Syria. These twin goals – a larger military and tax cuts – are incompatible and have caused bigger deficits than Democratic administrations over the past forty years. Republican voters care about deficits so Republican politicians continue to pay homage to the idea despite their poor performance on that count. Republican politicians counter that it is the Democratic benefit plans that cause deficits, not Republican military spending and tax cuts.

Democrats champion more benefits and higher taxes on high income earners to pay for the benefits. Most of those high-income earners are in solidly Democratic states, not Republican political strongholds, so there is little advantage to Republican resistance to higher taxes. Republicans are opposed to higher taxes on principle, not politics. They believe that there are few legitimate functions of central government under Federalism: 1) provide a common defense and make treaties, what John Locke called a Federative power in his Second Treatise of Government, 2) resolve disputes between states, 3) preserve property and individual freedoms. The several other functions like coining money and post offices can be found in Article 1, Section 8 of the Constitution.

The heart of the dispute between Republican and Democratic voters lies in their different interpretations of the General Welfare clause of that section, i.e., that Congress shall have the power to “provide for the common Defence and general Welfare of the United States.” Democratic voters believe that phrase means Congress should provide for the welfare of the people in each state. Republican voters believe that it applies at the state level. In interpreting the Second Amendment, Democrats and Republicans switch; Democrats think gun rights apply to state militias while Republicans think those rights apply to individuals.

These are long standing arguments and opinions that resist change, despite the experimental data. I agree with Tim Kane that we have a chance to compare economic philosophies. I disagree that the results will change many minds. We don’t like to change our habits or opinions.

//////////////

Photo by Bermix Studio on Unsplash

Minority Control

October 13, 2019

by Steve Stofka

On September 15, 2008 the trading firm Lehman Brothers declared bankruptcy. A small number of outstanding shares traded on the stock market that day. The SP500 lost almost 5% of its value. New Yorkers gathered in Times Square to watch the ticker tape display. A small number of people controlled the direction of the market and constructed a reality that they sold to the rest of us.

In politics, a few key people control the direction and fate of legislation. In the Senate, the Majority Leader decides whether to bring legislation up for a vote. Even if a bill makes it out of a Senate committee, the Majority Leader can stop it from reaching the full Senate.  Unlike the Majority Leader in the House, his position is practically impregnable. Legislation vetoed by the President can be overridden by Congress. There is no recourse to a veto by the Senate Majority Leader.

The current holder of the position is Sen. Mitch McConnell from Kentucky. He is up again for re-election next year. When Democrats held the Senate, Sen. Harry Reid ruled with a similar disregard for others in his own party as well as the minority.

In 2014, 800,000 voters chose McConnell. In effect, less than 1% of the country’s voters control the course of legislation in the U.S. Did the founders of this country intend that one person should control Congress? James Madison, the chief crafter of the Constitution, worried that a majority would overwhelm and take advantage of a minority (Feldman, 2017). Accordingly, the Constitution is structured so that a minority controls power. However, one person is a very small minority. What would the founders think of the current arrangement in Congress? If Americans wanted a king with veto-proof power, America would still be a colony of Britain.

Our method of electing a President is a 230-year-old compromise between republicanism and democracy. An electoral college composed of men not subject to the passions of the crowd would elect the leader of the country. It was an Enlightenment model of dispassionate rationality.

Even if they had Fox News and CNN on Election night at the time of the founding, all the thirteen states were in the same Eastern time zone. At a recent symposium on our election, former RNC chair Michael Steele pointed out the west coast states are mostly taken out of the Presidential election (C-Span.org, 2019). By 5 P.M. Pacific time, they are discouraged from voting because much of the action has already been called. The founders did not design a system for four time zones.

We have 50 states but the election for President takes place in eight to twelve battleground states. Most polling is done at the national level, not in the battleground states. Many polls do not accurately survey the sentiments of the critical minority of voters in the states that will decide the election.

A minority of people own and control much of the wealth of the world. They now pay a lower percentage of their income than the bottom 50%. That includes federal, state and local taxes. In the Triumph of Injustice, due to be released next week, authors Saez and Zucman (2019) tally up the tax bills for the rich and ultra-rich. The book is #1 bestseller at Amazon and it hasn’t been published yet.

In 1980, the top 1% paid 47% of their income in total taxes at all levels. Now they are down to 23% and below the rate paid by the bottom half of incomes. Two sets of rules – one set for the peasants and one for the castle royalty. The Constitution prohibits the granting of titles so the rich granted themselves the titles. This book is sure to get a lot of media attention. Like we need more controversy.

Notes:

Feldman, N. (2017). Three Lives of James Madison: genius, partisan, president. [Print]. New York: Random House.

C-Span.org. (2019, October 7). National Popular Vote Election, Part 2. [Video]. Retrieved from https://www.c-span.org/video/?464997-2/national-popular-vote-election-part-2

Saez, E. & Zucman, G. (2019) Triumph of Injustice: How the Rich Dodge Taxes and How to Make Them Pay. [Print]. Available for pre-order at https://www.amazon.com/Triumph-Injustice-Rich-Dodge-Taxes/dp/1324002727

Effective tax rates: If you make $100,000 and you pay $25,000 in federal, social security, state, sales and property tax, then your total effective tax rate is 25%.

Photo: WyrdLight.com [CC BY-SA 3.0 (https://creativecommons.org/licenses/by-sa/3.0)%5D Page URL: https://commons.wikimedia.org/wiki/File:Bodiam-castle-10My8-1197.jpg

Years Past

December 31, 2017

by Steve Stofka

This past week, I found a July 2008 Wall St. Journal used as shelf liner. On the eve of 2018, a look back has some useful reminders for a casual investor.

Journal20080703

Most of us remember the financial crisis that erupted in September 2008. What we may not remember is that the first half of that year was very volatile. In reporting about the first half, there were “warnings of the collapse of the global financial system.”

In the first six months of 2008, 703,000 jobs had been lost. The job losses continued until March of 2010 and totaled a staggering 8 million. In early July 2008, the stock market had lost 16% from its high mark in October 2007 but a balanced portfolio of 60% stocks and 40% bonds had lost only 8%. To prepare for a difficult second half of 2008, investors were cautioned to:
1) Balance
2) Diversity
3) Spend less and invest more
4) Don’t pay high investment fees
5) Don’t get greedy and chase get rich investments

The advice is timeless.

/////////////////////////

Tax Reform

In a holiday week, thousands of residents in coastal states lined up at their local tax assessor in order to pre-pay 2018 property taxes in 2017.  Most of these residents have annual property taxes that exceed the $10,000 cap on all state and local taxes that can be deducted on 2018 Federal taxes.

The IRS said that they would not allow deductions for prepaid taxes unless the local district had assessed the tax by December 31, 2017.  We may see lawsuits over the definition of the word “assess.” When is a homeowner assessed a property tax?  When they receive a bill?  When the district announces the rate for the following year?

In their battle against the IRS, Republicans have cut the agency’s funding so much that the IRS does not have the resources to perform audits on several hundred thousand to determine the status of assessment.  The courts will likely weigh in on the question.  Come next November, voters will register their opinions.

The New York Times featured a several question calculator  to estimate the effect of the tax bill on your 2018 taxes.

///////////////////////

Income

Economists have noted the decades long decline in inflation-adjusted wages.  Since 1973, the share of national income going to wages and salaries has declined by 14%.

WagesSalariesPctGDI

Employee benefits as a percent of gross domestic income have grown by a third since the 1970s. Of course, a person cannot spend benefits.

BenefitsPctGDI

Even after the increase in benefits, total income is down. In 1973, 50% of Gross Domestic Income (GDI) went to wages and salaries + 7.5% to benefits for a total of 57.5%. In 2016, 42% went to wages + 10% to benefits = 52%.  Total compensation is down 10%.

As the wealth of the affluent continues to grow, the ratio of net wealth to disposable income has reached an all-time high.

WealthPctInc
It is inevitable that extreme imbalances must revert to mean.  The last two peaks preceded severe asset repricings.

Circumstance

May 21, 2017

Last week I mentioned the 20 year CAPE ratio, a modification of economist Robert Shiller’s 10 year CAPE ratio used to evaluate the stock market. This week I’ll again look at equity valuation from a different perspective.  The results surprised me.

The date of our birth is circumstance.  When we retire is guided by our own actions and the circumstance of an era. We have no control over market behavior during the twenty year savings accumulation phase before we retire or the distribution of that savings during our retirement.   Let’s hope that we live long enough to spend twenty years in some degree of retirement.

The state of the market at the beginning of the distribution phase of retirement can have a material effect on our retirement funds, as many newly retired folks found out in 2008 and 2009.  Some based their retirement plans on the twenty year returns  prior to retirement.

I’ll use the SP500 total return index ($SPXTR at stockcharts.com or ^SP500TR at Yahoo Finance) to calculate the total gain including dividends. The twenty year period from 1988 through 2007 began just after the stock market meltdown in October 1987 and ended just as the 2007-2009 recession was beginning in December 2007. The total gain was 742%, or 11.3% annualized. Sweetness! Sign me up for that program.  Those high returns led many older Americans to believe that they didn’t need to accumulate more savings before retirement.  Then came the double shock of zero interest rates and a 50% meltdown in stock market valuation.

Now let’s move that time block one year forward and look at the period 1989 through 2008. Still good but what a difference one year makes. The total gain was 404%, or 8.4% annualized. That’s a drop of 3% per year! Investors missed the 16% bounce back in 1988 after the October 1987 crash, and the time block now included the 35% meltdown of 2008. There was even more pain to come in the first half of 2009 but I’ll come back to that.

1995 through 2014 was a good period with total gains of 550%, or 9.8% annualized. Shift that time block by two years to the period 1997 through 2016 and the gains fall off significantly. The total gain was 340%, or 7.7% annualized.

We can make a rough approximation of total returns during the late 1970s and into the 1980s, an ugly period for equities. In 1980, someone quipped “Equities are dead.” Twenty year periods ending during this time did not fare so well but still notched gains of more than 6%. Bonds, CDs and Treasuries were paying far more than that at the time. In today’s low interest environment, 6% seems a lot better than it did during the double digit inflation of 1980.

In past weeks I have written about the overvaluation of today’s stock market based on trailing P/E ratio and the smoothed 10 year CAPE ratio. Let’s look at the current valuation from the perspective of this twenty year return. It would come as no surprise that the total twenty year gain hit a low at the end of February 2009 when the market was about a 1/4 of its current valuation. That 20 year annualized gain was 5.7%. What surprised me was that the current valuation shows the same 20 year gain! Using this metric as an evaluation guide, the market sits at a relatively low level just like it was in 1988 and 1989.

The historical evidence shows that stock returns may be erratic but consistently make over 5% over a twenty year retirement period. Those who are newly retired or about to retire might understandably desire more safety. The safest approach is not to suddenly shift one’s portfolio entirely to safe assets.

///////////////////////

Income Inequality

Much has been written about the growth of income inequality. The GINI coefficient is the most popular but there are other measures (for those who want to get into the weeds of inequality measures). The Social Security Administration offers a simple indicator of the trend. They track the average and median incomes of millions of earners every year.

When the median and average are fairly close to each other, that indicates that the numbers in the data set are uniformly distributed. As the ratio percentage of the median to the average falls, that indicates that a few big numbers are raising the average but do not raise the median.

Here’s a simple example of an evenly distributed set. Consider a set of numbers 1, 2, 3, 4, 5, 6. The average is 3.5. The median is also 3.5 because there are three numbers in the set below 3.5 and three numbers above 3.5.  The percentage of the median to the average is 100%.

Let’s consider an unevenly distributed set: 1, 2, 3, 4, 5, 12. The median is still the same value as the earlier example: 3.5. But the average is now 4.5. The ratio of the median to the average is 3.5 / 4.5 = about 78%.

The ratio of the median to the average income has fallen from 71% in 1990 to 64% in 2015. This indicates that there is a growing number of large incomes in our data set.

SSAIncomeAvgMedian
Here’s the data in a graph form

SSAIncomeAvgMedianGraph
Median wages have doubled, or grown by 100%, while average wages have grown by more than 150% in the last quarter century.

Next week I will look at a hypothetical income tax proposal based on income. It might just blow your mind.

///////////////////////

Dividend Payout Ratio

FactSet Analytics grouped dividend paying stocks in quintiles (20% bands) by the dividend payout ratio (Chart). This is the percentage of profits that are paid to shareholders in the form of dividends. Over the last 20 years of rolling one month returns the stocks that had the highest and lowest payout ratios had the lowest total return. Think about that. Both the highest and lowest quintiles did the worst. What performed the best? Those stocks that were in the middle quintile, the companies who balanced their profit distributions between investors (dividends) and investment (future sales and profits).

//////////////////////////

CWPI

Each month I compute a Constant Weighted Purchasing Index built on a combination of the two Purchasing Manager’s surveys (PMI) each month. For the six month in a row, this composite has shown strong growth and the three year average first crossed the threshold of strong growth in January 2015.

A sub-index composite that I build from the new orders and employment components of the services survey (NMI) shows moderate growth. Its three year average has shown moderate growth since early 2014.

////////////////////////

The BUT Economy

December 9th

An eventful week in what I will call the BUT economy:  GDP revisions, Corporate Profits, Consumer Confidence and the Labor Report.  Let’s get into it!

At the end of last week, the Commerce Dept issued their customary revisions to 3rd quarter Gross Domestic Products (GDP).The first number that came out in October was a preliminary estimate.  As more data comes in, the Commerce Dept. revises its figures, and will have another revision in December.  From the initial estimate of 2.0% annualized growth, the Commerce Dept revised 3rd quarter GDP growth up to 2.7%, below the historical average of about 3% but good news is YAAY! Right?  Wait for it now…BUT upward revisions were due largely to companies building inventories.  Final sales actually declined from the initial estimate of 2.1% to 1.9%.  Excluding exports, final sales were revised from a growth of 2.3% to 1.7%.

The boom in natural gas production has led many power generators to convert their plants from coal to natural gas, when they can.  Total coal production is down this year (Source) but exports of U.S. coal to the rest of the world have surged, so that we are exporting a record 25% of the total coal production in this country.  The U.S. Energy Information Administration (EIA) estimates that coal exports will total about 133 million short tons this year, or 2-1/2 times the average of the past decade. (EIA Source)

The process of drilling for natural gas, called Fracking, has also led to a high production of crude oil (EIA source).

GDP includes both exports (+) and imports (-), what is called “net exports” and it has been negative for several decades as we import far more goods than we export.  This serves as a negative drag on GDP growth.

Exports have risen over the past decade.  As natural gas prices have fallen, surging coal exports in the past few years have helped buoy up lackluster GDP growth.

Another contributor to GDP growth has been a more confident consumer, in contrast to the rather cautious attitude of businesses in the past six months.  An upswing in student debt and car loans has halted the decline as households have shed debt (delevered) either by foreclosure, default, paying down balances or not charging as much.  Household Credit Market Debt outstanding (includes mortgages, car loans, student loans, revolving credit) indicates a growing willingness of consumers to take on more debt. 

On a per person basis, our debt has declined slightly from the peak of 2007 but is still way too high, leaving many of us vulnerable to a subsequent downturn, slight though it might be.

Just how bad has this recession been?  In previous recessions, households cut back their debt to “only” a 5% growth rate.  For the first time ever, the American people reduced their debt growth rate below 0. It is only in the past two years that this rate of negative debt growth is approaching 0.

Here’s the BUT. The underlying fragility of confidence was revealed this past Friday when the U. of Michigan Consumer Sentiment poll showed a plunge in confidence from over 82 in September to 74 in October. For the first time since the recession started in late 2007, the consumer confidence index had finally surpassed 80, only to fall back again the following month.  In a relatively healthy economy, this index is above 90.

To summarize so far, we have a consumer slowly and haltingly gaining more confidence, spending more and keeping the growth rate of her debt in check.  We have an overall economy that is behaving rather tiredly, growing tepidly as though on the downhill of a long boom cycle; that’s a problem since this has not been a boom cycle in the past few years.  So how are corporate profits doing?  Fine! Thank you!

In this past quarter, profits rose by 18%.

Starbucks, the coffee giant, announced this week that they would voluntarily pay some British income tax this year instead of moving the profits to some low tax country and avoiding British income taxes.  It appears that their customers discovered that they had been (legally, mind you) avoiding paying income taxes and were mobilizing to boycott Starbucks’ stores in Great Britain.

Interest rates kept near zero by the Federal Reserve have been a feast for many international corporations.  At the end of October, U.S. companies have issued $1.1 trillion in investment grade and high yield bonds (Source), responding to investors’ thirst for higher yields. That is an increase of 26% over last year’s bond issuance. International companies are, quite rationally, borrowing at the lowest interest rate they can find around the world, then spread that money to their subsidiaries in other countries.  They pay the lowest income taxes they can find internationally and shuffle the paper profits around the world. 

Ok, where were we? Oh yeah, cautious but more confident consumer, tepid but possibly improving GDP growth and record corporate profits.  Oh yeah, and record Federal Debt – over $16 trillion and counting.

Pity the poor corporations who pay the highest income tax rate in the world – except that they don’t.  In 2011, it was about 20%.

Record corporate profits, record low effective corporate tax rates, record low borrowing costs for corporations and record high Federal Debt.  The largest companies heavily lobby Congress to keep their tax rates low.  No matter how high profits are, companies publicly worry about their profit forecast and the economic outlook.  These large companies have become adept at convincing Congress that they are struggling.  Half of the Congress thinks that they must help these poor companies create jobs; key committee members craft more tax goodies and bury these goodies inside large appropriations bills.  Congress underfunds regulatory agencies so that they are effectively outmanned by corporate legal departments.

The lack of corporate tax revenues contributes to the Federal debt; over the past fifty years that share has declined from 20% of Federal revenues to about 10%.  If the share of Federal revenues had remained at the 20% level of the 1960s, the Federal Debt would be $7.4 trillion today, not $16 trillion.  Calculating savings on interest paid on the smaller debt would lower the actual debt to about $6.8 to $7 trillion.

Big increases in productivity have helped fuel the strong rise in profits.  Investments in technology as well as higher skill and education levels have enabled American workers to record levels of production but they have not shared in the gains from those increasing levels of production.  The U.S. has risen to the same levels of income inequality as some emerging countries:  China, Venezuela, Ecuador and Argentina.

To recap:  record high corporate profits due to record high worker productivity which has not benefited the workers, record low effective corporate tax rates and share of the costs of government, record low borrowing costs for corporations, and record high Federal Debt.

All of this largesse to multi-national U.S. corporations begs the question: Where are the jobs? But that I’ll leave for next when we look at the November Labor Report released this past Friday.