Blossoms and Blight

March 24th, 2013

The Blossoms

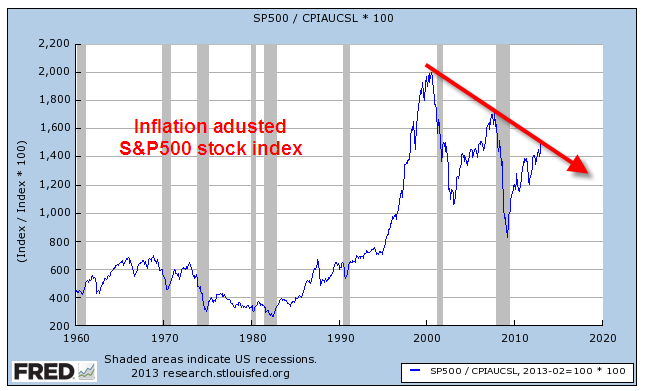
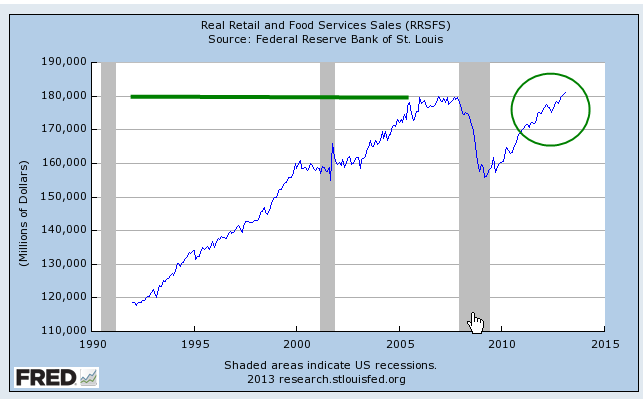
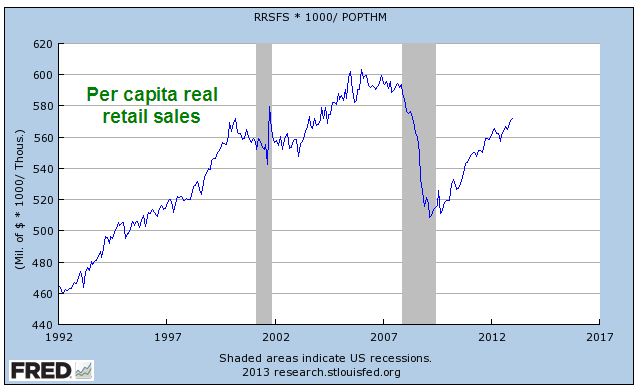
There have been a number of encouraging reports these past several months, helping to fuel new highs in the popular SP500 stock index.  After falling off dramatically five years ago, real (inflation adjusted) retail sales finally surpassed 2007 levels.

Housing prices around the country are on the mend.  Although the purchase only home price index is still below the vaulted levels of the bubble years, it is exactly where it would have been if there had been no bubble and housing prices had grown at their customary 3 – 4% per year.

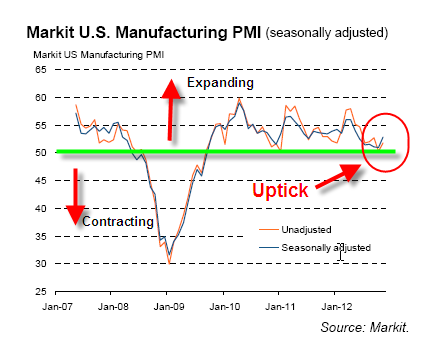
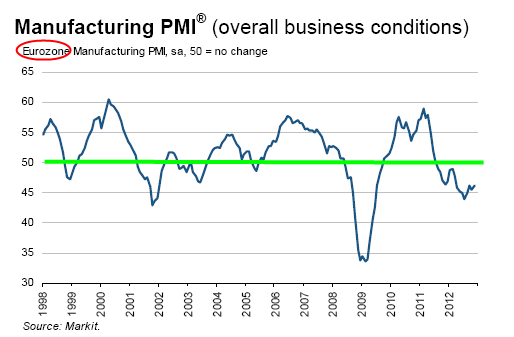
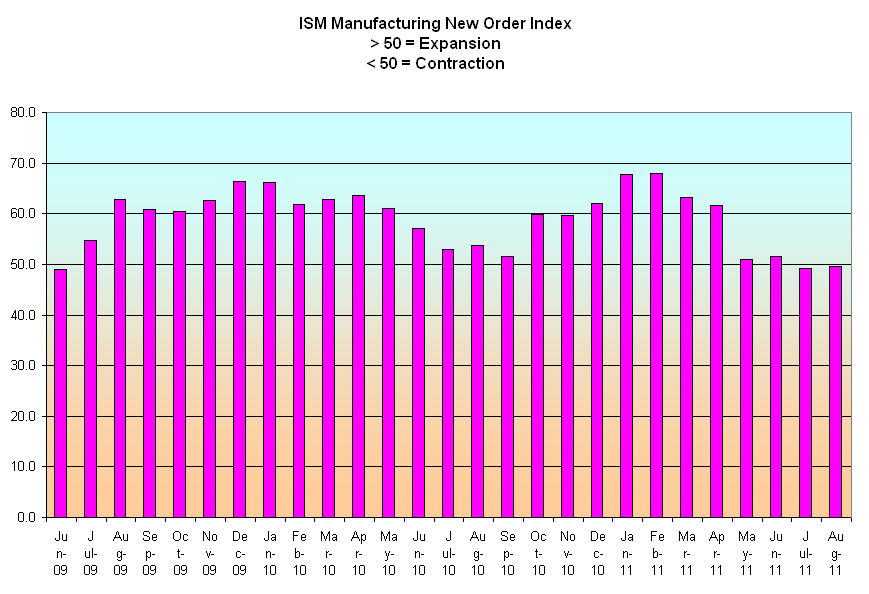
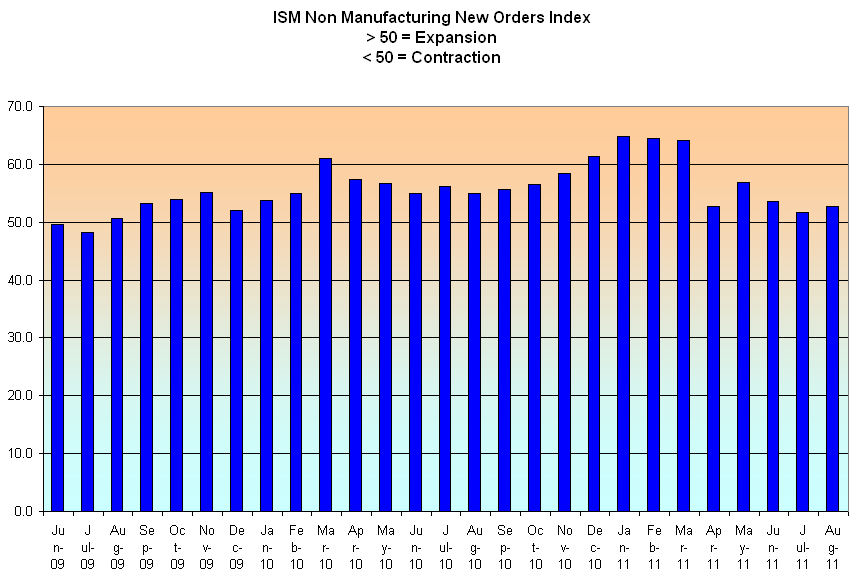
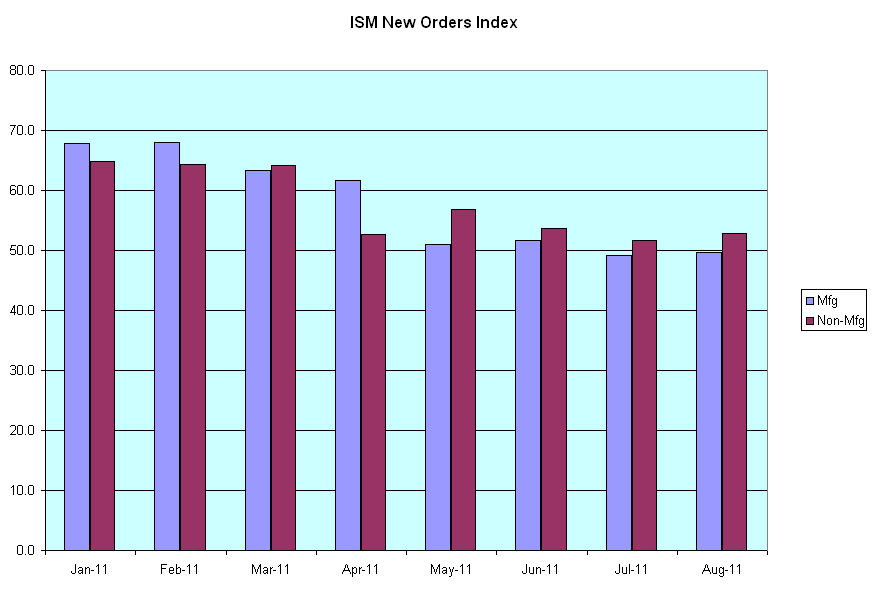
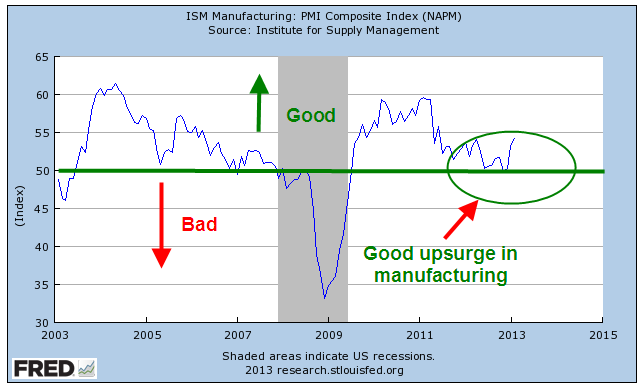
In recent months, the manufacturing sector of the economy has surged upward, rebounding from weakness in the latter part of 2012.  For the past year, the Eurozone has been in or near recession, yet some are hopeful that increased demand in this country and some emerging markets are helping to balance the contractionary influence of decreased demand in the Eurozone.  Let’s hope that this surge in the first part of the year does not fade as it did in 2012.

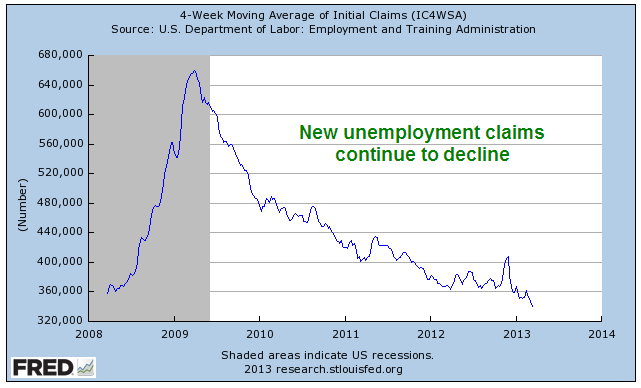
New claims for unemployment continue to decline. 

The Blight

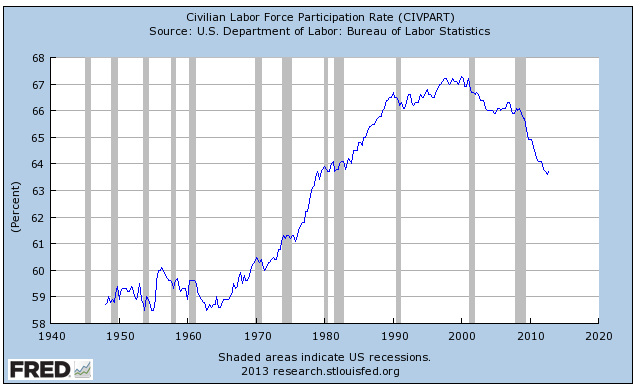
But a 7.7% unemployment rate and a record 14 million disabled (SSA Source) show that the labor market is still sick.  The percent of working age people who are working, or the participation rate, continues to drift downward.

While the steadily improving retail sales indicate growing consumer confidence, per capita purchases are about where they were in the late 1990s, 15 years ago.

While consumers have been shedding debt, state and local governments continue to hold large levels of debt which does not include promised pension and health care benefits to retirees.

Federal Spending continues to outpace receipts, adding to the debt at a rate of more than 4% per year. At that rate the debt will double in about 18 years, reaching $30 trillion in 2030.  As a percent of the entire economy of the country, the deficit or annual shortfall between spending and revenues is still about 7%.
 

As housing prices recover and households either pay down or shed debt in foreclosure or bankruptcy, household balance sheets are looking better. What has happened in the past five years is a massive shift of household debt to the balance sheets of local, state and federal governments.

The blossoms catch our eye, inspiring hope, causing some to not notice the blight.  But the stock market, the barometer of millions of watching eyes, tells a more complete story.  While the stock market has shown renewed optimism in the past several months, its inflation adjusted value indicates a more tempered enthusiasm for the long term future of the economy and corporate profits.

Manufacturing Muddle

December 5th, 2012

Tenaciously limping along like Chester on the western TV series “Gunsmoke.” On Monday, the Institute for Supply Management (ISM) released their November Manufacturing Index report, showing a very slight contraction.  The downward trend in manufacturing activity will continue to curtail any employment gains.  The monthly labor report from the BLS is due this Friday.

On the same day, Markit Economics and ISM released their November Manufacturing Purchasing Managers Index (PMI) report, a survey of purchasing managers at manufacturing companies.  An outlook into the near future, the survey showed a solid uptick this past month, giving some hope that the decline in manufacturing may be bottoming or turning upward.  For the first time in six months, exports increased;  new orders and employment showed a faster rate of expansion but inventories dropped a bit, showing that businesses are still cautious.

The manufacturing PMI for the Eurozone also increased but remains at recession levels.  The lackluster demand in Europe will crimp growth in the U.S. 

The effects of Superstorm Sandy continue to muddy both the analysis of existing data and forecasting near term trends but there are no strong signs of growth.

In Washington, the impasse over the fiscal cliff is not helping.  A hundred years ago the Sixteenth Amendment was passed, enabling the Federal Government to levy income taxes.  Until then, the Federal government had a rather limited say in defining “fair.”  The power to collect taxes on income began a century long debate over what is fair.  As any parent knows, each child has their own unique sense of fairness.  As children grow up to be adults, they retain this unique intuitive assessment of fairness, layering rationality on top of the child’s sense.  Thus we have as many definitions of fair as there are people in the world.  The debate will never end until the power to tax incomes is once again removed from the Federal Government, where there are just too many powerful people with too many contending definitions of fairness.  The fractiousness is hurting people and businesses.  Winston Churchill sensed something eternally and unfortunately true about us: “Americans can always be counted on to do the right thing…after they have exhausted all other possibilities.”
   

ISM – not just another ism

Each month the Institute of Supply Management surveys several hundred firms in both the non-manufacturing and manufacturing sectors of the economy and compiles an index based on the survey responses to questions regarding both current and near future conditions.

The overall index is widely published each month but a closer inspection of the components reveals developing strengths and weaknesses in the economy.  The two component indexes I will look at are New Orders and Employment. 

 Manufacturing is only about 10% of the overall economy but it is a leading indicator of the underlying health of the overall economy. The recession officially ended in June 2009 and as the chart below shows new orders for goods started growing.

With new orders growing, manufacturers began hiring – the Employment index started increasing from a sick level of 40.

There were two key causes for this improvement:  The weakening dollar made manufactured goods attractively valued for businesses and consumers in other countries, thereby boosting our exports.  The auto bailouts and “Cash for Clunkers” program that were part of the stiumulus program initiated in the spring of 2009 helped revive the mortally wounded car manufacturers.

New orders in the non-manufacturing or services sector, the largest part of our economy, also started growing, but not as rapidly.

A large part of the construction trade is included in this sector.  The lack of new housing starts – about half what it was just five years ago – has crippled this industry, serving as a dead weight on the sector as a whole.  The non-manufacturing employment index lagged behind, not reaching a state of expansion till late summer of 2010.

Since the beginning of this year, new orders in both sectors have declined. 

The Japanese earthquake and tsunami in March of this year was blamed for the slowdown in manufacturing.  In June of this year, Japan appeared to have overcome much of the damage that the tsunami had done to their supply chain, leading economists and stock traders to predict a stronger second half of this year for the U.S.  However, the manufacturing new orders index has edged into contraction territory, hardly a sign of increased demand.

As the growth in new orders approaches the midway mark between contraction and expansion, so too does the employment index.  In both the manufacturing and service sectors of the economy, growth is minimal, leading some to predict and many to worry about a “double dip” recession.

Unemployment remains stubbornly high as demand softens.  The various stimulus programs by the Federal Reserve and the Obama and Bush administrations have had some effect but have not produced the robust recovery hoped for because this is the mother of all deleveraging recessions when both consumers and businesses pay down or restructure their debt and asset prices (housing prices) decline.  In the past decades, we accumulated debt the way a house accumulates water when flooded during heavy rains.  The Fed and both presidential administrations have been pumping hard to keep the floodwaters from causing even more damage.  What do they get for their efforts?  Some blame the pumpers for causing the flood.

Non-Manufacturing Index

Each month, the Institute for Supply Management (ISM) surveys purchasing managers around the country about changes in inventories, orders, sales and employment.  If there is no change from the previous month, the index reads 50.  Anything greater than 50 is a positive.  ISM publishes two composite indexes each month, one for manufacturing (PMI) and one for non-manufacturing (NMI), which represents more than 80% of the economy.

In January of this year, the non-manufacturing index squeaked into the positive zone with a 50.5 reading, followed by a 53 reading in February. In May, the NMI rose to 55.4, and a key component of that composite, the Business Activity Index, rose to 61, a level not seen since 2006.  The indexes are calculated in such a way that they reflect the dispersal of either positive or negative activity throughout the economy, so a reading of 61 indicates that improvement is spreading ever wider through a variety of companies.

Employment is usually the last horse out of the gate when coming out of a recession and this time is no different.  However, for the first time in 28 months, the Employment Index portion of the composite index broke into positive territory at 50.4.

This recession has a greater gravitational pull than the more recent ones at the beginning of this decade and the early nineties.  Pulling against this recovery are home foreclosures, commercial real estate debt coming due, European sovereign debt problems, China’s monetary support of its own exports and a lack of lending to small businesses.  But the rockets are firing.