Labor Productivity

September 24, 2023

by Stephen Stofka

This week’s letter is about labor productivity. The autoworker’s union (UAW) expanded its strike to 38 parts and distribution plants in the hopes that a wider impact will incentivize further concessions from auto executives. Labor constitutes only 10-15% of the price of a car yet labor disputes may give the impression that rising car prices are entirely or mostly the fault of labor union demand.

For more than 100 years, auto plants of the Big Three automakers have been union shops. Foreign manufacturers like Toyota and Honda have built non-union plants in southern states where union organizers have less influence with policymakers. There are almost a million auto workers now in Mexico where wages have been lower. In 2022, GM Mexico paid its workers between $9.15 and $33.74 an hour, but relatively few auto workers in Mexico make more than $16 per hour.

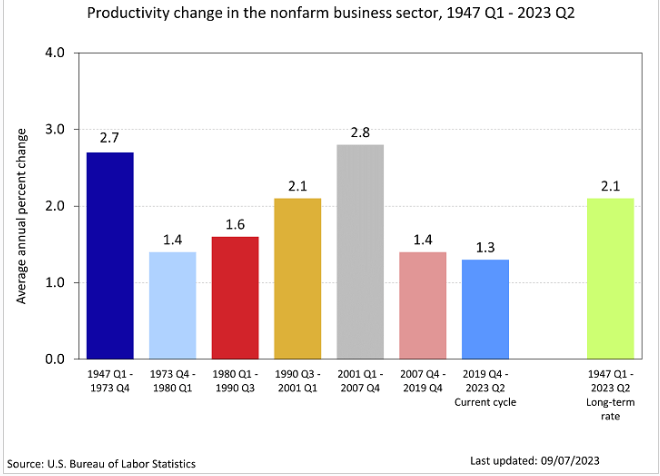
Two weeks ago, the BLS released their productivity figures for the second quarter. Productivity rose faster than labor costs by a good margin – notching a 3.5% annualized gain versus a 2.2% increase in unit labor costs. The manufacturing sector that car manufacturers belong to had a lower productivity gain of 2.9%. In that productivity release the BLS provided a chart grouping productivity gains by decade. The 75-year average is a 2.1% annual growth rate.

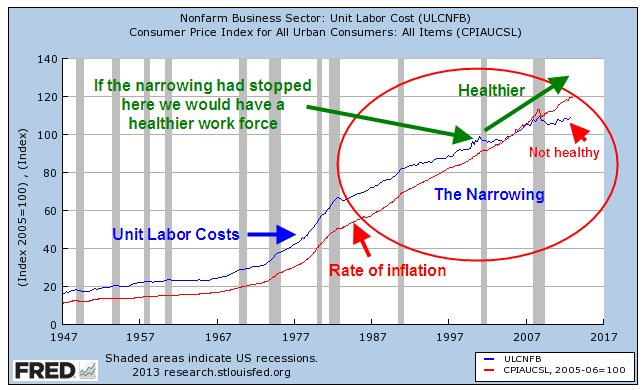
An often repeated theme of union workers and workers in general is that wage gains have not kept up with productivity gains. The BLS charted both series since 1973 and the divergence keeps growing by decade. American workers are competing with lower wage workers in Mexico, China and southeast Asia.

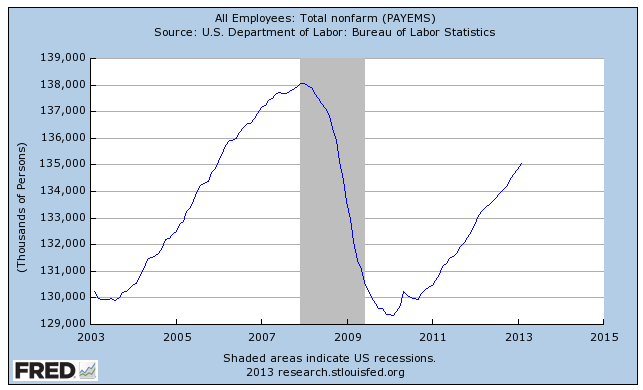
The annual gain in Productivity is erratic, rising sharply at the onset of recessions when workers are let go and the total hours worked declines. Recessions reduce the percentage of hours worked far more than the percentage reduction in output. I charted the annual gain in Labor Productivity (FRED Series OPHNFB) to show the effect of these shocks. The pandemic caused a particularly sharp rise and fall, as shown in the red rectangle below.

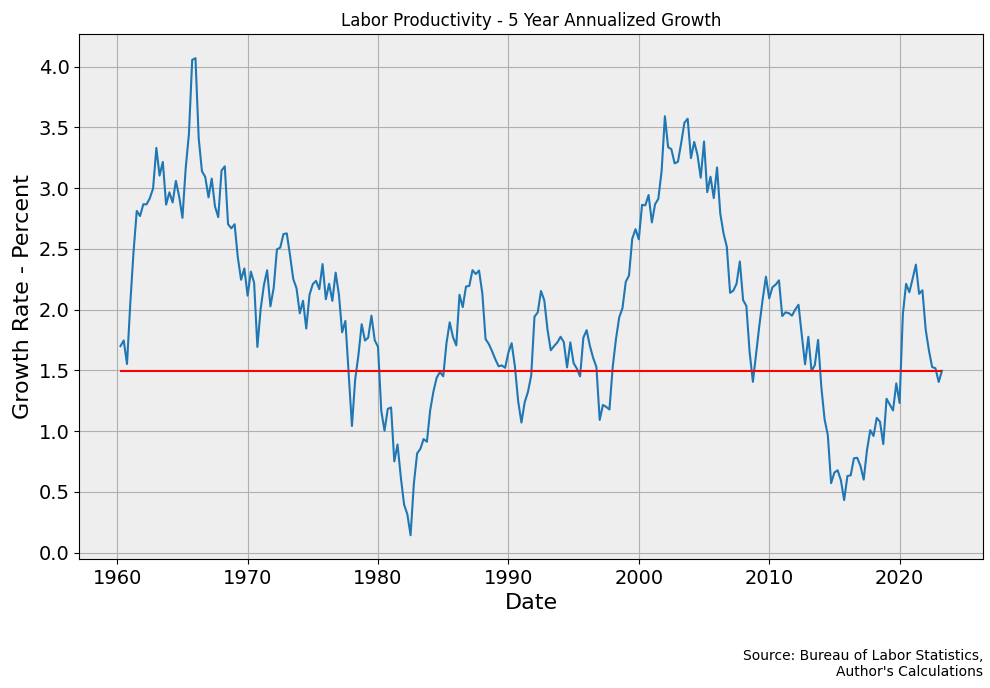
A five-year chart smooths out the divergences, letting us see the patterns more clearly. The red line in the graph below is the 1.5% current growth rate.

Trends in productivity growth are a medium term process, longer than any Presidential term. Despite that, candidates promise big productivity gains if they are elected. Republican candidates promise that lower taxes will boost productivity because that claim appeals to Republican voters. When productivity growth declined following the Bush tax cuts in 2001, conservatives blamed the stifling effects of regulatory compliance and called for more tax cuts. Democratic politicians promise more subsidies to an industry that is not nimble enough to respond to changing economic circumstances.

There are many factors that contribute to productivity growth. Some economists claimed that lower interest rates after the financial crisis would raise productivity. It fell. Those believers assert that declining productivity growth would have been worse without lower interest rates. This claim also cannot be disproved. Hypothetical situations are the favorite shield of a believer.

Corporate profits are up sharply since the start of the pandemic. For the past year, GM has enjoyed strong profit growth but they have had far too many down quarters since the financial crisis. Ford has fared better but its profit margin of 2.4% is only slightly more than the high-volume, low margin grocery giant Kroger. Stellantis has struggled to make a profit since 2018. For decades, federal and state governments have subsidized these auto giants with tax breaks and loans because the industry as a whole employs 1.7 million workers and contributes more than 10% to GDP. It is an industry where politics and economics are tightly intertwined. The politics clouds the economic analysis and the economics contorts the political calculations.

///////////////

20230924AssemblyLine

Photo by carlos aranda on Unsplash

Keywords: auto industry, GM, Ford, Stellantis, union, UAW, labor, workers, wages

The Fruits of Labor

March 6, 2022

by Stephen Stofka

In trips to the grocery store and gas station, many of us develop an inflation calculator that we trust because it tracks price changes in the unique basket of goods that we buy. If the price of mushrooms doubles, we only care if we buy mushrooms. Economists have the difficult task of computing the price changes of a common set of goods. They spend an extraordinary amount of time and expense surveying people in cities throughout the U.S. to construct a representative sample of the goods we buy (BLS, 2021). The price weighting that economists use to measure inflation differs from our instinctive approach. We assign weighting by the frequency we do something. What catches our attention gets more weight in our consumption basket.

Our sense of inflation can be guided by the price of gasoline when we fill up each week, but it is only 4% of the CPI measure of inflation (BLS, 2022). Many of us underweight the cost of housing that we provide to ourselves. Wait, what? In January, economists at the Bureau of Labor Statistics computed a 4% increase in housing costs even for those who owned their home outright. They call this Owners’ Equivalent Rent (OER) and it makes up a whopping 25% of the calculation of inflation. In the BLS methodology, homeowners are both landlords and renters. Actual rental increases made up only 7% of the index but the BLS uses those rent increases to compute the market price of what a homeowner could rent out their home for each month. For a homeowner, that 4% increase in housing costs is actually a 4% saving. Even better, homeowners do not pay income taxes on that imputed income.

Like gasoline, we overweight the effect of grocery prices because we frequently shop. If we enjoy a sirloin steak once a week, we notice when it increases in price from less than $10 to $13 a pound (FRED series APU0400703613). In the years after the financial crisis many households ate more ground beef. Prices doubled in response to the increased demand (APU000070312). Ground beef is what economists call a Giffen good. Unlike normal goods, we buy more of a Giffen good when our income goes down.

Many of us measure inflation by comparing the prices we pay to the wages we receive. Workers have gained little in the past two decades, eking out an extra 8% in real earnings over that time. All of that gain has come in the past eight years. Workers should expect to share in the productivity increases of the past two decades.

An assumption of neoclassical economics is that workers’ wages reflect their marginal productivity. A BLS analysis (Sprague, 2014) of labor productivity showed an average gain of 2.2% in real output per hour from 2000-2013, yet workers’ real earnings declined slightly. In the past eight years, annual productivity gains have averaged about 1%, slightly below the annual 1.2% increase in real wages. Why have workers been able to command wages appropriate to their productivity in the past eight years but not in the 14 years prior? The problem began before the financial crisis when productivity rose 2.7% per year and real wage growth actually declined. The 2000s came after a period of reversal for the owners of capital. During the 1990s, much money was lost in the pursuit of profits promised by the developing internet. Owners and management recaptured those losses by keeping the productivity gains to themselves during the 2000s. Workers may not be able to regain those lost wages but at least they are securing the fruits of their labor.

/////////////

Photo by Timotheus Fröbel on Unsplash

BLS. (2021, December 9). Consumer price index frequently asked questions. U.S. Bureau of Labor Statistics. Retrieved March 5, 2022, from https://www.bls.gov/cpi/questions-and-answers.htm

BLS. (2022, February 10). Table 1. Consumer price index for all urban consumers (CPI-U): U. S. city average, by Expenditure Category – 2022 M01 results. U.S. Bureau of Labor Statistics. Retrieved March 5, 2022, from https://www.bls.gov/news.release/cpi.t01.htm

Sprague, S. (2014, May). Definition, concepts, and uses. U.S. Bureau of Labor Statistics. Retrieved March 5, 2022, from https://www.bls.gov/opub/btn/volume-3/what-can-labor-productivity-tell-us-about-the-us-economy.htm

Widgets and Labor

March 9th, 2012

Labor costs are the major share of the expense of producing goods and services.  While the percentages vary by industry, a rule of thumb is that labor is about 70% of the final cost of a product.  The cost of labor to produce one widget should keep rising with inflation.  With the passage of time, widgets sell for more and employees demand more pay to produce those widgets.  Not surprisingly, the Bureau of Labor Statistics keeps track of the labor cost to produce widgets; they call it Unit Labor Cost.  In laymen’s terms we can think of it as the Widget Labor Cost.  The cost is indexed to a particular year year; in this case it is 2005.  If the labor cost of a widget was $2.43 in 2005, we’ll set that to 100.  Indexing makes what might seem like arbitrary numbers more uniform.  If the labor cost of a widget in 2012 is $2.67, then the index would read 110, or 10% more than 2005.

Widget labor costs typically fall or flatten out in a recession.  A graph of the past ten years shows that we still have not reached 2007 levels.

Keynesian economists say that labor costs are “sticky”, i.e. they do not decline in proportion to the downturn in the economy and the reduced demand during a recession.  Wages are the price of labor. Union contracts and employment laws do not allow these prices to fall to what is called the market clearing level.  Labor prices thus become too expensive and employers want less labor, resulting in higher unemployment.

Several decades of data allows us to see some changing growth trends in the labor costs to make widgets.

As I noted earlier, labor costs rise with inflation.  The graph below shows the relationship between the two.

After WW2, the rise in labor costs was just slightly ahead of the rise in inflation, allowing workers a greater standard of living and to put away some money for the future.  During the “stagflation” of the 1970s, this gap widened as workers demanded more pay in response to rising inflation while economic growth stagnated.  When the economy recovered in the mid-1980s, we began to see a narrowing between unit labor costs and the rate of inflation.  Had this narrowing stopped around the year 2000 and labor costs continued rising with inflation we would have a healthier work force and a healthier  economy.  But the gap narrowed further until labor costs were no longer keeping up with inflation.  Dwindling increases in labor costs have resulted in more profits for companies.  Although the labor market has a strong influence on the stock market, it is an indirect influence.  Stock prices are directly influenced by rising corporate profits and the perception that future profits will increase at a faster or slower rate.

Because wages do not rise and fall in proportion to the swings in the business cycle, companies took the only course of action left.  They reduced the labor component cost of their goods and services where they could.  Union contracts offer a company less flexibility in responding to downturns in the economy.  Companies reduced their exposure to union labor by outsourcing production to other countries, or by subbing out production to smaller companies with non-union workforces.  

Many people have been waiting several years for employment to recover.  As the chart above shows, there has been a systemic decrease in labor needed to produce each widget.  There is little indication that this trend will end as the economy continues to recover.  Since this economy is consumer driven, it is dependent on a healthy labor market.  A stumbling labor force will not produce robust gains in the economy. 

That is the background, the context for a look at February’s monthly labor report from the BLS, a better than expected report.  The headline job gain was 236,000, far above the 170,000 anticipated employment gain.  The unemployment rate dropped to 7.7% and the year over year decrease in the unemployment rate indicates little chance of recession.

There were other positive signs in this latest report.  Average hourly earnings of private-sector production and nonsupervisory employees broke above $20, increasing to $20.04.  After rising and stuttering last year, earnings have increased steadily since August 2012.  Despite these gains, hourly earnings of production employees are little changed from 1965 levels.

A slowly improving economy gave some hope that we might see the number of discouraged unemployed workers decline below 800,000 this month.  Instead the number rose from 804,000 to 885,000.

The Labor Force participation rate dropped another .1%.  Fewer and fewer workers are being asked to shoulder the benefits of the retired and unemployed.  The core work force aged 25-54 is still showing no substantial improvement.

While employment gains in the 25 – 54 age group have stagnated, the larger group aged 25+ continues to show improvement.  The unemployment rate for this larger group declined another .2% and now stands at a respectable 6.3%.  The employment picture for new entrants into the labor force, those aged 16 – 19, remains bleak.  This past month, the rate of the unemployed in this group increased and now stands at 25%.  Hispanics have seen a 10% decrease in unemployment during the past year but there are still almost 10% unemployed.  The minority group that has suffered the most through this recession has been African-Americans, whose unemployment rate has stayed subbornly high.  There have some small declines in unemployment over the past year, but almost 14% of this group is unemployed.

However, a group that has had persistently high unemployment, those without a high school diploma, saw a significant decline from 12% to 11.2%.

A significant contributor to that decrease is the steady rise in construction employment.

Perhaps not so widely followed is the “Craigslist indicator of construction activity.”  No, you won’t find this one charted anywhere but it does give a clue to what it going on in your area.  Search for “work van”, “work truck”, “step van” or “cube van” in your local Craigslist.  If there are a lot of listings, it means things are not good.  A few years ago, the Denver area used to have pages of work vehicles for sale by both owners and dealers.  This month there are few listings.

Other positives were the increase in the weekly hours worked to 34.5, in the pre-recession range.  Health care enjoyed strong gains as usual.  Professional and business services enjoyed strong gains, offsetting the unusually flat gains of January.  A rise in retail hiring was a nice surprise.

A bit of a head scratcher was the revision of January’s job gains, erasing 25% of the 160,000 job gains that month.  Revisions of that size leads to doubts about the winter seasonal adjustments that the BLS makes to the raw data. 

There are still 3 million fewer people working than in January 2008, when the BLS reported employment of 138 million.

In the past week the Dow Jones Industrial average crossed above the high mark of 2007.  On an inflation adjusted basis, the Dow is still well below the level it attained in 2000 and has still not passed 2007 price levels.  Some argue that the average 2.2% in stock dividends paid out each year partially compensates for the 3% loss in purchasing power.  Others argue that the dividend is compensation for the risks the investor assumes in the stock market and should not be taken into account.  If we disregard dividends, the inflation adjusted SP500 index is – well, it’s better than it was in 1990.

If a buy and hold investor has been in the market since 1990, she has gained 4% per year after inflation.  Adding in a dividend yield of about 2.5% over that time results in a total gain of 6.5%.  Had she bought a 30 year Treasury note in 1990, she would have been making about 8% per year for the past 23 years.  There are three lessons to be learned from this:  Diversify, diversify, diversify.

Regulation Riddle

I’ll continue my look at favorite myths of both the left and right. This week it’s the right’s turn.

A familiar myth of conservatives is that over-regulation led to the decline of manufacturing in the U.S. Is this true? While labor and environmental regulations in a well developed country like the U.S. may play some part in the total cost of a manufactured good, they are not the only costs. Below is a chart from the Bureau of Labor Statistics showing a comparison of labor costs in the U.S., China, Mexico and a few other areas.(Click to see larger image in separate tab)

As we can see, Chinese manufacturing companies have a huge advantage in this area. There are few labor regulations and those regulations which are in place are loosely enforced. The U.S. would have to abolish almost all of its labor regulations regarding minimum wage, overtime, Social Security, Unemployment insurance and Workmen’s Compensation and they still would not be competitive with China. Chinese manufacturing plants enjoy a host of other competitive advantages, according to Manufacturing News: many do not have to pay for the land their factories are built on; many companies do not pay income taxes, property taxes or value-added taxes. In rural areas, manufacturing plants pay only enough to compete with the small, if any, compensation that an overworked person can make in subsistence farming. Parts of Mexico enjoy the same advantages. If minimum wage laws were abolished in the U.S., would you take an assembly job for $2.60? If so, then we could stay competitive with Mexico and China.

How much manufacturing have we lost over the past two decades?  According to the Small Business Administration (SBA), there were almost 28 million private businesses in the U.S. in 2007. 22 million were what are called non-employer firms, i.e. businesses that report no employees.  These would include people who work for themselves as sole proprietors or Subchapter S corporations. In 1988, 6.5% of private employer businesses were classified as manufacturing and they accounted for  22% of private employment.  In 2007, only 4.7% of businesses were classified as manufacturing, accounting for 11% of private employment.  If we had the same percentage of employment in manufacturing that we did in 1988, we would have approximately 13 million more people employed.  The Bureau of Labor Statistics (BLS) reports  that the number of unemployed was 14.8 million in September.

There is no magic formula that will enable us to compete in manufacturing and assembly industries which can produce with low cost, marginally educated labor.  The edge we have and must maximize over newly industrializing nations must be a more educated workforce, one which can command the higher precision and more complicated manufacturing industries.  Improving educational standards is a multi-decade commitment of dollars and community.

So why do conservatives consistently trumpet regulations as the chief cause of the decline of manufacturing jobs in this country? Because it gives them a justification for policies to reduce the existing labor and environmental regulations. Conservatives know that, if they advocated abolishment of many or all of these regulations in order to be competitive, most of the voters would turn away from them in disgust. So they promise that some reasonable reduction in regulations will make a big difference, hoping that the voters will buy the argument on its plausibility without checking the facts.