This week’s letter continues my look at the dance of our responses to events. In a newsletter a few years ago, Kyla Scanlon coined the term vibecession to describe a general consumer sentiment that is contrary to positive economic data on unemployment, wages, and GDP. Why are consumers ignoring positive data and a rising stock market to direct their focus on rising inflation, interest rates and home prices? Analysts have identified a tangled string of factors that contributed to this negative consumer mood, but identifying a primary cause is difficult.
We assign importance weights to events as we experience them or learn of them. Adam Smith wrote how we can mourn the loss of a tip of our finger more than the deaths of a million Chinese people in an earthquake. Our reaction to even a small tax hike can be out of all proportion to the quantitative change in the tax. State legislators are reluctant to increase a gasoline tax by a few pennies a gallon because they fear the voter backlash. On a ten gallon fill up, the extra tax might be only thirty cents, an amount someone might leave in a tip jar at a coffee shop. To many consumers, that thirty cents is insult added to insult, an example of government sticking its greedy hands into consumer pockets.
The frequency of an event like a sales tax may lead us to consider the entirety, the sum of events, as we react to any one event. Within this perspective, an inappropriate response to a particular event may look entirely appropriate. This can help explain why a person of a minority group reacts in a particular manner in their encounters with police. Their reaction is not to the encounter itself, but a lifetime of more than average encounters because of their skin color.
Sometimes the response is entirely proportional. In Colorado, the growth of property taxes was held in check by a law called the Gallagher Amendment, which taxpayers repealed in 2020. In the past five years, property taxes in Denver have more than doubled. An analysis by the Common Sense Institute determined that many property owners saw an average increase of 27% in their 2023 property taxes. Responding to voter anger, the legislature passed a law in May 2024 that enacted tiny decrease in taxes, from 6.765% to 6.7%. Many voters perceived the paltry tax relief as an insult and have shown strong support for a ballot initiative this November that will curtail the growth of property taxes. Scared that voters will again take more control of state and local revenue growth, the governor has called for a special session this summer, hoping that legislators can craft a measure that will provide substantial tax relief and deflect voter anger this coming November.
Having insurance can lower our reaction to a damaging event like a car accident or a hail storm. By diversifying our portfolio, we act as our own insurance company. However, it is not practical to own multiple homes to diversify the risk of hail damage, so we reduce the impact of such an event by buying a policy from an insurance company. The insurance companies insulate themselves from the impact of large losses, particularly weather-related events, by buying insurance themselves from global reinsurance companies. Because reinsurance companies have a global portfolio, they are able to distribute the risk of local weather phenomenon across all regions.
Unlike animals, most of us monitor and modify our reaction to daily events. Here again, the frequency of an event helps us manage our reaction because we are better able to predict the effect of a particular event. When we first learn to drive, the flow of traffic on a city street can be disconcerting and confusing. Over time we learn to anticipate the movement of the vehicles around us and this expectation reduces our confusion. This reaction management can become a multi-level cognitive process where we modify our management of our reactions. Commercial drivers required to take defensive driving classes are taught not to over-anticipate the actions of others. “Lights do not stop cars. People stop cars.” “Some drivers use their foot to drive. A safe driver uses their brain.” Per mile of city street, there are many drivers of machines capable of great damage but few lights and signs. We get where we are going because people follow rules both written and unwritten. We pay attention to signs posted and unposted.
In human affairs, event and reaction are not separable like the Newtonian model we are taught in grade school. They may be the two heads of that peculiar animal called a pushmi-pullyuin The Story of Dr. Doolittle by Hugh Lofting. Because of that symbiosis, there may be backward causation. Did x cause y or did y cause x? There may be a factor z that affects both x and y. Event and reaction are a symbiosis that we manage through expectations, diversification and informal rules. Institutions like insurance and laws help us coordinate our individual responses. Somehow we survive in this world of complex causality.
The subjects of this week’s letter are home prices, household income and property taxes. The policy of using property tax revenue to fund public education has provoked controversy since the 19th century. Like other social species we are watchful of threats like freeloading to our group’s cohesion, however we determine “our” group. Newcomers to an area are often regarded with suspicion as being freeloaders who get from the group before they have contributed to the common welfare. This suspicion often underlies the heated debates that erupt at local council meetings. I will begin with property valuations, the basis of property taxation.
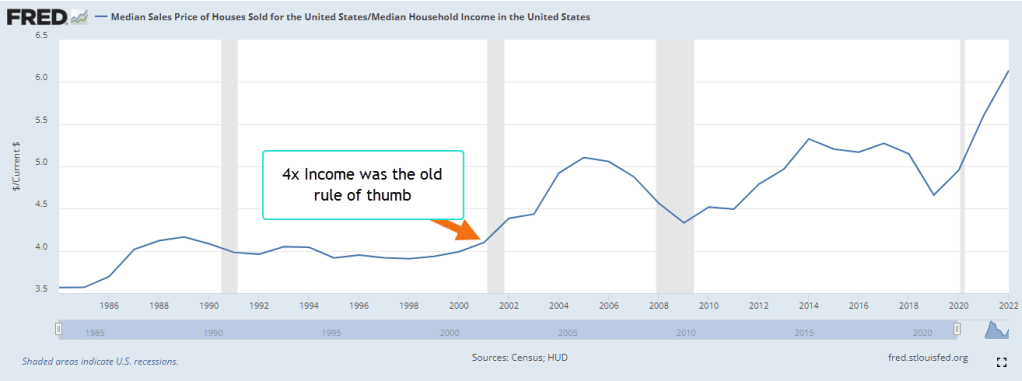
As a young man I was taught not to buy a home that was priced more than four times my income. In 2022, families paid more than six times the median household income, as shown in the chart below. Despite the high prices, mortgage debt service is a tame 10% of the household disposable personal income. Almost 40% of homeowners have a fully paid mortgage, according to Axios. Many homeowners hold mortgages at the historically low rates of the last decade. If higher mortgage rates persist for several years, we may see greater delinquency rates as recent buyers cope with payments that stretch their budget.
The Center for Microeconomic Data at the NY Federal Reserve has tracked household finances for more than twenty years. The highest percent of total household debt continues to be mortgage debt at 68% to 70%. Mortgage debt has grown at an annual rate of 3.9%, slightly more than the 3.7% annual increase in owner equivalent rent that I discussed last week. A low 3% of mortgages are more than 30 days delinquent, down from 11% to 12% during the 2008-2009 financial crisis. Only 40,000 people are in foreclosure, less than half the number in 2019. The numbers today are the lowest on record except for the pandemic years of 2020 and 2021 when many foreclosures were halted.
As I discussed last week, property prices reflect the anticipated cash flows from the house during a 30-year mortgage, a process called capitalization. The home buyer replaces the seller in the stream of cash flows from the house. Because property taxes are based on the appraisal values, the taxing authority implicitly bases property taxes on cash flows that a homeowner has not received yet. Each state sets an assessment rate that is a percent of the appraised value of the home. Each taxing authority within the state then charges a dollar amount – the mill value – per thousand of that assessed value. A home with an appraised value of $500,000 and an assessment rate of 8% would have an assessed valuation of $40,000. If the mill levy were $100 per $1000 of assessed value, then the homeowner’s property tax bill would be $4000. The effective property tax rate would be $4000 divided by $500,000, or 0.8%. Investopedia has a longer explanation for interested readers.
Each state taxes property at different rates. Colorado charges ½% of the appraised property value, one of the lowest in the nation. California averages ¾%. Texas averages a whopping 1.74% of home property values but has no income tax. Families earning the median household income and owning a house valued at the median house price in Texas and Colorado pay the same combined property and income tax of $5883 and $5669, respectively. Colorado has a cheaper tax burden despite having an income tax and far higher median house values. The same family living in California would pay $8256, largely because their property tax bill would be about the same as in Texas because the home values are more than double those in Texas. I will leave data sources in the notes.
Many districts give seniors a discount on their property taxes, effectively throwing a higher burden on working homeowners. Some argue that these exemptions should be means tested, effectively lessening or eliminating the discount for seniors with higher incomes. A wave of seniors may move to an inter-urban area that features lower home prices yet is within an hour of vital medical services like a hospital. The higher demand drives up home prices for others who have lived in the area for decades. Secondly, seniors consume more medical services and public accommodations. That requires more public spending, which is shared by the entire community and leads to resentments and contentious public meetings at the local town hall.
The majority of property taxes are used to fund public schools, and it is the largest line item on an individual homeowner’s property tax statement. This system of funding raises principled objections from childless couples and those who privately school their children, but are expected to share the burden of funding public schools. Homeowners have often resented having to fund the schooling of recently arrived immigrants. In the 19th century a wave of immigrants from Catholic Ireland, then Catholic Italy prompted many states with Protestant majorities to pass laws that excluded public funding for schools run by Catholics. Since the 16th century, the two main branches of Christianity had fought bloody civil wars in Europe and Britain. Those who colonized America brought those antagonisms with them.
During the 1970s, the number of encounters at the southern border increased almost ten times, according to the CBP. High inflation and migration of Amerians to western states caused a surge in property valuations and higher property taxes. In 1978, a taxpayer revolt in California led to the passage of Proposition 13 limiting property tax increases. In some school districts, undocumented parents had to pay a fee to enroll their children in public school.
In a 1982 case Plyler v. Doe, a slim 5-4 majority on the Supreme Court ruled that undocumented immigrant children did not have to pay a fee to go to school. The court reasoned that the equal protection clause of the 14th Amendment extended protection to “persons,” not “citizens.” Therefore, a state could not provide public benefits to one child in a school district and not another child because their parents were undocumented. The court interpreted “protection” to include public benefits, a construction that the Connecticut Constitution made explicit in 1818 with the phrase “exclusive public emoluments or privileges from the community.” The conservative majority on the Supreme Court overruled an interpretation of the due process clause in the 14th Amendment that justified the 1972 Roe v. Wade decision. This court might revisit this interpretation of the equal protection clause of the 14th Amendment as well.
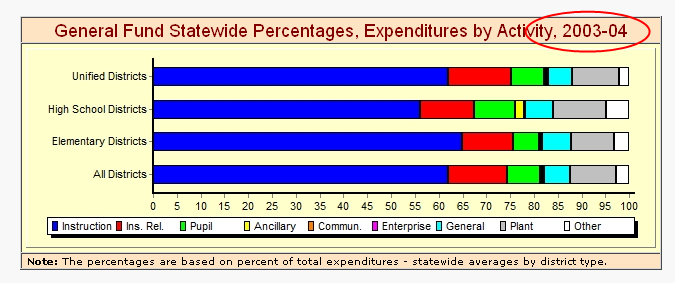
Districts with lower property valuations struggle to raise adequate taxes to meet minimum educational standards. They may have to tax homeowners at a higher rate than a neighboring district, raising legal questions about uniformity and proportionality. The disparity in valuation was the subject of the 1997 Claremont decision by the New Hampshire Supreme Court. At the time, local districts provided 75% to 89% of funding for elementary and secondary education. The state’s general fund provided only 8% of school needs. The decision forced the state to distribute tax revenues among districts to meet adequate education standards for all children in the state. A 2017 analysis found that states now provide almost half of public education funding, relying on income tax revenue to smooth disparities in income among districts within each state.
People do not like paying taxes but grudgingly accept them. People elect local officials to decide on spending priorities yet some homeowners object to the way their taxes are spent. On my property tax bill are eleven items which include funding for schools, the city’s bonds, police, fire, libraries and flood control. Homeowners might prefer a questionnaire of thirty categories of spending which allowed them to allocate their tax dollars by percentage when they paid their property tax each year. In my district, a half-percent goes to affordable housing, three percent to social services. Some might prefer 5% or more. A homeowner paying online could elect to answer the questionnaire online. Would homeowners respond? Next week I will begin an exploration of various aspects of consumption, the chief component of our economy.
Keywords: housing, home prices, mortgage, property tax
Property taxes by zip code and state can be found at Smart Asset Median home prices by state are at Bank Rate Median Sales Price of Homes Sold in the U.S. is FRED Series MSPUS at https://fred.stlouisfed.org/ Median Household Income in the U.S. is series MEHOINUSA646N. The ratio of mortgage payments to disposable personal income can be found here. The home price to property tax ratio can be found here
This week’s letter is about the effect of tax revenues on government, on the economy and the role that taxes play in our lives. Tax revenues are the income of a government at all levels – federal, municipal and state. Those revenues fund the courts and prisons, the police, the roads and cultural institutions that connect people together, yet no one wants to pay them. The essence of a tax is a private payment for a public benefit. Few object to the opposite, a public payment for a private benefit when they are on the receiving end of such a subsidy.
Regardless of the amount that people pay in taxes, they feel that they have a right to complain about any good or service that a government provides. It’s in the Constitution. First Amendment – freedom of speech. For those who work in a democratic government, the unpopularity of taxes presents an existential conflict. Paul Samuelson (1947) pointed out the difficulty of designing a purely lump-sum tax or subsidy. A lump-sum tax is like a head tax, a fixed amount of tax regardless of a person’s circumstances. Under such a system, the wealthiest and poorest person pay the same amount of tax. This violates a sense of proportionality that is a guiding ethical principle.
A fixed single rate of tax answers concerns of proportionality. As an example, many districts enact a set rate for residential real estate. However, states have been reluctant to adopt a single or flat rate of income tax. In 1987, Colorado was the first state to adopt a single tax rate, according to the Tax Foundation. Other states were slow to follow Colorado’s lead and less than a quarter of the states have adopted a flat tax rate. Revenue and proportionality are not the only concerns. By its nature, a democratic government is not fair. People elect representatives who will maximize their benefits and minimize their taxes. Politicians naturally want to lighten the tax load of regular voters. In a flat tax system like the one in Colorado, politicians have amended the definition of taxable income to benefit some taxpayer groups at the expense of other groups. Pension income like Social Security and state retirement plans is not subject to state income tax.
The federal government and the majority of the states enact a graduated income tax that penalizes effort at the margin. An employee who works an occasional day of overtime may be surprised by the additional taxes taken out of that additional pay. Payroll software treats that extra amount as though the employee worked overtime every week, increasing the annual income used to calculate the tax rate on that additional income.
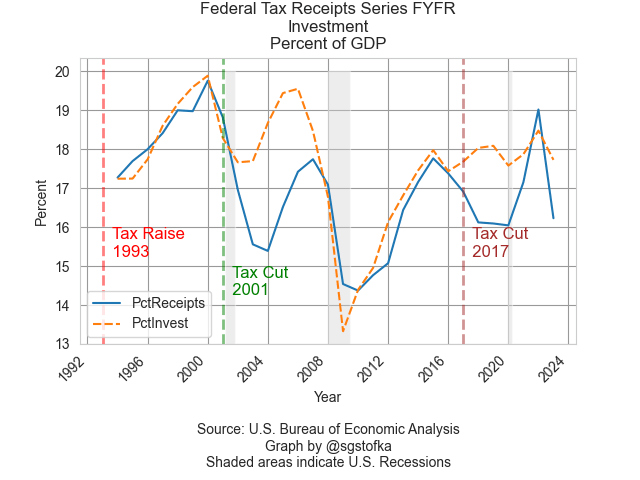
Republican politicians routinely champion their principle of low taxes. The justification for the tax cuts in the 1980s was based on an idea put forth in 1974 by the economist Arthur Laffer who drew an inverted curve on a napkin to illustrate the idea that higher tax rates might lead to lower tax revenues. Despite repeated evidence that lower tax rates lead to lower tax revenues, Republicans have clung to the idea. In the graph below, I have charted federal tax revenues as a percent of GDP. They do not include Social Security taxes.
According to the theory behind the Laffer Curve, lower taxes should spur more investment, more output, higher incomes and higher tax revenues. As we see in the graph above, tax raises led to higher revenues soon after they were enacted. Tax cuts did not. Believers in the theory claim that the cuts can take several years to work but this makes it hard to identify causality. In the graph below, I have added in investment as a percent of GDP.
The Bush tax cuts in 2001 certainly helped arrest the decline in investment following the “dot-com bust.” However, too much of that investment went into residential housing and led to the housing boom that preceded the financial crisis. Those tax cuts expired in 2010 and both investment and tax revenues improved. That raises the question: did higher taxes in 1993 and 2010 produce more investment? On principle, it seems unlikely. Following the 2017 tax cuts known by their acronym TCJA, investment again reversed a decline but had little effect on tax revenues. The rise in revenues as a percent of GDP was due to the fall in output as a result of the pandemic.
According to the neoclassical economist’s narrative, savings provide the source of investment. Taxes reduce savings and therefore reduce investment. Italian economist Pietro Sraffa (1932) reiterated a point made by Sir Dennis Robertson that savings were an inducement to more investment as well as a source of investment. Investment occurs in the period before consumption. People have money to save for two reasons. The first is that their incomes increase from new investment in production. Secondly, there are not enough goods in the marketplace to induce them to spend that extra income. The mismatch in supply and demand gives companies pricing power. Investors rush in to take advantage of the additional demand and the flow of new savings gives banks the confidence to make more loans.
For the past thirty years, federal revenues excluding social security taxes have averaged 17% of GDP. For that same period, the government spent 18.6% of GDP. The deficits have been persistent because the federal government consistently spends more than it taxes, an analysis confirmed by the Congressional Budget Office in a recent report. Republican lawmakers try to choke tax revenues to “Starve the Beast” – the beast being the size and reach of the federal government. To Democratic policymakers, our society needs constant remodeling, so they always have a plan for extra tax revenue. Neither party seems willing to resolve this political push-me-pull-you and the public has become used to deficits. There is always one more war to fight, one more wrong to right.
In this week’s letter I will continue to look at subsidies. Subsidies are created by legislation or agency interpretation that dispenses benefits to people, businesses and institutions. There are two forms of subsidy: a monetary credit of some sort, and an ownership credit, i.e., the granting of a property right. The monetary form includes tax credits and tax expenditures that can be calculated or estimated in dollar amounts. Last week, I noted that some of the biggest tax expenditures were the non-taxability of employer paid health insurance premiums and pension plans. The ownership form includes water rights and land use rights. Unlike the right to vote, these are rights related to the ownership of a physical property or the benefits of a property.
An ownership subsidy can be indirect. A century ago, the western states divvied up water rights to the Colorado River according to the doctrine of prior appropriation which mandates that if one party does not use their share, it is available to the other parties. Water is a scarce resource in this arid region of the country so this principle makes sense. In the wetter eastern states, water rights are based on a common law riparian system where ownership of the right is not coupled with use. Federal water rights are based on this common law system so there is an inevitable conflict whenever the western states cannot resolve their allocation treaties. Today, Colorado does not use all of its allotment while California uses more than its allotment. California does not send the state of Colorado a check every year for the water they use and is a form of indirect subsidy.
Monetary subsidies include agricultural subsidies that I discussed last week. Others include tax credits for buyers of electric cars and homeowners who install solar panels. The oil and gas industry as well as renewable energy producers receive many tax credits. Spending on public transportation includes subways, buses and light rail as well as the roads and highways that motorists use to get to work. Subsidies that support social welfare include public and private schools as well as the school vouchers doled out to parents of schoolchildren. Support programs include subsidies for housing, food and health expenses that involve many tangled cross subsidies. A large retail company can offer discounted merchandise by paying their employees lower wages and the reduced income makes those employees eligible for social assistance programs.
In this jungle of subsidies, it is difficult to compute a net subsidy benefit or deficit. Two-thirds of a homeowner’s property tax might support public schools in their district but they have no kids. Is that fair? They shop at a discount retailer and save hundreds of dollars annually because the retailer can pay its employees lower wages. When this homeowner buys gas, they provide a small subsidy to fossil fuel producers and the farmers who grow corn for ethanol. They buy milk at a lower price because of a government milk support program that is paid for by all taxpayers, even those who do not drink milk. If they eat hamburger, they benefit from grazing subsidies on federal land. The homeowner does not use bus or light rail but they live in a district that includes a sales tax for those systems. Why can’t we just have a free market with no government interference?
The concept of the free market is a useful abstraction but a dangerous idea when politicians and economists advocate for that reality. A “free market” and a “fair market” are oxymorons. A market cannot be free of government influence because all three branches of government are adjudicators, instrumental in awarding and enforcing property claims and the rules of exchange. Whatever the form of money used in a market, governments regulate it. To be fair, a rule giver would treat everyone equally but the world is composed of discrete goods and services that are not infinitesimally divisible. We live in a “clumpy” world and there is no universal standard of fairness to divide the clumps. Some people advocate for equality of opportunity. Others argue for equality of outcome. These abstractions help us analyze the world but we cannot build a society with either and retain a dynamic flow of both opportunity and outcome.
Governments award monopolies for the public good. Companies secure monopolies and market restrictions from government to reduce competition. The government is part of the market as a buyer of goods and services. Some authority must regulate the exchange of ownership that accompanies the exchange of goods and services. The protection of person and property in a market requires either a police presence or an impromptu coalition of people who enforce rules with force if necessary. Some authority must certify weights and measures or a “free market” becomes a “market of force,” a melee of arguments and fights.
We live our lives in a storm of electromagnetic waves, unaware of most of them but dependent on many of them. We rarely make a transaction without the involvement of some subsidy yet many of us live with the illusion of independence. Some pay more in income tax or property tax. Some help coach the school soccer team. As nodes in a social web we cannot calculate the cost of our contribution to the strength of that web. At any point in time some of us contribute more, some less. Over a lifetime our contribution varies from less to more and less again. Our society flourishes when we spend less energy keeping score.
Hope everyone had a good Thanksgiving. This week’s letter is about a type of income that we don’t often think about, how that affects asset values and a proposal to increase homeownership. With left over buying power, people purchase assets in the hope that the buying power of the asset grows faster than inflation. There are two types of assets: those that produce future consumption flows and collectibles whose resale value increases because they are unique, desired and in limited supply. An example of the first type is a house. An example of the second type is a painting. Let’s look at the first type.
House Equals Future Shelter
A house is a present embodiment of current and future shelter. The value of that utility depends on environmental factors like schools, crime, parks, access to recreation, shopping and entertainment. These affect a home’s value and are outside a homeowner’s control. A school district’s rating in 2042 may be quite different than its current rating. Our capitalist system and U.S. tax law favors home ownership in several ways. The monthly shelter utility that a home provides is capitalized into the value of a property. Every consumption requires an income, what economists call an imputed rental income. Two thirds of homes are owned by the person living there (Schnabel, 2022) and a little more than half are mortgage free. Unlike reinvested capital gains in a mutual fund, this imputed income is not taxed to the homeowner. Let me give an example.
If the market rate for renting a similar home were $2000 a month, that is an implicit income to the homeowner. Because there is no state or federal tax on that income, the gross amount of that $2000 would be about $2400. That’s almost $30,000 a year. After monthly costs for taxes, insurance and maintenance, the annual implicit operating income of the property might be $25,000. At a cap rate of 5% (to make the math easy), the capital value of the property is $500,000. Each year, Congress requires the U.S. Treasury to estimate the various tax expenditures like these where Congress excludes certain income items from taxes. The implied income on owning a home is called “imputed rental income” and in 2021 the Treasury (2022) estimated that the income tax not collected was $131 billion. How much is that? A third of the $392 billion paid in interest on the public debt. If we did have to pay taxes on that imputed income, it would lower the value of our homes. For many decades, Congress has not dared to include that implied income.
Mutual Fund Capital Gains
Let’s return to the subject of reinvested capital gains in a taxable mutual fund held outside of an IRA or pension type account. Some of what I am about to say involves tax liability so I will state at the outset that one should consult a tax professional before making any personal buy and sell decisions. When some part of a fund’s holdings are sold, a capital gain is realized from the sale and paid to the investor who owns the mutual fund. If the investor has elected to have dividends and capital gains reinvested, the money is automatically used to repurchase more shares of the mutual fund. The balance of the account may change little but there is a taxable event that has to be included in income when the investor completes their taxes for the year. Many mutual fund holdings recognize capital gains in December.
Mutual fund companies provide the tax basis or unrealized gain/loss for each fund but often do not include that information on the statement. The unrealized gain is the price appreciation has not been taxed yet. For example, the dollar value of a fund may be $50,000 and the unrealized gain $5,000. This is more typical of a managed fund than an index fund which does not adjust its portfolio as frequently as a managed fund. If an investor were to sell the fund to raise cash, they would pay taxes on the $5,000, not the $50,000. The unrealized gain in an index fund might by 70% of the value of the fund. If the fund value is $50,000, the unrealized gain could be $35,000 and the investor would owe taxes on that amount. An investor can minimize their tax liability with a judicious choice of which fund to sell. Again, consult a tax professional for your personal situation.
Affordable Homeownership
Let’s visit an imaginary world where people do not have to pay property taxes outright. Each year they can elect to sell a portion of their property to the city or other taxing authority. Cities sometimes place tax liens on properties when a tax is not paid. This would be like a voluntary lien making the city a temporary part owner of the property until the homeowner sells it.
Imagine that a homeowner owns a home worth $400,000. For ten years, they have elected to have the city deduct an annual $2000 average property tax from the value of the home. Over the ten year period, the accrued sum is $20,000 plus an interest fee that is added to the principal sum of the tax. These voluntary tax liens would be visible to a lending institution so that the sum would lower the home’s value for a HELOC, or second mortgage. The city would report that annual amount each year as an imputed income to the homeowner and the homeowner would have to pay income taxes on it. At a 20% effective federal and state tax rate, the out-of-pocket expense would be about $480 on $2000. After the 2017 tax law TCJA, property taxes are no longer deductible so the homeowner has to earn $2400 to pay the $2000 tax outright. There is a slight change in income tax revenue to the various levels of government. When a home is sold those tax liens would be paid back to the city.
Why don’t we have such a system in place now? In the U.S. private entities own most of the capital. Some people would be uncomfortable knowing that a government authority had some legal claim to their property but they could opt out. In a pre-computer age, the accounting would have been a nightmare. Such a system is feasible today. Mutual fund companies have demonstrated that they can track the complex capital positions of their customers. Cities can do the same.
Such a system would make home ownership more affordable for a lot of people without affecting those homeowners who preferred to pay the property tax outright as we do under the current system. Investment companies would be eager to amortize those voluntary tax liens held by city governments. In the event of another financial crisis, a decline in housing prices and a rise in foreclosures, the city would be first lienholder, first in line to get paid when the property is foreclosed. Interest groups that advocate for affordable housing would be joined with investment and pension companies who wanted to underwrite the bonds for such a program.
A Capitalist System of Greater Inclusion
Some blame our capitalist system for the inequities in our society. The fault lies in us, not the capitalist system. Feudalism, mercantilism, capitalism, socialism, communism and fascism are systems of rules that embody a relationship of individuals to 1) property and the manner of production, both current and future, 2) the society, our families and communities, 3) the government that recognizes those relationships. The capitalist system is the most versatile ever invented and yes, it has been used to exclude people just as the other systems have been used to weaken some classes of people. The capitalist system can be extended to include and strengthen more of us. This homeownership policy could broaden that inclusion.
On September 15, 2008 the trading firm Lehman Brothers declared bankruptcy. A small number of outstanding shares traded on the stock market that day. The SP500 lost almost 5% of its value. New Yorkers gathered in Times Square to watch the ticker tape display. A small number of people controlled the direction of the market and constructed a reality that they sold to the rest of us.
In politics, a few key people control
the direction and fate of legislation. In the Senate, the Majority Leader decides
whether to bring legislation up for a vote. Even if a bill makes it out of a
Senate committee, the Majority Leader can stop it from reaching the full
Senate. Unlike the Majority Leader in
the House, his position is practically impregnable. Legislation vetoed by the President
can be overridden by Congress. There is no recourse to a veto by the Senate
Majority Leader.
The current holder of the position
is Sen. Mitch McConnell from Kentucky. He is up again for re-election next year.
When Democrats held the Senate, Sen. Harry Reid ruled with a similar disregard
for others in his own party as well as the minority.
In 2014, 800,000 voters chose McConnell. In effect, less than 1% of the country’s voters control the course of legislation in the U.S. Did the founders of this country intend that one person should control Congress? James Madison, the chief crafter of the Constitution, worried that a majority would overwhelm and take advantage of a minority (Feldman, 2017). Accordingly, the Constitution is structured so that a minority controls power. However, one person is a very small minority. What would the founders think of the current arrangement in Congress? If Americans wanted a king with veto-proof power, America would still be a colony of Britain.
Our method of electing a President is a 230-year-old compromise between republicanism and democracy. An electoral college composed of men not subject to the passions of the crowd would elect the leader of the country. It was an Enlightenment model of dispassionate rationality.
Even if they had Fox News and CNN on Election night at the time of the founding, all the thirteen states were in the same Eastern time zone. At a recent symposium on our election, former RNC chair Michael Steele pointed out the west coast states are mostly taken out of the Presidential election (C-Span.org, 2019). By 5 P.M. Pacific time, they are discouraged from voting because much of the action has already been called. The founders did not design a system for four time zones.
We have 50 states but the election for President takes place in eight to twelve battleground states. Most polling is done at the national level, not in the battleground states. Many polls do not accurately survey the sentiments of the critical minority of voters in the states that will decide the election.
A minority of people own and control
much of the wealth of the world. They now pay a lower percentage of their
income than the bottom 50%. That includes federal, state and local taxes. In the
Triumph of Injustice, due to be released next week, authors Saez and Zucman
(2019) tally up the tax bills for the rich and ultra-rich. The book is #1 bestseller
at Amazon and it hasn’t been published yet.
In 1980, the top 1% paid 47% of their income in total taxes at all levels. Now they are down to 23% and below the rate paid by the bottom half of incomes. Two sets of rules – one set for the peasants and one for the castle royalty. The Constitution prohibits the granting of titles so the rich granted themselves the titles. This book is sure to get a lot of media attention. Like we need more controversy.
Notes:
Feldman, N. (2017). Three Lives of James Madison: genius,
partisan, president. [Print]. New
York: Random House.
Effective tax rates: If you make $100,000 and you pay $25,000 in federal, social security, state, sales and property tax, then your total effective tax rate is 25%.
Two quick asides before I get into this week’s topic. A cricket perched on the top of a 7′ fence. It drew up to the edge of the top rail, learned forward, raised its rear legs as though to jump, then settled back. It did this twice more before jumping 8′ out then down into a soft landing on some ground cover. How far can crickets see, how often do they injure a leg if they land incorrectly and do they get afraid?
The bulk of the personal savings in this country is held by the top 20% of incomes, and it is this income group that received the lion’s share of the 2017 tax cuts. It’s OK to bash the rich but that top 20% probably includes our doctor and dentist. Before you start drilling or cutting me, I want to make it perfectly clear that I was not criticizing you, Doc.
In 2016, the top quintile – the top 20% – earned 2/3rds of the interest and dividend income (Note #1). Due to falling interest rates over the past three decades, real interest and dividend income has not changed. Real capital has doubled and yes, much of it went to those at the top, but the income from that capital has not changed. That is a huge cost – a hidden tax that gets little press. The real value of the public debt of the Federal Government has quadrupled since 1990, but it pays only 20% more in real interest than it did in 1990 (Note #2). Here’s a graph of personal interest and dividend income adjusted to constant 2012 dollars. Thirty years of flat.
Ok, now on to a story. Economists build mathematical models of an economy. I wanted to construct a story that builds an economy that gradually grows in complexity and maybe it would help clarify the relationships of money, institutions and people.
Let’s imagine a group of people who move into an isolated mining town abandoned several years earlier. The houses and infrastructure need some repairs but are serviceable and the community will be self-sufficient for now. The homeowners form an association to coordinate common needs.
The association needs to hire lawn, maintenance and bookkeeping services, and security guards to police the area and keep the owners safe. How does the association pay for the services? They assess each homeowner a monthly fee based on the size of the home. How do the homeowners pay the monthly fee? Each homeowner does some of the services needed. Some clean out the gutters, others fix the plumbing, some keep the books and some patrol the area at night. They work off the monthly fee.
How do they keep track of how much each homeowner has worked? The association keeps a ledger that records each owner’s fee and the amount worked off. The residents sometimes trade among themselves, but it is rare because barter requires a coincidence of wants, as economists call it. Mary, an owner, needs some wood for a project and Jack has some extra wood. They could trade but Mary doesn’t have anything that Jack wants. He tells Mary to go down to the association office and take some of her time worked off her ledger and credit it to Jack’s monthly fee. Mary does this and they are both happy (Note #3).
As other owners learn of this idea and start trading work credits, the association realizes it needs a new system. It prints little pieces of paper as a substitute for work credits and hands them out to owners who perform services for the association. These pieces of paper are called Money (Note #4).
The
money represents the association’s accounts receivable, the fees owed and
accruing to the association, and the pay that the association owes the owners
for the work they have done. Then the association notices that there are some
owners who are not doing as well as others. It assesses an extra fee each month
from those with larger homes and gives that money to needy homeowners. These are called transfers because the owners
who receive the money do not trade any real goods or services to the association.
In this case the association acts as a broker between two people. Let’s call
these passive transfers. We can lump these transfers together with exchanges of
goods and services.
Then
some people from outside the area start stealing stuff from the homeowners. The
association needs to hire more security guards, but homeowners don’t want to
pay a special one-time assessment to pay for the extra guards.
Instead
of printing more Money, the association prints pieces of paper called Debt.
Homeowners who have saved some of their money can trade it in for Debt and the
association will pay them interest. Homeowners like that idea because Money
earns no interest and Debt does. The association uses the Money to pay for the
extra security guards.
But
there are not enough people who want to trade in their Money for Debt, so the
association prints more Money to pay the extra security guards.
Let’s pause our story here to reflect on what the words inflation and deflation mean. Inflation is an increase in overall prices in an economy; deflation is a decrease (Note #5). Inflation occurs when the supply of money fuels a demand for goods and services that is greater than the supply of goods and services. Ok, back to our story.
So
far so good. All the Money that the association has printed equals a trade or a
passive transfer. Let’s say that the association needs more security guards and
no one else wants to work as a security guard because they can make more Money
doing jobs for other homeowners. The association makes a rule called a Draft.
Homeowners of a certain age and sex who do not want to work as security guards
will be locked up in the storage room of the community center.
Now
there’s a problem. Because the association has taken some homeowners out of the
customary work force, those people are not available for doing jobs for other
homeowners, who must pay more to contract services. This is one of several
paths that leads to inflation. To combat that, the association sets price
controls and limits the goods that homeowners can purchase. After a while, the
outsiders are driven off and the size of the security force returns to its
former levels.
Now all the extra Money that the association printed to pay for the security force has to be destroyed. As homeowners pay their dues, the association retires some of the money and shrinks the Money supply. However, there is a time lag, and prices rise sharply (Note #6).
Over
the ensuing decades, there are other emergencies – flooding after several days
of rain, a sinkhole that formed under one of the roadways, and a sewer system
that needed to be dug up and replaced. The association printed more Debt to cover
some of the costs, but it had to print more Money to pay for the balance of
repairs. Because the rise in the supply of Money was a trade for goods and
services, inflation remained tame.
There
didn’t seem to be any negatives to printing more Money, so the homeowners
passed a resolution requiring that the association print and pay Money to
homeowners who were down on their luck. These were active transfers – payments
to homeowners without a trade in goods and services and without some offsetting
payment by the other homeowners.
So
far in our story we have several elements that correspond with the real world: currency,
taxes, social insurance, the creation of money and debt and the need to pay for
defense and catastrophic events. Let’s continue the story.
With
the newly printed Money, those poorer homeowners could now buy more goods and
services. The increased demand caused prices to rise and all the homeowners
began to complain. Realizing their mistake, they voted on an austerity program
of higher homeowner fees and lower active transfers to poorer homeowners.
Because
homeowners had to pay higher fees, they didn’t have enough extra Money to hire
other services. Some residents approached the association and offered to repair
fences and other maintenance jobs, but the association said no; it was on an
austerity program and cutting expenses. Some residents simply couldn’t pay
their fees and the problem grew. The association now found that it received
less Money than before the higher fees and Austerity program. It cut expenses
even more, but this only aggravated the problem.
Finally,
the association ended their Austerity program. They printed more Money and hired
homeowners to make repairs. Several homeowners came up with a different idea.
There is another housing development called the Forners a few miles away. They
are poorer and produce some goods for a lower price. The homeowners can buy
stuff from the Forners and save money. There are three advantages to this
program:
Things bought from the Forners are
cheaper.
Because the homeowners will not be
using local resources, there will be less upward pressure on prices.
The homeowners will pay the
association for the goods bought from the Forners and the association will pay
the Forners community with Debt, not Money. Since it is the creation of Money that
led to higher prices, this arrangement will help keep inflation stable.
As
the homeowners buy more and more stuff from the Forners, the money supply
remains stable or decreases. After several years, homeowners are buying too
much stuff from the Forners and there is less work available in the community.
As homeowners cannot find work, they again fall behind in paying their monthly
fees.
Several
of those in the association realize that they don’t have enough Money to go
around in the community. There is a lot to do, and the homeowners draw up a
wish list: repairs to the roads and helping older homeowners with shopping or
repairs around their home are suggested first. A person who is out of work
offers to lead tours and explain the biology of trees for schoolchildren. The
common lot near the clubhouse could use some flowers, another homeowner
suggests. I could use a babysitter more often, one suggests, and everyone nods
in agreement. I could teach a personal finance class, a homeowner offers.
Another offers to read to homeowners with bad eyesight and be a walking
companion to those who want to get more exercise.
Everyone who contributes to the welfare of the community gets paid with Money that is created by the association. What should we call the program? One person suggests “The Paid Volunteer Program,” and some people like that. Another suggests, “The Job Guarantee Program” and everyone likes that name so that’s what they called it (Note #7).
So
far in this story we have two key elements of an organized society:
Money – a paper currency created by the
homeowner association.
Debt – the amount the association owes
to homeowners (domestic) and the Forners (international).
Next
week I hope to continue this story with a transition to a digital currency, banks
and loans.
//////////////////////
Notes:
In 2016, the top 20% of incomes with more than $200K in income, earned more than 2/3rds of the total interest and dividends. IRS data, Table 1.4
In 2018 dollars, the publicly held debt of the Federal government was $4 trillion in 1990, and $16 trillion now. In 2018 dollars, interest expense was $500B in 1990, and is $600B now.
In David Graeber’s Debt: The First 5000 Years, there is no record of any early societies that had a barter system. They had a ledger or money system from the start.
In the Wealth of Nations, Adam Smith – the “father” of economics – defined money as that which has no other value than to be exchanged for a good. This essential characteristic makes money unique and differentiates paper money from other mediums of exchange like gold and silver.
An easy memory trick to distinguish inflation from deflation. INflation = Increase in prices. DEflation = DEcrease.
The account of the increased force of security guards – and its effect on prices and regulations – is the simple story of money and inflation during WW2 and the years immediately following. The process of rebalancing the money supply by the central bank is difficult. Monetary policy during the 1950s was a chief contributor to four recessions in less than 15 years following the war.
A Job Guarantee program is a key aspect of Modern Monetary Theory.
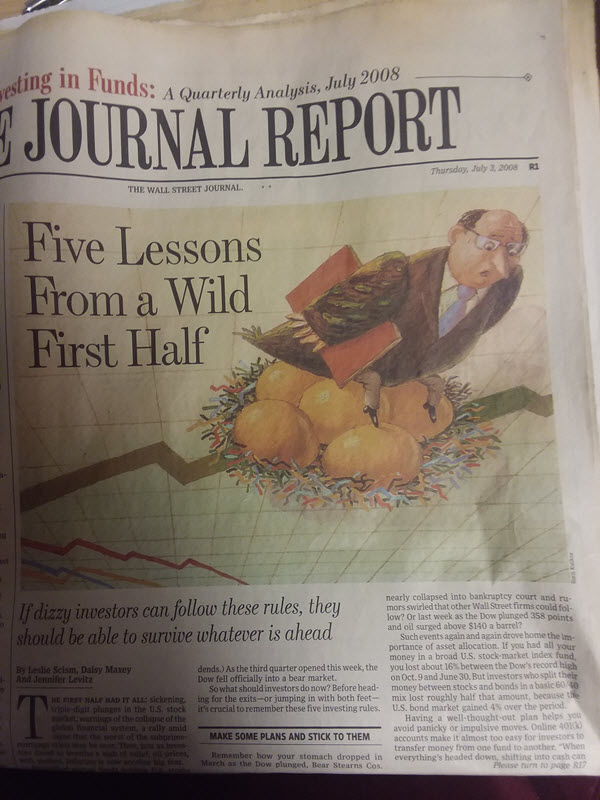
This past week, I found a July 2008 Wall St. Journal used as shelf liner. On the eve of 2018, a look back has some useful reminders for a casual investor.
Most of us remember the financial crisis that erupted in September 2008. What we may not remember is that the first half of that year was very volatile. In reporting about the first half, there were “warnings of the collapse of the global financial system.”
In the first six months of 2008, 703,000 jobs had been lost. The job losses continued until March of 2010 and totaled a staggering 8 million. In early July 2008, the stock market had lost 16% from its high mark in October 2007 but a balanced portfolio of 60% stocks and 40% bonds had lost only 8%. To prepare for a difficult second half of 2008, investors were cautioned to:
1) Balance
2) Diversity
3) Spend less and invest more
4) Don’t pay high investment fees
5) Don’t get greedy and chase get rich investments
The advice is timeless.
/////////////////////////
Tax Reform
In a holiday week, thousands of residents in coastal states lined up at their local tax assessor in order to pre-pay 2018 property taxes in 2017. Most of these residents have annual property taxes that exceed the $10,000 cap on all state and local taxes that can be deducted on 2018 Federal taxes.
The IRS said that they would not allow deductions for prepaid taxes unless the local district had assessed the tax by December 31, 2017. We may see lawsuits over the definition of the word “assess.” When is a homeowner assessed a property tax? When they receive a bill? When the district announces the rate for the following year?
In their battle against the IRS, Republicans have cut the agency’s funding so much that the IRS does not have the resources to perform audits on several hundred thousand to determine the status of assessment. The courts will likely weigh in on the question. Come next November, voters will register their opinions.
The New York Times featured a several question calculator to estimate the effect of the tax bill on your 2018 taxes.
///////////////////////
Income
Economists have noted the decades long decline in inflation-adjusted wages. Since 1973, the share of national income going to wages and salaries has declined by 14%.
Employee benefits as a percent of gross domestic income have grown by a third since the 1970s. Of course, a person cannot spend benefits.
Even after the increase in benefits, total income is down. In 1973, 50% of Gross Domestic Income (GDI) went to wages and salaries + 7.5% to benefits for a total of 57.5%. In 2016, 42% went to wages + 10% to benefits = 52%. Total compensation is down 10%.
As the wealth of the affluent continues to grow, the ratio of net wealth to disposable income has reached an all-time high.
It is inevitable that extreme imbalances must revert to mean. The last two peaks preceded severe asset repricings.
In any lively discussion of public education – its effectiveness, the spending and taxes required – some people bring out their swords, others their shields, and some are armed with both. Armed only with a crayon, I will examine some of these trends.
Let’s look first at higher education spending. The National Center for Education Statistics (NCES) at the U.S. Dept of Education reported that real – that is, inflation adjusted – spending per pupil had increased 233% in the past 31 years, an annual growth rate in real dollars of 2.8%.
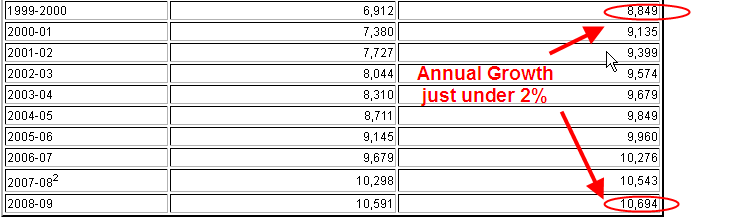
NCES reports a slower spending growth in K-12 education – 185% in 28 years, or an annual growth rate of 2.2%.
But the annual growth rate during the past decade, 1999 – 2009, has slowed to just under 2%.
When we zoom in on the spending growth during the 1960s and 1970s, we see a real growth rate of 3.6%
What we see in the per pupil data is a gradual slowing down of the real growth rate of spending. Those who claim that there have been spending cuts in education have not looked at the data. There have been no cuts in real spending, only reductions in the rate of growth.
Some decry “austerity” policies recently undertaken in some European countries – the U.K. is an example – claiming that a country pursuing these policies has cut spending. When we look at the spending data, we find that there have been no decreases in real spending, only in the growth of spending. This misconception is common and results from a comparison of what we expect and what happens.
If we have usually received a wage or salary increase of 3% each year, we come to expect a 3% increase. If we get a 2% increase this year, it is 33% less than our expections and feels like a cut. A retiree who has become accustomed to an annual 8% return on her investments, may feel that she has lost money if her investments only gain 5% this year. It does no good to mention that she has really not lost anything.
Let’s get up in our hot air balloons and travel to California, where the size of its economy puts the state above many countries. California has often been the leading edge of trends that spread to the other states. Ed-Data reports that per pupil spending has flattened since the recession started in 2008. In real dollars, there has been NO GROWTH in per pupil spending in the past ten years.
Another complaint from teachers is that money is increasingly being spent on administrative costs, not teaching. In California, teachers still command the lion’s share of spending – more than 60%.
The proportion of teacher spending has remained relatively constant – above 60% – in the past ten years.
What has been growing? On a per pupil basis, “Services and Other Operating Expenses” have grown 4% per year, or 1.8% real annual growth, above the 2.2% annual growth in inflation. Administration expenses have grown at the same rate of inflation so that real growth has been flat. However, spending on teacher salaries has declined in real money at an annual rate of .7%. However, their benefits expenses have grown 1.4% annually in real dollars. Again, most people do not “feel” the cost of a benefit increase. The bottom line to most of us is what we bring home. It does not pay to tell a K-12 teacher that they are actually receiving a slight increase in real total compensation.
In California, as in many states, property taxes are a major component of revenues for K-12 education. Over the past nine years, revenues from property taxes for education have declined 3% annually in real money. For each student, there is $500 less money available from property taxes than it would have been if property tax revenues had kept up with inflation. As a percent of total revenue for K-12 education, property taxes make up a little over 60%.
In 2011-2012, property tax revenues essentially paid teacher salaries. Ten years ago, the percentage of revenues from property taxes was about 6% higher.
Other State revenues have had to make up for the shortfall in property taxes; the gap is about $1000 per student. The problem would be even worse if it were not for the slight decline in students for the past 8 years.
While California faces challenges from declining property tax revenues, what about the rest of the country? Let’s climb back in our data balloon and look at student enrollment throughout the country. The NCES reports the same slight decline in K-12 enrollment. However, they estimate a total 6% growth in K-12 enrollment in this decade.
As K-12 enrollment grew by a little more than 1 million in the 2000s, post secondary education enrollment grew by 6 million, or 37%, to over 21 million. (Source http://nces.ed.gov/fastfacts/display.asp?id=98). The growth rate in older students, those aged 25+ is even faster, rising 42%. In this decade, “NCES projects a rise of 11 percent in enrollments of students under 25, and a rise of 20 percent in enrollments of students 25 and over.”
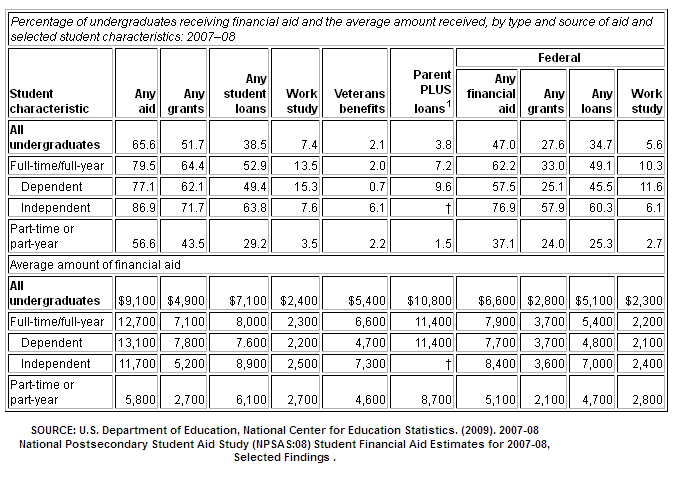
The ratio of K-12 students to post-12 students was 28% in 2000; a decade later, it was 38%. While K-12 enrollment is projected to increase for the rest of the decade, post-12 enrollment is estimated to be much faster. How do these students pay for college? The most recent data from NCES is at the start of the recession; I would guess that the need for aid has grown mightily since then.
Put all of this in the blender: a declining work force (see my blog two weeks ago), a generational swelling of older people retiring, recovering but not robust state and local revenues, and more demand for K-12 AND post secondary education services. How will politicians react in the midst of so many competing demands for money?
The increasing pressures for money from different segments of the population puts us in the precarious position that we can not afford to go into a recession, an impossible situation since the normal business cycle includes a recession every 7 – 10 years. Europe is already in recession; China’s growth is still robust but slowing; on Friday, India announced a growth rate below 5%, the weakest in four years; in a hopeful sign, Brazil, the economic powerhouse of South America, is projecting GDP growth over 3%, rising up from an anemic 2.7% growth of the past 5 years. (World Bank source)
Slackening demand around the world presents challenges for the U.S. economy, problems that a spastic Congress will only worsen. Y’all be careful out there…


