A Labor-Output Ratio

February 19, 2023

by Stephen Stofka

When analyzing the economies of some developing countries, economists refer to a “resource curse,” a commodity like oil or minerals that a country can sell on the global market. In a developing country, that commodity may become the main source of foreign currency, used to pay for imports of other goods. The extraction of that resource requires capital investment which usually comes from outside the country. If the production of that resource is not nationalized, most of the profits leave the country.

There are a few big winners and a lot of losers. This uneven ratio promotes economic and social inequality. Political instability arises as people within the country want to get a hold on those resources. Some politicians promise to use the profits from the resource to benefit everyone but those who seize power benefit the most. Political priorities determine economic decisions and the production of that resource becomes inefficient.

A key factor in the “resource curse” is that its contribution to GDP is usually far above its contribution to employment. If a mining sector accounts for 2% of employment but contributes 10% to GDP, the ratio of employment / GDP % equals 2%/10%, or 0.2. Ratios that are far below 1 do not promote a healthy economy. Industries that are closer to a 1-1 ratio will produce a more well rounded and vibrant economy because employed people spend their earnings in other sectors of the economy – a diffusion effect. Some economists might say that a low ratio means that capital is being used more efficiently and attracts capital investment. However, that efficiency comes at an undesirable social and economic cost.

 Let’s look at some examples in the U.S. The construction industry contributes 3.9% to GDP (blue line in the graph below) but accounts for 5.1% of employment (red line). Notice that this is the opposite of the example I gave above. The 1.31 ratio of employment/GDP is above 1, meaning that the industry employs more people for the direct value that it adds to the economy.  Construction spending includes remodels and building additions but does not include maintenance and repair (Census Bureau, n.d.). In the chart below, look at how closely GDP and employment move together. The divergence in the two series since the pandemic indicates the distortions in the housing market because of rising interest rates. Builders have put projects on hold but employment in the sector is still rising because of the tight labor market.

The finance sector’s share of the economy has grown since the financial crisis yet employment has remained steady – or stuck, depending on one’s perspective. The great financial crisis put stress on banks, big and small, but the government bailed out only the “systemically important” banks, leaving smaller regional banks to fend for themselves. The larger banks absorbed many smaller banks, leading to a consolidation in the industry. That consolidation and investments in technology helped the sector become more efficient. The ratio is about 0.75, above the 0.2 ratio in the example I gave earlier. I labeled the lines because the colors are reversed.

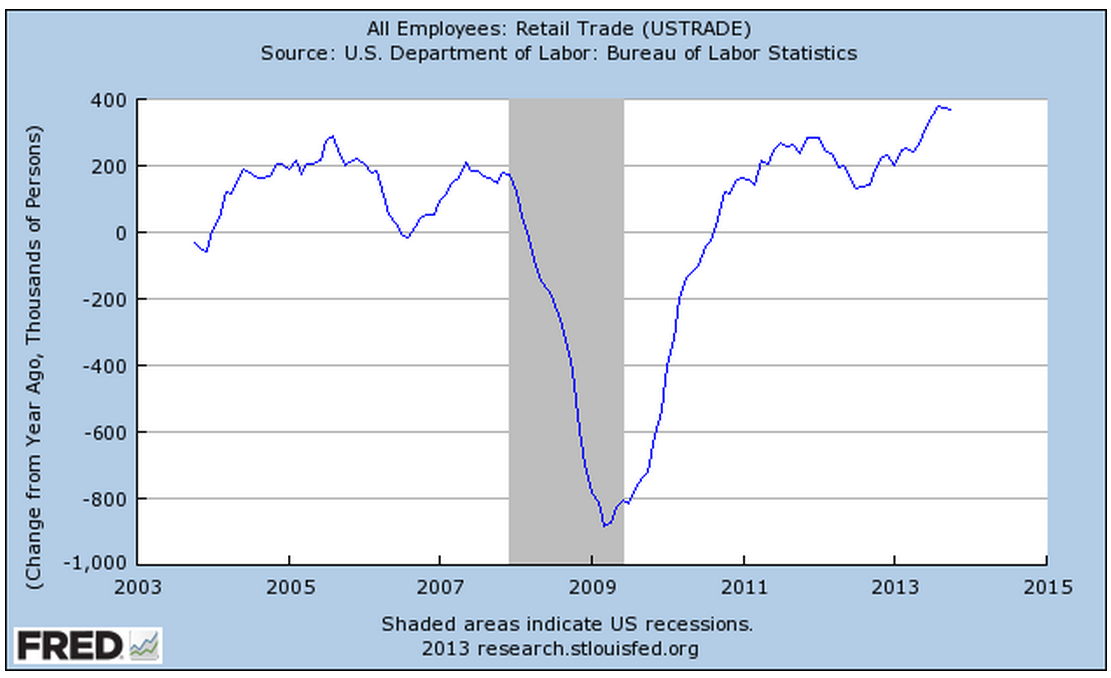
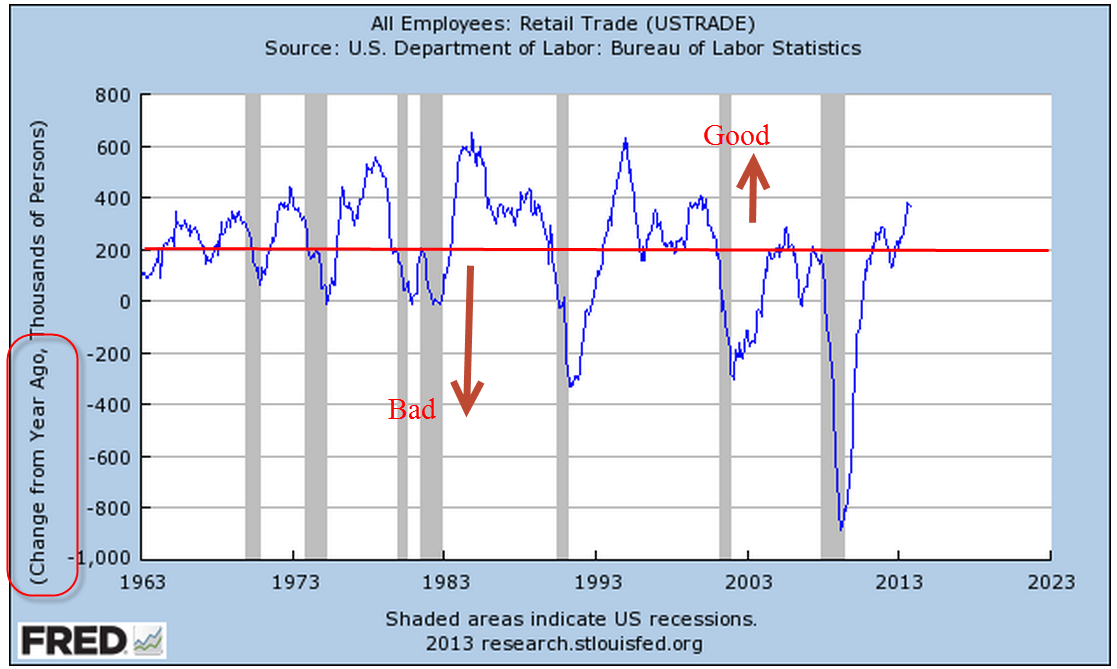
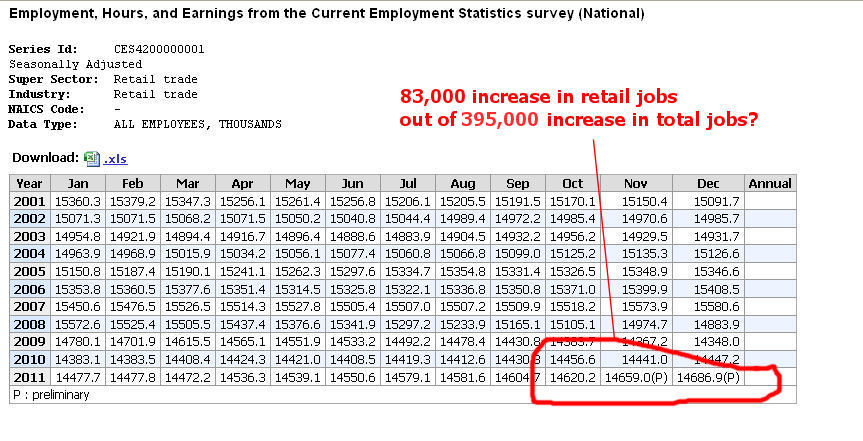
Retail employs a lot of people relative to its contribution to GDP. The ratio is about 1.65. Does that mean retail is an inefficient use of capital? Retail sales taxes pay for many of the city services we enjoy and take for granted. Retail is the glue that holds our communities together.

The manufacturing sector employs fewer people in relation to its GDP contribution. It’s ratio is 0.77, about the same as finance.

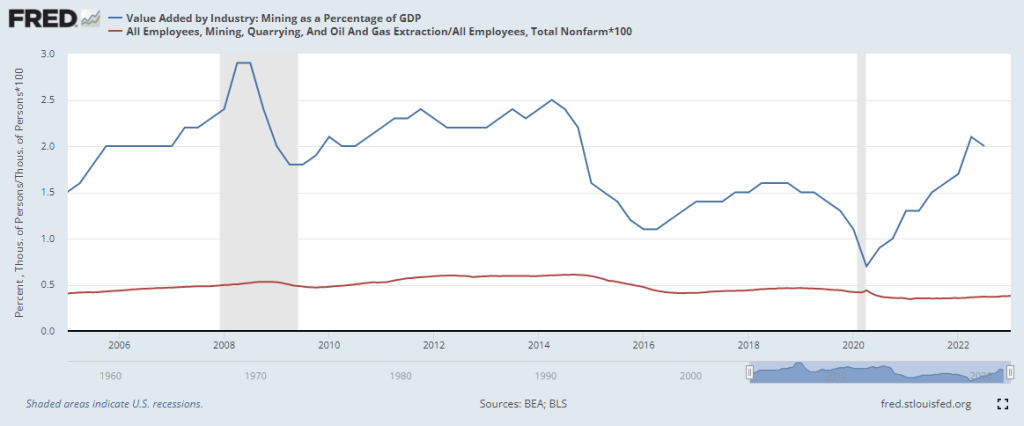
As I noted earlier, the mining sector is capital intensive with a high ratio of GDP to employment. This sector includes gas and oil extraction. In the U.S. that ratio averages about 0.33 but it is erratic global demand. Look at the effect during the pandemic. In our diversified economy, the mining sector contributes only a small amount, like 2%. In a developing country like Namibia in southern Africa, mining accounts for 10% of GDP. In the pandemic year, the demand for minerals declined and Namibia’s economy fell 8%.

Lastly, I will include the contribution of health care, education and social services, which contribute 7.5% to GDP but employ almost a quarter of all workers. Since the financial crisis and the passage of Obamacare, this composite sector contributes an additional 1% to GDP. These sectors include many public goods and services that form the backbone of our society. The 3.0 ratio is the inverse of the mining sector.

To summarize, the construction, retail, health care and education sectors have a ratio above 1. They employ more people for each percentage unit of output. The finance, manufacturing, mining, oil and gas sectors have ratios less than 1, employing fewer people per percentage unit of output. For readers interested in the GDP contribution of other industries, the Federal Reserve maintains a list of charts, linked here [https://fred.stlouisfed.org/release?rid=331].

//////////////////

Photo by Camylla Battani on Unsplash

Census Bureau. (2019, April 15). Construction spending – definitions. United States Census Bureau. Retrieved February 16, 2023, from https://www.census.gov/construction/c30/definitions.html

U.S. Bureau of Economic Analysis, Value Added by Industry: Construction as a Percentage of GDP [VAPGDPC], retrieved from FRED, Federal Reserve Bank of St. Louis; https://fred.stlouisfed.org/series/VAPGDPC, February 12, 2023.

U.S. Bureau of Labor Statistics, All Employees, Construction [USCONS], retrieved from FRED, Federal Reserve Bank of St. Louis; https://fred.stlouisfed.org/series/USCONS, February 12, 2023.

U.S. Bureau of Labor Statistics, All Employees, Total Nonfarm [PAYEMS], retrieved from FRED, Federal Reserve Bank of St. Louis; https://fred.stlouisfed.org/series/PAYEMS, February 12, 2023.

I will not do a complete reference for each series. Here’s the identifiers for each series: Finance Value Added – VAPGDPFI. Employment in finance – USFIRE. Construction employees – USCONS. Retail Value Added – VAPGDPR. Retail Employees – USTRADE. Manufacturing Value Added – VAPGDPMA. Manufacturing Employees – MANEMP. Education, Health Care, Social Services Value Added – VAPGDPHCSA. Employment is a composite of 4 series. Mining Value Added – VAPGDPM. Mining Employment – CES1021000001

Up, Down, Round and Round

November 10th, 2013

Friday’s release of the monthly employment situation showed strong net job gains of 204,000 jobs and big upward revisions to the previously reported gains in August and September. The market should have reacted negatively to these positive numbers (yeh, go figure) in anticipation of the Fed tapering their stimulus program of monthly bond purchases.

But first we must go back to Thursday. The first estimate of real GDP growth in the third quarter came in above even the most optimistic forecasts at 2.8%, about a full percentage point above second quarter growth.  The primary reason for the gains though was the continuing build in inventories.  Inventory building is good in anticipation of robust sales but, as I’ll cover later, consumer spending has not been so robust.  The market reacted to the report with it’s largest daily loss in a few months.

On Friday, the employment report was released an hour before the market opened.  Trading began at the same level as Thursday’s close with little response to the strong job gains.  We can imagine that traders were twittering furiously to each other in the opening hour, trying to gauge the sentiment.  Buy in on strength in the employment numbers or sell on the strength in the employment numbers?  After the initial hesitation, the main index gained continuing momemtum throughout the day, with a final spike at the closing bell.

After digesting some of the numbers in the report, I think that traders realized how weak some of its components were, dimming the probability that the Fed will ease up on the gas pedal.  The Consumer Sentiment Survey, released a half hour after the opening bell, showed a continuing decline.  Within minutes, the market started trading higher.

The first number popping in the employment report is the 702,000 people who dropped out of the labor force.  To put that number in perspective, take a look at the chart below which shows the monthly changes in the labor force for the past ten years.  This is the second worst decline after the decline in December 2009, shortly after the official end of the recession.

This month’s .4% steep drop in the Civilian Force Participation Rate ties the record set in December 2009 when the economy was still on its knees.  The rate has now fallen below the 63% mark, far below the 66% rate of several years ago.

Employment in the core work force aged 25 – 54 actually dropped this past month.  Classifications of employment by age, sex, and education come from the survey of households, not employers, and may have been affected somewhat by the goverment shutdown. But the numbers of the past years show that there has been no recovery for this segment of the population.  In each lifetime, there are stages that last approximately twenty years.  This time of life should be  about building careers, building families, building assets and growing income.  I fear that for too many people in this age group, the slowly growing economy has not been kind.  This affects both a person’s current circumstances and dampens prospects for the future.

The headline job gains and classification of the types of jobs come from a separate survey of employers called the Establishment Survey.  Employers report their payroll count as of the 12th of each month.  Because they received paychecks, federal employees furloughed during the government shutdown in the first two weeks of October were still counted as employed in October.

There were some strong positives as well in this report.  Retailers added 44,000 jobs, above the average gains of 31,000.  This year’s gains have been the strongest in fifteen years.

The gains are about half of the eye-popping gains of the past fifty years, but they indicate a confidence among retailers.  Retail jobs are often the first job of many younger workers, who have endured persistently high unemployment during this recession. Here’s a glance at yearly job gains in the retail sector for the past fifty years.

As the holiday shopping season gets underway, all eyes will turn to the retail sector as an indicator of the consumer’s mood.  The U. of Michigan Consumer Sentiment Survey, released Friday, showed a continuation of an erosion in consumer confidence.  After peaking during the early summer at 85, this index has declined to 72, about the same levels as late 2009 when the economy was particularly weak.  The Expectations component of this survey, which reflects confidence in employment and income, has declined to about 63.  Gas prices have been declining, inflation has been near zero, and stock and home prices have been rising but this survey shows a steady decline in confidence.  The government shutdown probably had some effect on the consumer mood but the budget battles are not over.  This is the 7th inning stretch and few are standing up to sing “America The Beautiful.”

Professional Services and Health Care have been consistent leaders in job growth for the past few years but gains in these sectors have declined.  The unemployment rate notched up to 7.3% from 7.2%.

In a catch up effort after the recent government shutdown, the Dept of Commerce released data on factory orders for both August and September.  While the manufacturing sector as a whole has been strong, the weakness in new orders in these two months indicates a tempering of industrial production in the near future.

When adjusted for inflation, the level of new orders is still below the levels of mid-2008.

If we zoom out ten years, we can see that we at about the same levels as late 2005.

ISM released their monthly non-manufacturing survey, showing sustained and rising strong growth at just over 55, up a point for the previous month.  I’ve updated the CWI that I’ve been tracking  since June of this year.  A three year chart shows that even the troughs are part of a sustained growth pattern.  Furthermore, the span of the troughs keeps getting shorter, indicating a structural growth in the economy.

Let’s look back six years and compare this composite index of economic activity with the market.

The monthly report of personal income and spending released Friday showed less than 1% inflation on a year over year basis.  For the second month, incomes increased at an annualized rate of 6%, yet consumer spending remains sluggish.  The chart below shows the year over year growth in spending for the past twenty years.

A longer term graph shows the current fragility in an economy whose primary component is consumer spending.

Both the manufacturing and non-manufacturing portions of the economy continue to expand.  Employment has risen consistently at a level just above population growth.  Inflation is tame but so is consumer spending.  Income is rising.  Budget battles loom.  Expectations for holiday retails sales increases are modest.  Will the Fed ease or not ease?  The medium to long term outlook is positive, but with a watchful eye on any further declines in the momentum of consumer spending growth. The short term outlook is a bit more chaotic.  We can expect further wiggles in the stock market as traders rend their garments, struggling  with Hamlet’s dilemma: To buy or not buy?  To sell or not sell?

Jobs Report – December

Last Friday, the Bureau of Labor Statistics (BLS) reported that 200,000 jobs were created in December, 412,000 jobs in this last quarter of 2011. A look at the full report and the data behind it raises suspicions.  Why are jobs being rounded off to the nearest 100,000 this past quarter?  We understand that there will be revisions to the data in the months ahead but this gives the impression that there has been a change in the accuracy of the data in the past quarter.

Getting out our data picks, let’s dig down and look at seasonally adjusted retail employment shown on the report.

83,000 retail jobs created in the past quarter.  At first glance that looks like a healthy increase.  So I dropped the above data into a spreadsheet and found that not only is it a healthy increase in retail jobs, it is the best in more than a decade!

Did stores go wild with hiring this holiday season in anticipation of a robust consumer response? This past Thursday, chain stores reported that sales for November and December combined rose 3.3% but this was below 2010’s 3.8% growth. Next Friday we will get the full retail sales report, but indications are that this was not a robust holiday season.

How reliable are the data and the seasonal adjustments that the BLS makes to the data in this area?  I suspect that the BLS is not properly accounting for the holiday surge of hiring for online buying, which increased 15% this year to $35 billion (Source).  BLS methodology is accustomed to dealing with the 4th quarter hiring surge at brick and mortar retail stores but have they changed their methodology to adjust for the relatively new proportion of online sales and the hiring surge needed to meet the holiday demand?

In the months ahead, we may be in for some substantial revisions or surprises in the jobs data.