February 16th, 2014
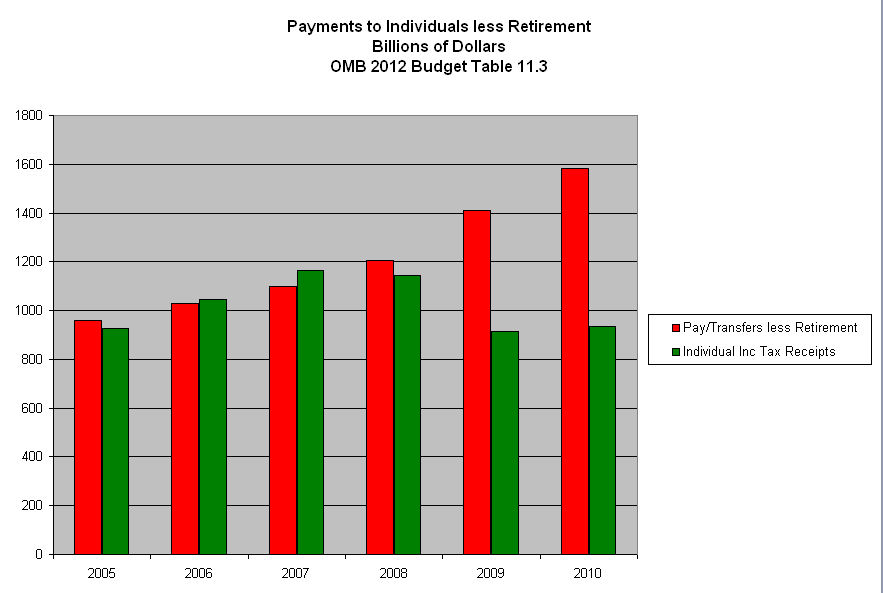
In this election year, as in 2012, the subject of transfer payments will rear its ugly head with greater frequency. In the mouths and minds of some politicians, “transfer payments” is synonymous with “welfare.” Don’t be confused – it is not. As this aspect of the economy grows, politicians in Washington and the states get an increasing say in who wins and who loses. Below is a graph of transfer payments as a percent of the economy. I have excluded Social Security and Unemployment because both of those programs have specific taxes that are supposed to fund the programs.

Transfer payments, as treated in the National Income and Product Accounts (see here for a succinct 2 page overview), are an accounting device that the Bureau of Economic Analysis (BEA) uses to separate transfers of money this year for which no goods or services were purchased this year. The BEA does this because they want to aggregate the income and production of the current year. Because that category includes unemployment compensation, housing and food subsidies, some people mistakenly believe that the category includes only welfare programs. Here’s a list of payments that the BEA includes:
Current transfer receipts from government, which are called government social benefits in the NIPAs, primarily consist of payments that are received by households from social insurance funds and government programs. These funds and programs include social security, hospital insurance, unemployment insurance, railroad retirement, workers’ compensation, food stamps, medical care, family assistance, and education assistance. Current transfer receipts from business consist of liability payments for personal injury that are received by households, net insurance settlements that are received by households, and charitable contributions that are received by NPISHs.
That settlement you received from your neighbor’s insurance company when his tree fell on your house is a transfer payment. Didn’t know you were on welfare, did you? Some politicians then cite data produced by the BEA to make an argument the government needs to curtail welfare programs. Receiving a Social Security check after paying Social Security taxes for forty plus years? You’re on welfare. A payment to a farmer to not grow a bushel of wheat – an agricultural subsidy – is not a transfer payment. A payment to a worker to not produce an hour of labor – unemployment insurance – is a transfer payment. Got that? While there are valid accounting reasons to treat a farmer’s subsidy check and a worker’s unemployment check differently, some politicians prey on the ignorance of that accounting difference to push an ideological agenda.
That agenda is based on a valid question: should a government be in the business of providing selective welfare; that is, to only a small subset of the population? Some say yes, some say no. If the answer is no, does that include relief for the victims of Hurricane Katrina, for example? Even those who do say no would agree that emergencies of that nature warrant an exception to a policy of no directed subsidies or welfare payments. It was in the middle of a national emergency, the Great Depression, that Social Security and unemployment compensation were enacted. Government subsidies for banks began at this time as well. Agricultural subsidies began in response to an earlier emergency – a sharp depression a few years after the end of World War 1. Health care subsidies were enacted during the emergency of World War 2. The pattern repeats; a subsidy starts as a response to an immediate and ongoing emergency but soon becomes a permanent fixture of government policy.
Tea Party purists think that the Constitutional role of the federal government is to tax and distribute taxes equally among the citizens. Before the 16th Amendment was passed a hundred years ago, the taxing authority of the Federal Government was narrowly restricted. However, the Federal Government has always been selective in distributing the resources at its disposal. Land, forests, mining and water rights were either given or sold for pennies on the dollar to a select few businesses or individuals. (American Canopy is an entertaining and informative read of the distribution and use of resources in the U.S.) By 1913, the Federal Government had dispensed with so much land, trees and water that it had little to parlay with – except money, which it didn’t have enough of. Solution: the income tax.
In principle, I agree with the Tea Party, that the government at the Federal and state level should not play God. How likely is it that the voters of this country will overturn two centuries of precedent and end transfers? When I was in eighth grade, I imagined that adults would have more rational and informed discussions. Sadly, our political conversation is stuck at an eighth grade level on too many issues.
****************************
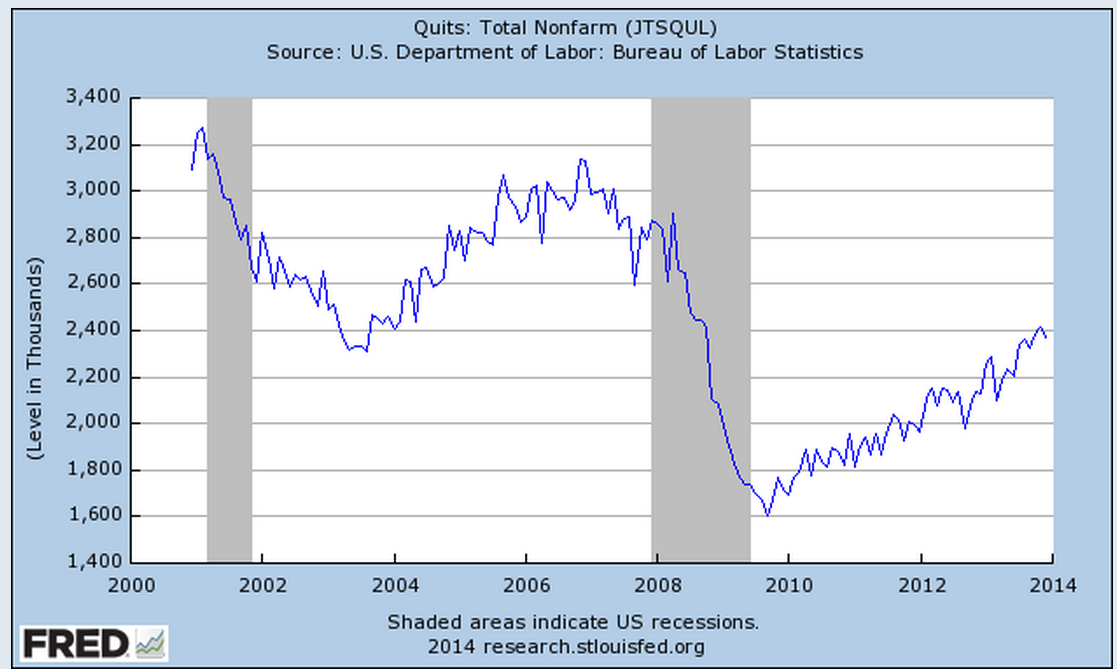
While most of us pay attention to the unemployment rate, there is another statistic – the separation rate – that measures how many people are unemployed at any one time. The unemployment can be voluntary or involuntary, and last for a week, a month or a year. Not surprisingly, younger workers change jobs more frequently and thus have a higher separation rate than older workers. In the past decade, almost 4% of younger male workers 16 – 24 become unemployed in any one month. Put another way, in a two year period, all workers in this age group will change jobs. For prime age workers 25 – 54, the percentage was 1.5%. In a 2012 publication, Shigeru Fujita, Senior Economist at the Philadelphia Federal Reserve Bank, examined historical demographic trends in the separation rate.
On page five of this paper, Mr. Fujita presents what is called a “labor-matching” model that attempts to explain changes in unemployment and wages, primarily from the employer’s point of view. Central elements of this model, familiar to many business owners, include uncertainty of future demand and the costs of finding and training a new worker. Mr. Fujita examines an aspect that is not included in this model – the degree of uncertainty that the worker, not the employer, faces. In the JOLTS report, the BLS attempts to measure the number of employees who voluntarily leave their jobs. These Quits indicate the confidence among workers in finding another job. The JOLTS report released this week shows an increasing level of confidence but one which has only recently surpassed the lows of the recession in the early 2000s.
**************************
Labor Participation
In a more recent paper, Mr. Fujita examines the causes of the decline in the labor participation rate, or the number of people working or looking for work as a percentage of the people who are old enough to work. As people get older, fewer of them work; the aging of the labor force has long been thought to be the main cause of the decline. That’s the easy part. The question is how much does demographics contribute to the decline? What Mr. Fujita has done is the hard work – mining the micro data in the Census Bureau’s Current Population Survey. He found that 65% of the decline of the past twelve years was due to retirement and disability. More importantly, he discovered that in the past two years, all of the decline is due to retirement. The first members of the Boomer generation turned 65 in 2011 so this might come as no surprise. The surprise is the degree of the effect; this largest generational segment of the population dominates the labor force characteristics. During the past two years, discouraged workers and disability claims contributed little or nothing to the decline in the participation rate. Another significant finding is that relatively few people who retire return to the work force.
In this election year, we will be bombarded with political BS: Obamacare or Obama’s policies are to blame for the weak labor market; the anti-worker attitude of Republicans in Congress are responsible. Politicians play a shell game with facts, using the same techniques that cons employ to pluck a few dollars from the pockets of tourists in New York City’s Times Square. Few politicians will state the facts because there is no credit to be taken, no opposing party to blame. Workers are simply getting older.
In 2011, MIT economist David Autor published a study on the growth of disabiliity claims during the past two decades and the accelerating growth of these claims during this Great Recession. Mr. Fujita’s analysis reveals an ironic twist – at the same time that Mr. Autor published this study, the growth in disability claims flattened. The ghost of Rod Serling, the creator and host of the Twilight Zone TV series, may be ready to come on camera and deliver his ironic prologue.
*******************************
Lower automobile sales accounted for January’s .4% decline in retail sales. Given the continuing severity of the weather in the eastern half of the U.S., it is remarkable that retail sales excluding autos did not decline. In the fifth report to come in below even the lowest of estimates, industrial production posted negative growth in January. By the time the Federal Reserve meets in mid-March, the clarity of the economy’s strength will be less obscured by the severe winter weather.
*******************************
A reader sent me a link to short article on the national debt. For those of you who need a refresher, the author includes a number of links to common topics and maintains a fairly neutral stance. I still hear Congresspeople misusing the words “debt,” the accumulation of the deficits of past years, and “deficit,” the current year’s shortfall or the difference between revenues collected and money spent. Could we have a competency test for all people who wish to serve in Congress?
*******************************
The House and Senate both passed legislation to raise the debt ceiling this week. The stock market continued to climb from the valley it fell into two weeks ago and has regained all of the ground it lost since the third week of January.