Skipping into the Oval Office Friday morning, President Obama’s campaign manager called out with glee, “Mr. President, 163,000 jobs!”
“Buy, buy, buy!” traders shouted on the floor of the N.Y. Stock Exchange.
“Let’s take a six week vacation!” John Boehner, the House Speaker, cried out.
Concentrating on the .1% uptick in the unemployment rate, Presidential contender Mitt Romney said, “the president’s policies are to blame for not having gotten the economy back on track.”
What to make of these conflicting numbers? Economists and market watchers were anticipating a gain of 100,000 jobs. Economists guesstimate that a growth of 150,000 jobs per month is needed to absorb the increase in the working population. 163,000 is above 150,000; so how did the unemployment rate tick up from 8.2% to 8.3%?
The headline job gain number comes from the Current Employment Statistics program, a monthly survey of 141,000 businesses and government agencies that represent almost a half million worksites. This “Establishment Survey”, as it is sometimes called, counts jobs, not people. The addition of two part time jobs will count as two jobs even if only one person is working those two part time jobs. Not all businesses return their survey forms to meet the monthly deadline so the Bureau of Labor Statistics (BLS) estimates the results and this first estimate becomes the headline number that gets so much attention from the market and political pundits. The following month the BLS issues a 2nd estimate, followed by a 3rd estimate a month later. The chart below shows the differences between the 3rd estimate and the first estimate (BLS source ). As you can see, the revisions can be substantial. (Click on graphs to open in a separate tab)

On September 2nd, 2011, the BLS released their August report showing a gain of 0 (zero!) jobs. The stock market sank 2.6%. The 3rd estimate, released in November, showed job gains of 104,000, not 0! The BLS will further revise the job gains for a particular month as state unemployment reports and other data becomes available to the BLS.
These job gains are seasonally adjusted. One of the seasonal adjustments for July is the customary shut down of auto factories in July. This year, in response to demand, auto manufacturers did not shut down their factories but the BLS makes the adjustment regardless. Several analysts reason that this seasonal adjustment accounted for about 25,000 of the 163,000 jobs gained. Despite all these shortcomings, the CES is regarded as the more accurate count of jobs.
The unemployment number comes from a separate monthly survey of 60,000 households conducted by the BLS. While the Establishment Survey does survey small businesses, it misses a good chunk of the really small businesses, the mom and pop operations, that form an important backbone of the economy. The Household Survey is often thought to overestimate the total number of jobs in the economy but it gives a detailed picture of the workforce and the unemployed. From this survey we learn of the age, racial, and education characteristics of the employed. Each month I look at two aspects of this survey: the growth or decline in what I call the core work force, those aged 25 – 54 years old, and the larger workforce aged 25 and older. The actual number doesn’t matter as much as the increase or decrease in the adult work force – the trend in job growth.
The graph below charts the year over year percent gain or loss in the core work force. It is still positive, leveling off after climbing up from negative territory a year ago.

For a bit more perspective, let’s zoom out and look at the past 20 years.

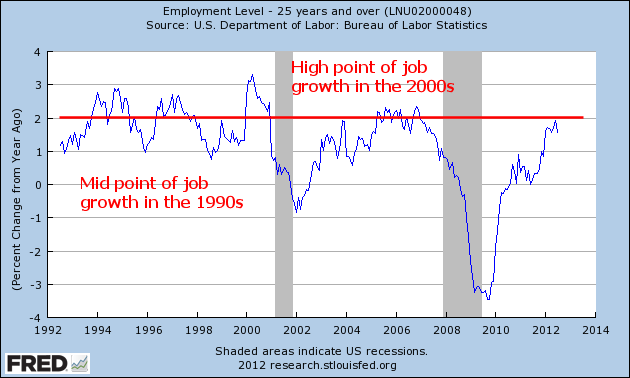
A graph of the year over year percentage gains in the larger work force aged 25+ shows that we have just about reached the high point of job growth during the 2000s. We would need to at least maintain this level of growth to make up for the job losses during this past recession. We would like to see job growth more like those we experienced during the high tech boom of the 1990s but the investment in new technology during the 1990s was particularly strong. A catalyst for such a fundamental growth in the economy is not on the horizon.
The market experienced what I think is a relief rally on Friday. Persistent troubles in Europe, a slowdown in the growth of China and other Asian emerging economies, lackluster employment reports for May and June, and a tepid 1.5% GDP growth in the second quarter had spread fears of a coming double dip recession. Had the BLS issued a job gains estimate of 50,000, for example, the market would have probably declined 2+%. Back in April of this year, I wrote about an employment indicator that has been a reliable predictor of recessions. When the percent change in the unemployment level crosses above zero percent, it’s time to get into the storm cellar and batten down the hatches!

-1% is an indicator of a rebounding labor force midway in a recovery from a recession. I’ve marked up a thirty year chart of the year on year (y-o-y) percent increase/decrease in the unemployment rate to show the trend. Had we not shipped so many jobs to China after they joined the World Trade Organization in 2001, we might have had the spurt of job growth recovery that we experienced in the early eighties.

As the chart below shows, that kind of strong post-recession job growth is not the norm.

Larry Kudlow, a CNBC host, and other “supply sider” pundits are presently making the case that Presidential contender Mitt Romney will usher in a new era of the same kind of unusual job growth we experienced in the 1980s. Anything is possible, of course, and hosts of financial shows make their money by making headline predictions. Those of us without a TV show must pay more diligent attention to the law of averages, to the probable, not the possible. That law of averages makes it unlikely that either a President Obama or a President Romney will achieve historically unusual declines in unemployment. In Britain the slow news months of summer are called the “silly season”. In these few months before the election, Americans will experience a truly silly season, not for the slowness of news but for the sheer deluge of outlandish and annoying political ads making accusations and far-fetched claims. After that silly season will come another silly season, the Christmas shopping tournament!