October 16, 2022
by Stephen Stofka
On Thursday, September’s CPI came out, showing an annual price increase of 8.2%. A quarter of that increase was housing costs – rent and owner equivalent rent. Price increases have decelerated this quarter. Remember that inflation is the change in prices. Acceleration (+) or deceleration (-) is the change of that change. Inflation is like the speed in a car. Acceleration is the change in speed. The graph below shows the acceleration for the past five years.

Notice the regular up and down in small increments before the pandemic. When we drive down the highway without cruise control, we experience the same minor variations in speed. After the pandemic, price acceleration became more erratic. Why?
Usually, we do not synchronize our spending and saving. During the pandemic in 2020, we began to coordinate our buying habits. The first round of stimulus checks went out in April 2020, shortly after the economy was locked down. We bought workout equipment, computers and peripherals, appliances for the home. The second round of stimulus went out in December 2020 and January 2021. President Biden was sworn into office in January 2021 and immediately began discussions of a third stimulus payment, part of the American Rescue Plan.
Critics say the third stimulus payment was too much, that it was the impetus to the recent inflationary surge. That is an ex-post or hindsight criticism. On December 18, 2020, Moderna was granted emergency approval by the FDA (2020) for its MRNA vaccine, a relatively new vaccine manufacturing technology. The Pfizer vaccine was the first to get such approval but its vaccine required a temperature of -94F. Moderna’s vaccine required a temperature of only -4F, about the same level as the freezer temperature in a home refrigerator. The vaccine was deemed safe but the drug makers did not know how long the vaccines would last. Secondly, they needed a booster shot as well. Moderna promised 100 million doses by March of 2021. What if the vaccines lasted only a few months and development of a better formulation was delayed another year? The third stimulus would have been entirely appropriate. Policymakers must make ex-ante decisions – before all the evidence is known or evaluated.
In 2021, some economists predicted higher inflation in 2022. They turned out to be right. Ten years ago, those same economists predicted higher inflation after the 2009 ARRA stimulus. They were wrong. Economists, like traders, are right sometimes and wrong sometimes. Like traders, the winning prediction rate is closer to 50-50 or pure chance. Others are likening this to the inflation of the 1970s. However, there is a big difference. In the 1970s, price acceleration kept rising like a car which is speeding up. Currently it is falling, like a car slowing down. Here’s a look price acceleration in the 1970s.

As I mentioned last week the Social Security Administration announces the yearly COLA for Social Security recipients after the September CPI figure is reported. The 2023 COLA adjustment will be 8.7%, adding $146 to the average $1673 monthly payment for retirees. As I discussed last week, worker’s wages have not kept up with inflation. They are more on a fixed income than retirees at this point.
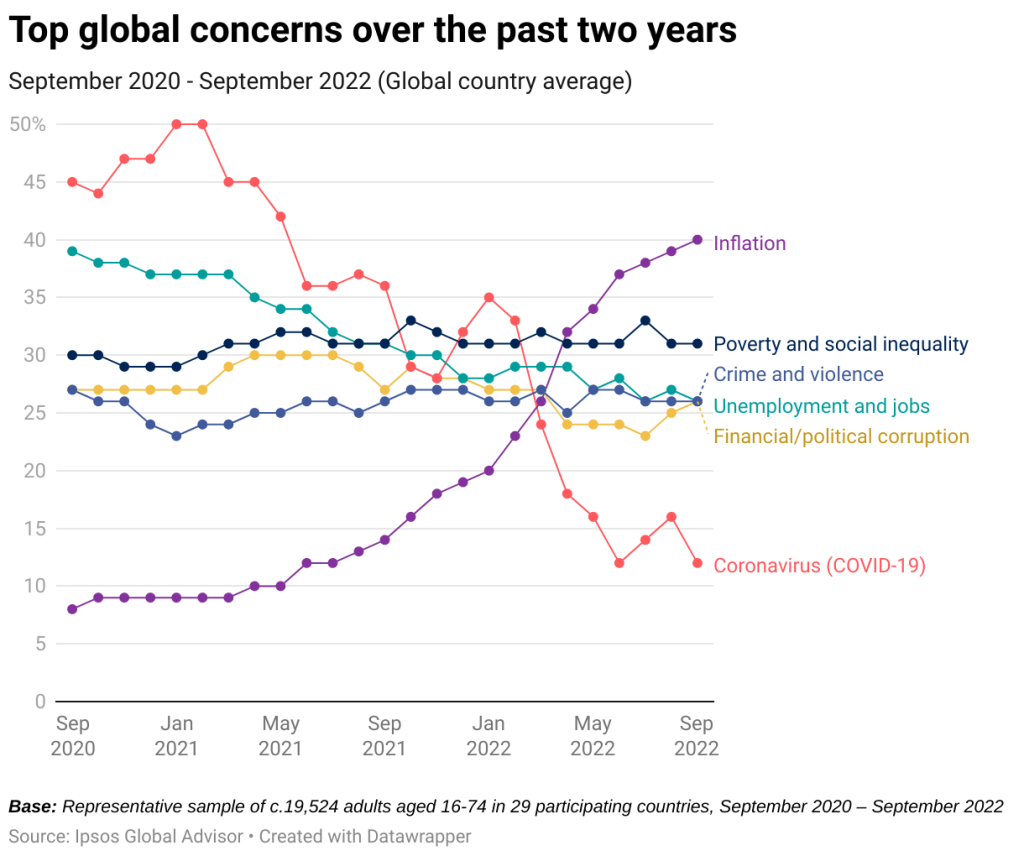
The inflation is global – a first in economic history. Global market research company Ipsos (2022) survey people in 29 countries. Inflation has become the top concern for 40% of respondents. Here’s the chart I downloaded from their page. Look at the surge in inflation as a concern over the past year. Unemployment and Covid-19 were the top concerns in 2020. Stimulus assistance and monetary policy in the Eurozone countries helped relieve job concerns. Covid-19 became less worrying as more people got vaccinated and hospital admissions decreased. After Russia’s invasion of Ukraine, rising oil prices lifted inflation worries in many countries.
As the world becomes more integrated financially and economically, will we reach a self-destructive resonance? Our economic systems could become less stable as they synchronize. I hope not.
////////////////
Photo by Providence Doucet on Unsplash
FDA. (2020, December 18). FDA takes additional action in fight against COVID-19 by issuing emergency use authorization for second COVID-19 vaccine. U.S. Food and Drug Administration. Retrieved October 15, 2022, from https://www.fda.gov/news-events/press-announcements/fda-takes-additional-action-fight-against-covid-19-issuing-emergency-use-authorization-second-covid
Ipsos. (2022, September 22). What worries the world – September 2022 . Ipsos. Retrieved October 14, 2022, from https://www.ipsos.com/en-uk/what-worries-world-september-2022