Gobs of Jobs

April 12, 2015

Last week I wrote about the recent flow of investment dollars to markets outside the U.S.  This week emerging markets (EEM, VWO, for example) shot up another 4%.  For the first time since last October, the 30 day average in these two index ETFs just broke above the 100 day average.

******************************

Job Openings (JOLTS)

February’s JOLTS report from the BLS, released this past Tuesday, showed that the number of job openings is nearing the heights of the dot com bubble in 2000.

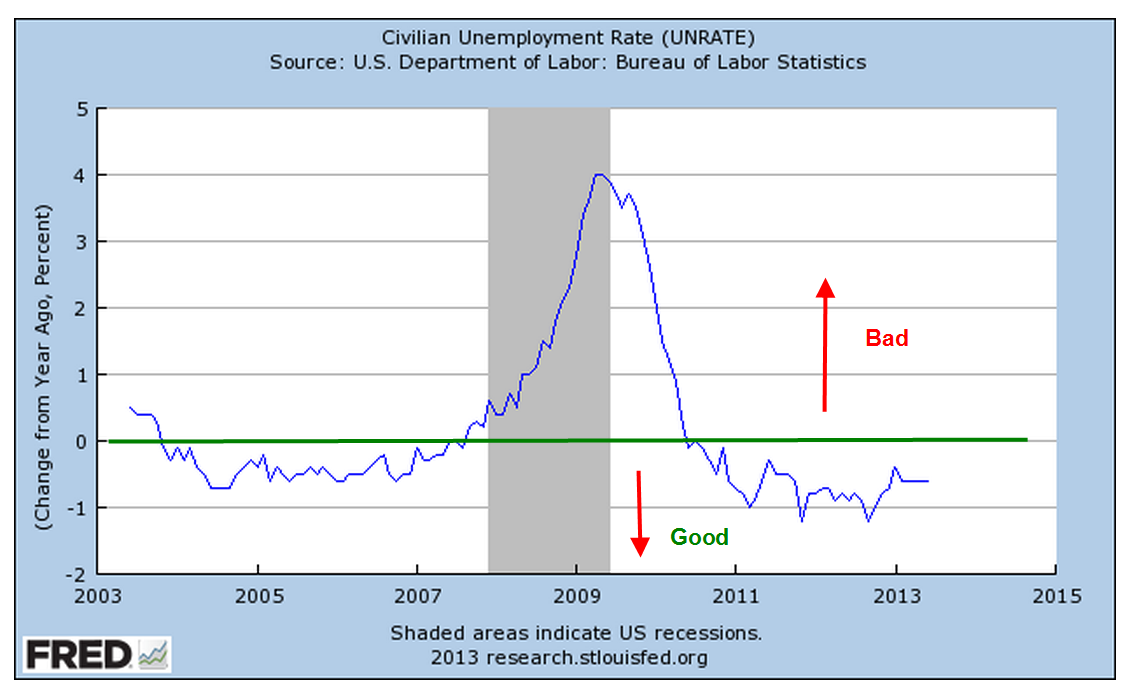
Last week we saw that new claims for unemployment as a percent of people working were at historically low levels.  I’ll show the graph again so I can lay the groundwork for an explanation of why bad things can happen when things get too good.

Here are job openings as a percent of those working. I’ll call it JOE. In 2007, JOE approached 3.5%.  In 2000 and these past few months, it exceeded that.  As openings fall below a previous low point, recessions follow as the economy “corrects course.”  I have noted these transition points on the chart below.  September’s low of 3.3% marks the current low barrier.  Any decline below that level would be cause for worry.

Let’s look at it from another angle.  Below are job openings as a percent of the unemployed who are actively looking for a job.  This metric would give us a rough idea of the skills and pay mismatch.  This looks a bit more tempered. We are not at the high level of 2007 and not even close to the nosebleed level of 2000.

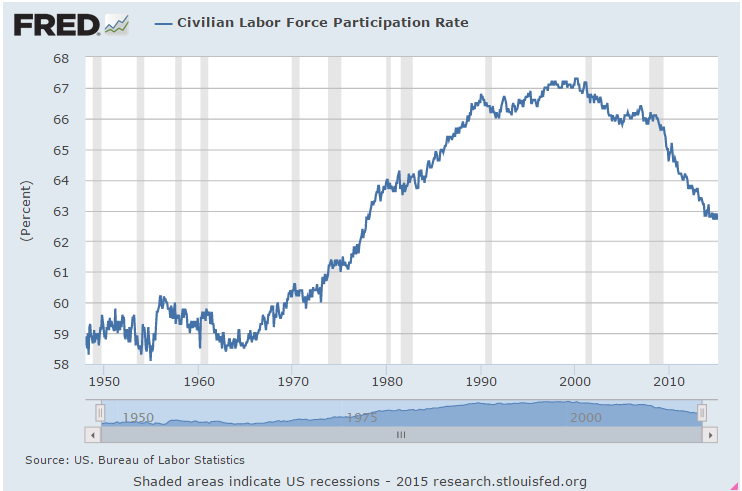
As openings grow, one would expect that some who have been out of the labor force would come back in but that doesn’t seem to be the case this time.  The participation rate remains low.  The reasons for this trend are partly demographic – aging boomers, small GenX population, end of the female labor “wave” into the labor force during the past few decades – but we should expect to see some uptick in the participation rate, some positive upward response to economic growth.

As jobs become harder to fill or applicants want more money to fill those jobs, employers may decide to cut back expansion plans rather than hire people who are are either too costly to train or who might not meet the company’s work standards. Employees who previously tolerated certain conditions or a level of pay at their job now act on their dissatisfaction.  They may leave the job or ask for more money or a change in conditions.  Little by little investment spending ebbs, then declines a bit more, reaches a threshold which triggers layoffs, and another business cycle falls from its peak.

**********************

Bank of Japan

Recently the NY Post reported  that the Bank of Japan (BOJ) was buying equities and the author implied that BOJ was pumping up the stock market. The central bank in the U.S. buys only government bonds, not equities.   Warnings of doomsday are popular in financial reporting because people pay attention. The truth just doesn’t get much attention because it is not exciting. I want to help the reader understand how misleading these kind of cross country comparisons can be.

Here is a comparison of the holdings of the U.S., Japanese and European central banks.  Look closely at the holdings of insurance and pension funds in the U.S. and Japan.  Notice that U.S. pension funds (which are government funds or private funds guaranteed and regulated by the U.S. government) have 9% equity holdings while Japan’s insurance and pension funds have only 2%.   Combining the holdings of the central bank and insurance and pension funds, we find that Japan has 4% in stock assets while the U.S. has 9% of its assets in stocks.  Contrary to this reporter’s implications, it is the U.S. government that is pumping up the stock market far more than the Bank of Japan.

The author quotes a Wall St. Journal article from March 11, 2015: “The Bank of Japan’s aggressive purchasing of stock funds” but only seven months ago, on August 12, 2014, that same newspaper reported: “As Tokyo shares fall back from their recent highs, the Bank of Japan has been significantly stepping up its purchases of domestic exchange traded funds.” [my emphasis]
Note the difference in wording.  The earlier article notes that BOJ is buying domestic equities, particularly ETFs, which are baskets of stocks.  The later article leaves out these important distinctions, leading a reader to believe that BOJ policy might be pumping up the U.S. equity market or any market, for that matter. The data does not support that contention.

What U.S. investors should be concerned about (I mentioned this in last week’s blog) is that federally guaranteed pension plans and government pension plans are finding it difficult in this low interest rate environment to meet their projected benchmark returns of 7% to 8%.  A more realistic goal is 5% to 6% for a large fund with a balanced risk profile.  Pension plans are having to take on more risk at a time when boomers are retiring and wanting the money promised in those pension plans.  These investment pools can not afford to wait five years for asset values to recover from a severe downturn, making them more likely to adjust their equity or bond positions as quickly as they can in the case of a crisis of confidence in these markets.  Be aware of the underlying environment we are living in.

Job Trends

July 7th, 2013
A better than expected June labor report released this week prompted some speculation that the Federal Reserve may begin tapering its quantitative easing program as early as this fall.  The employer survey reported a net gain of 195,000 jobs and the gains of earlier months were revised up 70,000.  Government workers continue to decline. We will see that the modest strength in the labor market is part of a mixed employment picture.    The unemployment rate remained steady at 7.6%; the year over year percent change in this headline index continues to chug along in the “good” territory.

70% of workers – about 95 million – are employed in private service jobs, most of which showed strong gains in the past quarter.

14% of workers are government employees; federal, local and state governments continue to shed workers.

As the number of workers declines, the number of people served by each worker continues to rise, approaching levels last seen in the early 1980s and mid-1970s.  The government work force would need to decline a further two million, or 10%, to reach the level of 15 people per government worker.  That level is still far below the comparatively lean government worker levels of the 1960s and earlier.

The major part of the attrition in government jobs seems to be over.  Local governments are adding employees while the federal government continues to shed employees.

Job gains continue to come in lower paying retail and food service jobs.  In 2013, employment finally surpassed early 2008 levels.  The average wage of $14 to $17 per hour in these industries is far below the $24 average of all workers and the $20 average of private production and non-supervisory workers.

Much higher paying jobs in Professional and Business Service industries continued to show strong gains and have also climbed above 2008 levels.  The average wage in this category is 15% higher than that of all workers.

Over seven million people not counted in the labor force or in the headline unemployment rate say they want a job now.  Four years after the official end of the recession, the number of “kind of unemployed” remains high.

The number of involuntary part-time workers increased by 322,000, or about 4%, to 8.2 million, over 5% of the total labor force.  These are workers who are working part time but want full time jobs.  A healthier labor market would have about 3% of these unwilling part timers.

As the number of housing starts increases, the unemployment rate among construction workers continues to decline and dipped below 10% this month.  Lower lows in this unseasonally adjusted index of unemployment is a good sign.

But the year-over-year percent change in construction employment is still not robust enough to reverse the heavy job losses since the onset of the recession.

The core work force aged 25 – 54 dropped by 100,000 and continues its slight upward struggle above the recession depths.

A decline in this prime working age population is partly responsible, but the 1.6 million decline in population is but a third of the 5 million plus decline in employment for this age group.

A 2004 paper by a BLS economist, Jessica Sincavage, provides an interesting historical perspective on multi-decade generational trends in the unemployment rate.  She noted “The characteristics of today’s younger workers differ from those of their baby-boomer counterparts in several ways that may affect the former group’s impact on the labor force and the unemployment rate now and in the future. Among the relevant characteristics affecting both groups are school enrollment patterns, race and Hispanic origin, and women’s labor force participation.”

In 1979, over 42% of the last of the boomer generation aged 20 – 24 were enrolled in school.  In 2002, under 37% of the “echo boomer” generation aged 20 -24 were enrolled.  Easy job availability, the growth of the internet and the sustained rise of the stock market during the 1990s persuaded many younger workers that the opportunity cost of going to college was simply not worth it.

The onset of this recession has divided the prime work force into two groups.  For those with a degree unemployment has remained low.  For those without the higher education, unemployment is almost double.  In a curious correlation, the unemployment rate for three groups is about the same – the general labor force,  workers above 25 years with a high school only education, and Hispanics.

The third factor noted by Ms. Sincavage is the participation rate of women in the labor force. In her 2004 paper she observed “In 1979, the participation rate of women 16 to 34 years was about 63 percent; by 1999, it was 70 percent.” By the mid 2000s, this cultural and demographic bulge began to decline.  The rate for all women has now declined below the levels of the early 1990s.

Although there was a lot to like about this month’s labor report, recent job gains are swimming against an undertow of shifting demographics and labor demands from employers.  A casual reading of the headline numbers might lead one to discount these long term negative trends.

Job Trends

This past Wednesday the payroll firm ADP released their monthly report of private employment with a rather tepid 119,000, prompting an equally tepid sell off in the market, which lost about .7% by the end of Wednesday.  Although the price move was under 1%, the volume of trading was high.  Was this the end of the 6+ month run up in stock prices?  Was the economy slowing down? 

Came Thursday and a very cheery weekly report of new claims for unemployment and moods brightened.  The market regained the ground lost Wednesday and then some, but on rather low volume.  Standing on the sidewalks of Wall Street, traders repeatedly opened up their umbrellas, then closed their umbrellas, put on their sunglasses, then took off their sunglasses. 

[And now a pause from our sponsor.  A trader tells his doctor he’s anxious and asks for a prescription.  The doctor gives him some advice: “stop looking at the market so much.”]

Back to our story. Friday morning dawned, the heavens opened and the sun shone.  The Bureau of Labor Statistics issued its monthly weather – er, labor – report and traders threw down their umbrellas and put on their shades.  Huzzahs rang throughout the canyons of lower Manhattan.  Some slacker dudes cooly tossed their stocking caps in the air, while men dressed in crisp suits wished that they too had hats.

The labor report is released an hour before the market opens at 9:30 AM.  The market opened up 1%, drifted higher but ended the day at about the same price as it opened.  So, huh? We’ll get to the huh part later.

The reported job gains of 165,000 for April were just slightly above the 150,000 jobs consensus estimate and the replacement rate needed to keep up with population growth.  Spurring the initial enthusiasm was relief that job gains were not as weak as some had feared (100,000 or so) and the revisions to previous months job gains, adding 114,000 to February and March’s job gains. But February’s revision from strong to very strong job growth provokes some head scratching.

What good things happened in February to inspire such strong job growth?  Hmmmm….here’s a table of the past 12 months data from the establishment survey. 

There was a lot to like in this month’s report.  The unemployment rate dropped a tenth of a percent to 7.5%.  We just passed employment levels of February 2006 – yep, it’s been a slow recovery.

To get the big picture, let’s look at the last forty years.

From this perspective, we can see just how deep the job losses have been since 2008.  From this rather sobering point of view, let’s look at some of the positives from this month’s report.

Professional and Business services added a whopping 73,000 jobs this month, far above the 49,000 average of the past 12 months.  Restaurant and bar jobs were up 50% above their 12 month average, showing gains of 38,000. Temp help posted strong gains of 31,000, its highest of the past year.

Construction jobs showed little change, a surprise at this time of year.  Construction has been averaging gains of 27,000 a month for the past six months. This past week, I spoke to a woman at a Denver branch of a national temp agency.  This branch focuses on manual labor, mostly for the construction industry.  She confirmed that business has been brisk but most of the calls are for road repair and rebuilding and some commercial construction.  When I asked her about calls for helpers and job site clean up for residential construction, she said it had been sporadic.

Job gains in health care were somewhat below their 12 month average of 24,000 but any slack in health care was made up by strong growth in retail.  Government jobs continue to contract slightly each month.

Underlying the positive aspects of the job market are some anemic indicators.  The average of weekly hours dropped .2 hour to 34.4; the average has lost .1 hr in the past year.  The ranks of the long term unemployed dropped by 258,000 workers but the number of people working part time who would like a full time job jumped 278,000.  The ranks of the “involuntary” part timers – those who would like a full time job but can’t find one – is about 5 million.  Here’s a surprise. Today’s levels of involuntary part timers as a percent of total employment is only the third highest in the past fifty years; the late 1950s and the early 1980s were worse.  But this only means that the ranks of part timers have fallen mercifully from nose bleed levels.

The diffusion index is showing some weakness; this is the share of employers who are reporting job gains vs. job losses, with a value of 50 being neutral.  Manufacturing employers are already reporting more job losses than gains.  Overall, employers are slowly drifting toward neutral in their hiring for the past several months.

The core work force aged 25 – 54 is still limping along.

Even more disturbing is the participation rate of this core work force.

Shortly after the market opened on Friday came the report on factory orders and it muted some of the enthusiasm generated by the labor report.  New orders for durable goods, a barometer of business confidence, fell 5.8%, confirming the slowdown in manufacturing.  Employment in this sector has been flat the past two months.

While the monthly labor report makes headlines, it is not a leading indicator. Professional investors watch the squiggles of daily and weekly economic and news reports, trying to anticipate developing trends.  Many of us have neither the time or inclination.  For the long term “retail” investor, continuing job gains are positive, particularly if they are at or above the replacement level of 150,000. The long term investor is more concerned about significant losses in their retirement portfolio.

What if an investor lightened up on their stock holdings shortly after the BLS reported the first job losses?   I looked back at historical employment releases ; I wanted to use the original releases, not the revised figures of later months, to capture the sentiment at the time.  We must make decisions in the present.  We don’t have the luxury of going into the future, looking at data revisions, then coming back to the present and making our investing decisions.  That would be a good time machine, wouldn’t it?  Here’s an example of how employment data can be reported initially and later revised.  The graph shows the later revisions.

In early August 2000, the BLS reported job losses of 108,000 in July.  But this was due to the layoff of 290,000 temporary Census workers.  Do census workers really count in our strategy?  Let’s say not.  We wait till next month’s report, which shows a loss of 105,000. Should we use our strategy?  Again, those darn census workers.  Without them, there would have been a small gain in jobs.  So we don’t sell in September.  Then, in the beginning of October comes the news of strong job gains in September, followed by more job gains in October, November and December.  Good thing we didn’t sell at that first downturn, we tell ourselves.  Meanwhile the stock market has been slipping and sliding since that first negative job report.  Eventually, it will fall about 40%.

Wow, we should have taken that first signal and avoided all those losses!  But if our strategy is to then buy back in when there are positive job gains reported, then we could be in and out of the market like a yo-yo in years when the economy is struggling to find direction or strength. We were looking for a more even tempered strategy.

To emphasize how the revisions in employment can mean the difference between job gains and job losses,  take a look at the chart below.  These are the revised figures.  I have noted months where the initial monthly labor report showed positive job gains but were later revised to job losses.  Some of these revisions can happen months later.

From the first reported job losses in mid 2000, more than three years passed before job gains would exceed the “replacement” level of 150,000.  That is the number of jobs needed for the growth in the labor force. While many, myself included, have blamed the knucklehead politicans who enacted the Bush tax cuts in 2003, it is understandable that they were beginning to wonder if the labor market would ever turn around.  Three years of job losses is a long time.

Let’s move on to the last decline.  The market had already begun its decline before the first job losses were announced in early February 2008.

In this past recession, the job losses were severe but the first job increases were announced about two years after the first decrease, in early April 2010.  When reviewing the historical BLS releases, this really surprised me that the 2000 – 2003 labor downturn lasted longer than this last one, though it was much less severe.  By the time the first job increases had been announced in 2010, the market had already been on an upswing for a year. 

In short, the headline monthly job gains don’t appear to offer a long term casual investor any particular insight or advantage.  In a work force of 143 million, a hundred thousand jobs can be a slip of the pencil.  But reported job gains of 150,000 or more do offer an investing hint – quit worrying about your retirement portfolio for at least another month.  Go fishin’, play with the kids, hang out with friends.

A labor indicator that seems to be more reliable is the year over year percent change in the unemployment rate, which I have discussed in earlier blogs.

Although the unemployment rate – or percentage – is derived from the count of total employment, the revisions are much smaller.  Secondly, we are using a percentage gain in that percentage, further reducing swings.

The stock market continues to post new highs in anticipation of good corporate profits in the latter part of the year.  What is a bit troublesome is the number of revenue shortfalls reported by companies in the first quarter.  Reducing expenses and boosting productivity can only get a company so far.  Profit growth becomes harder and harder to come by without revenue growth.

The Core Work Force

The Bureau of Labor Statistics (BLS) released their monthly Employment Summary this past Friday and the market cheered, the Dow jumping up 100 or so at the open.  The Sunday talk shows have been abuzz about the report, which showed a January gain of 243,000 jobs.  After 5 months of increasing job gains, how improved are Obama’s chances of re-election?  Does the improving job picture cause the Republican Presidential contenders to change course a bit?  Wanting not to appear as though they are rooting against the American economy, do the contenders aim at specific policies of Obama in the coming months?  With the S&P500 index at 1344, some market pundits are whispering the 1500 mark that the S&P could take a run at this year.  Holy moly, macanoli, what a buzz about one labor report!

The labor report is only part of the picture puzzle that shows an improving economy.  The ISM manufacturing report was slightly below expectations but still growing.  Two key components of the index, new orders and backlogs, showed a robust increase, hinting at continuing improvement in the coming months.  The recent durable goods report shows that businesses are building inventories, a sign that expectations are improving.   Retail sales tapered off in December, but Personal Income was slightly above expectations, growing .5% over November.  Caterpillar, the large equipment maker, is looking forward to revenue and profit increases in 2012, reducing earlier concerns of a global recession.  A recent report indicates that the ongoing contraction in China’s manufacturing has slowed and is close to the neutral mark between contraction and growth. 

So, what’s not to like?

Looking past the monthly headline numbers of job growth, let’s look at this country’s core work force, men and women aged 25-54.  The BLS just made several census adjustments which resulted in upward revisions to seasonally adjusted job growth from April to December.  Instead of looking at seasonally adjusted numbers, I’ll take a look at the raw numbers from the BLS employment report for January and compare them to BLS January data for the past ten years.

A unseasonably warm winter throughout much of the U.S. gave a boost to construction jobs in the office building and multi-family residential construction.  Although the construction industry is still far below 2007 levels, that boost shows up in a comparison of employed men aged 25 – 54 from last January to this January. (Click to enlarge in separate tab)

The ongoing attrition in government jobs, which disproportionately employs women, has slowed but is still evident in comparisons with past Januaries.

This rather tepid growth, or lack of it, in our core work force is troubling.  This age demographic forms the backbone of a healthy economy, raising children, buying furniture and homes, saving for retirement and their kid’s college. Any job growth is good, but when I see a better improvement in the employment numbers for this group, I will know that we are building a resilient economy, one that can withstand some shocks.  We know of some possible shocks – the probable default of Greece, the ongoing recession in Europe and the possibility of some armed conflict with Iran, to name but three.  The shocks we don’t forsee are what can push our economy off balance.  Last year was a reminder of the impact of unforeseen shocks.  The tsunami  in Japan and the flooding in Thailand not only devastated those countries and their people but impacted supply chains in Asia and consequently sent after shocks throughout the world.

Recently fashionable has been talk of a decoupling of the U.S. and emerging countries’ economies from the sovereign debt and financial troubles in Europe.  If recent history has taught us nothing, it is that much of the world is joined together by interdependent webs of financial conglomerates and the monetary policies of nation states, by the tension between global consumer demand and multi-national supply chains to meet that demand.

BLS Estimates

Every month the Bureau of Labor Statistics (BLS) releases their initial unemployment estimates and these figures headline many newspapers and news broadcasts. The unemployment percentage moves markets and provides endless opportunity for comment and analysis.

TrimTabs, an investment research company, argues in a concise four page report that the employment numbers from the BLS are inaccurate. There have been many critics of the BLS methods in the past but they have generally focused on the “birth/death” adjustment that the BLS uses to account for the creation of jobs by new businesses. In the past several years, these BLS adjustments have proven to be fairly accurate. But the BLS does not appear on CNBC to refute their critics.

This TrimTabs report focuses on several other flaws in BLS methodology. The methods that the BLS uses were developed many years ago when the majority of employment in the U.S. was in manufacturing. Today, manufacturing represents a small portion of the U.S. economy. Yet the BLS continues to survey mostly manufacturing companies and government institutions to come up with their unemployment number. Of the private companies surveyed by the BLS, most of them are large despite the fact that smaller companies, those with 500 employees or less, make up 50% of the economy and most of the economic growth in the U.S.

The BLS reports a statistical 90% confidence in their estimate numbers, resulting in an error of + or – 100,000 jobs lost to their monthly estimate, a relatively small error out of a workforce of 140 million. But market trading is based on pre-estimates of monthly jobs lost by “analysts” as well as competing estimates like that of the payroll processing company ADP. If the BLS figure of jobs lost is 300,000 and concensus pre-estimates were 400,000 jobs lost, the stock market often rebounds. Yet, statistically, the BLS estimate could be the same as pre-estimates. The market conveniently forgets the sampling error of both analyst estimates and the BLS estimates and trades on the estimates as though they were hard data.

The BLS does not report on the hard data, actual state unemployment insurance claims, till it has received and compiled all the state reports. This is done about 12 months later.
In a 12 month period during 2005-06, TrimTabs research shows that the BLS had underestimated job growth by 750 million when the estimates were compared with actual data. While the BLS does a remarkable job gathering data from almost 400,000 companies in a month to arrive at their estimates, the problem of accurately assessing the employment activity of this country is enormous.