July 7th, 2013
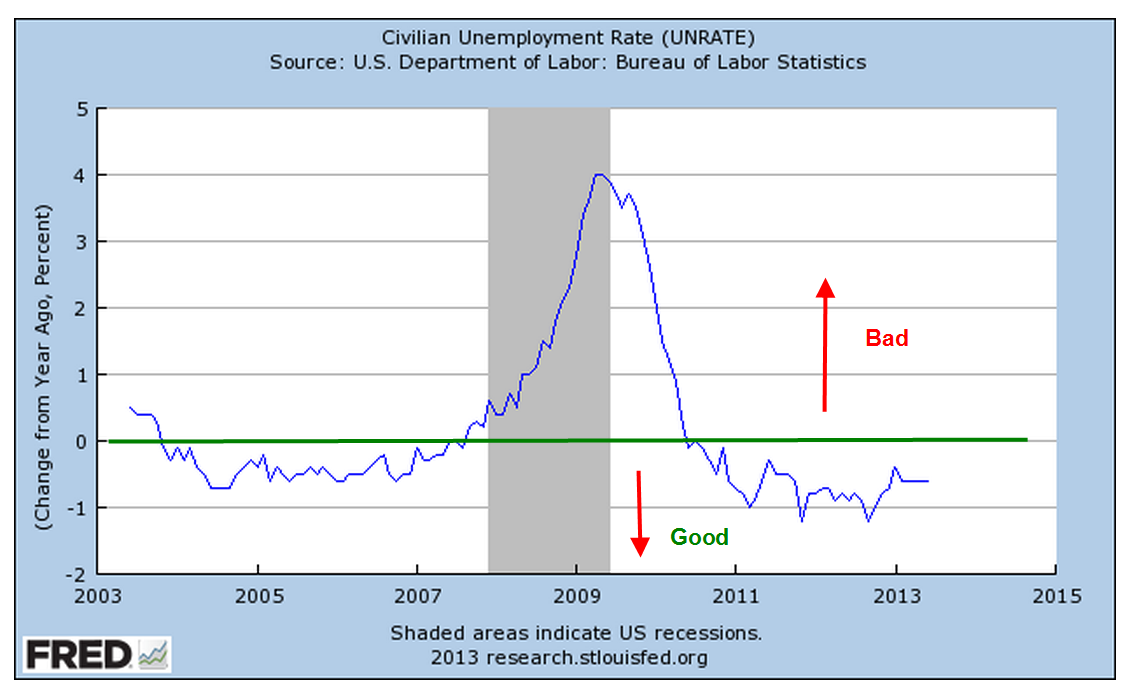
A better than expected June labor report released this week prompted some speculation that the Federal Reserve may begin tapering its quantitative easing program as early as this fall. The employer survey reported a net gain of 195,000 jobs and the gains of earlier months were revised up 70,000. Government workers continue to decline. We will see that the modest strength in the labor market is part of a mixed employment picture. The unemployment rate remained steady at 7.6%; the year over year percent change in this headline index continues to chug along in the “good” territory.
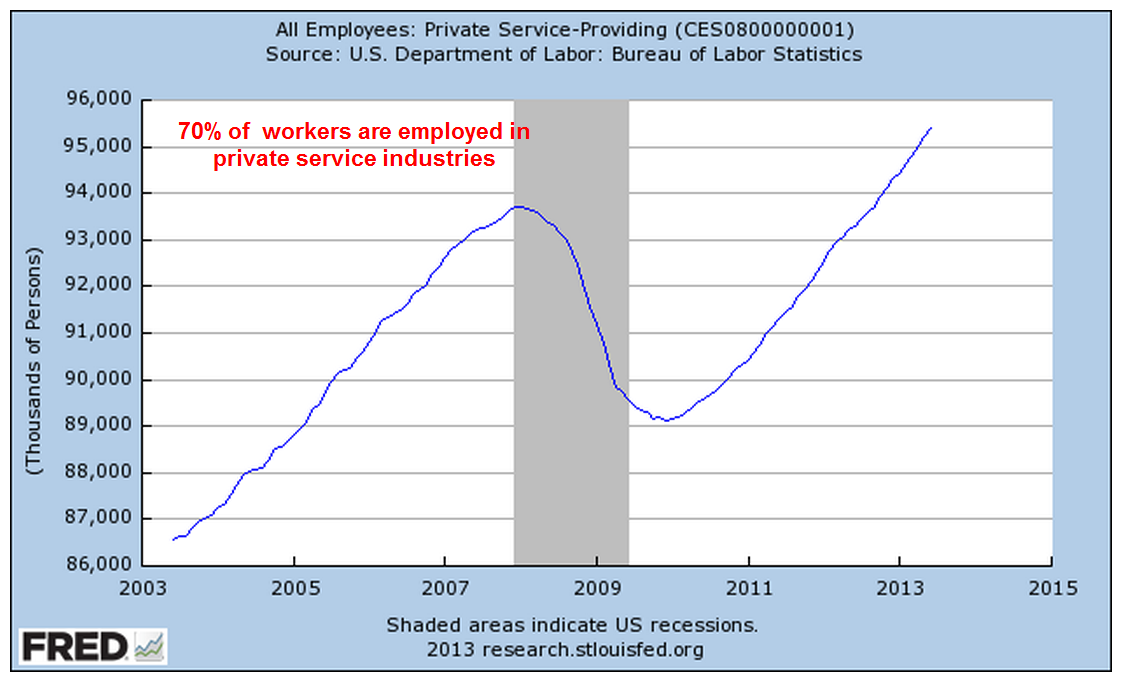
70% of workers – about 95 million – are employed in private service jobs, most of which showed strong gains in the past quarter.
14% of workers are government employees; federal, local and state governments continue to shed workers.

As the number of workers declines, the number of people served by each worker continues to rise, approaching levels last seen in the early 1980s and mid-1970s. The government work force would need to decline a further two million, or 10%, to reach the level of 15 people per government worker. That level is still far below the comparatively lean government worker levels of the 1960s and earlier.
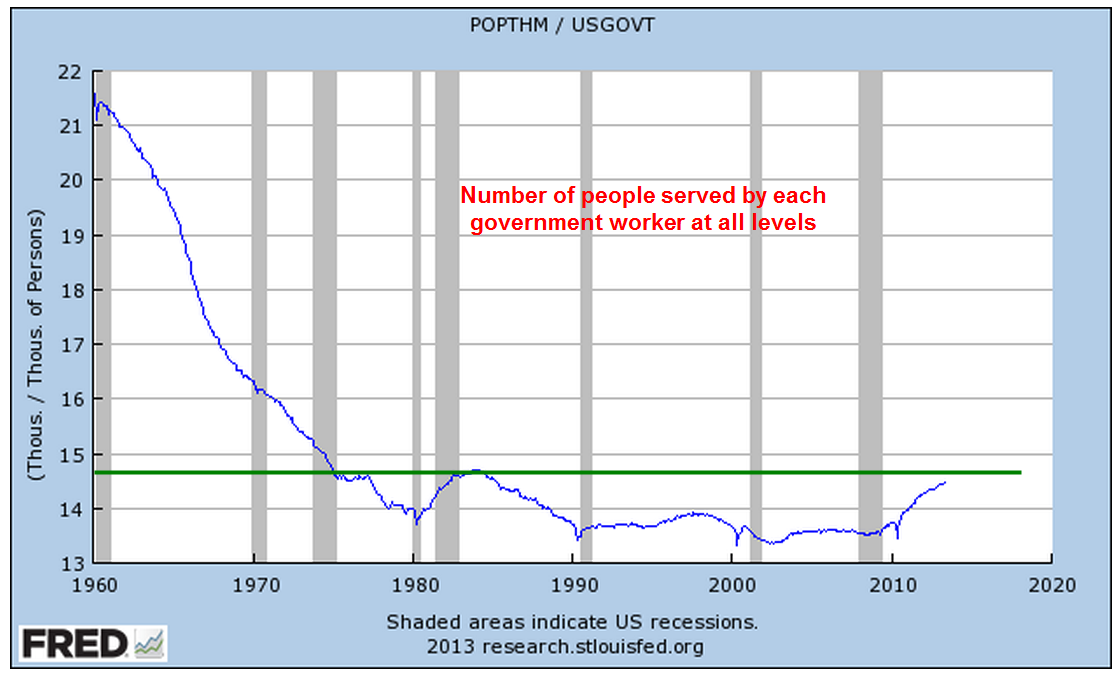
The major part of the attrition in government jobs seems to be over. Local governments are adding employees while the federal government continues to shed employees.

Job gains continue to come in lower paying retail and food service jobs. In 2013, employment finally surpassed early 2008 levels. The average wage of $14 to $17 per hour in these industries is far below the $24 average of all workers and the $20 average of private production and non-supervisory workers.

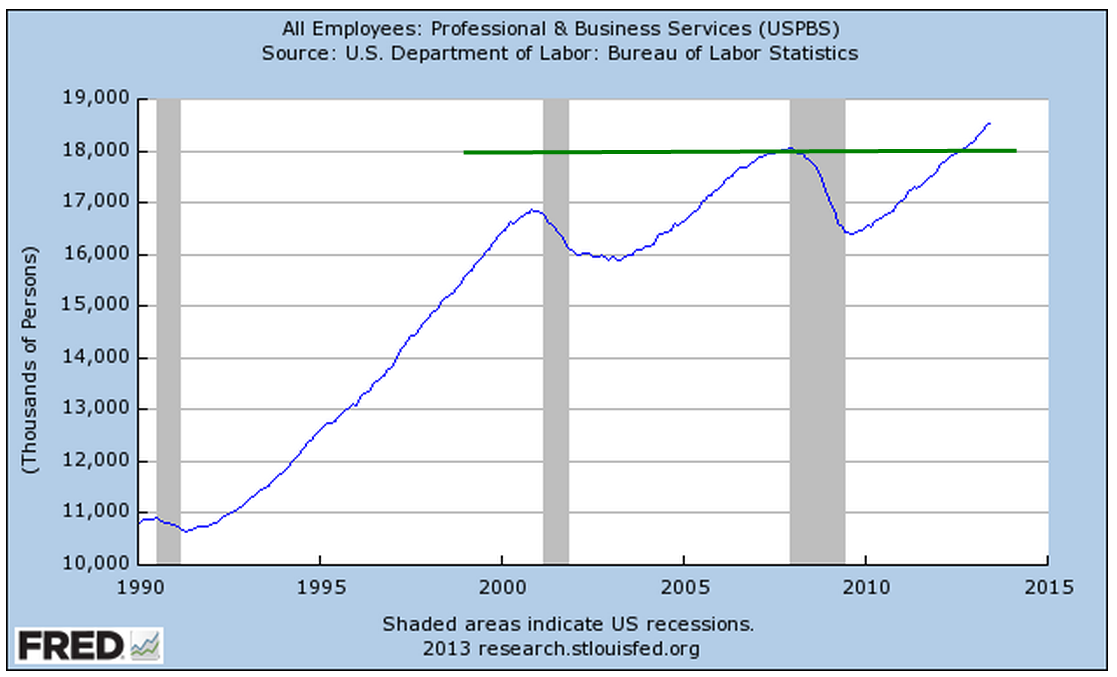
Much higher paying jobs in Professional and Business Service industries continued to show strong gains and have also climbed above 2008 levels. The average wage in this category is 15% higher than that of all workers.
Over seven million people not counted in the labor force or in the headline unemployment rate say they want a job now. Four years after the official end of the recession, the number of “kind of unemployed” remains high.

The number of involuntary part-time workers increased by 322,000, or about 4%, to 8.2 million, over 5% of the total labor force. These are workers who are working part time but want full time jobs. A healthier labor market would have about 3% of these unwilling part timers.

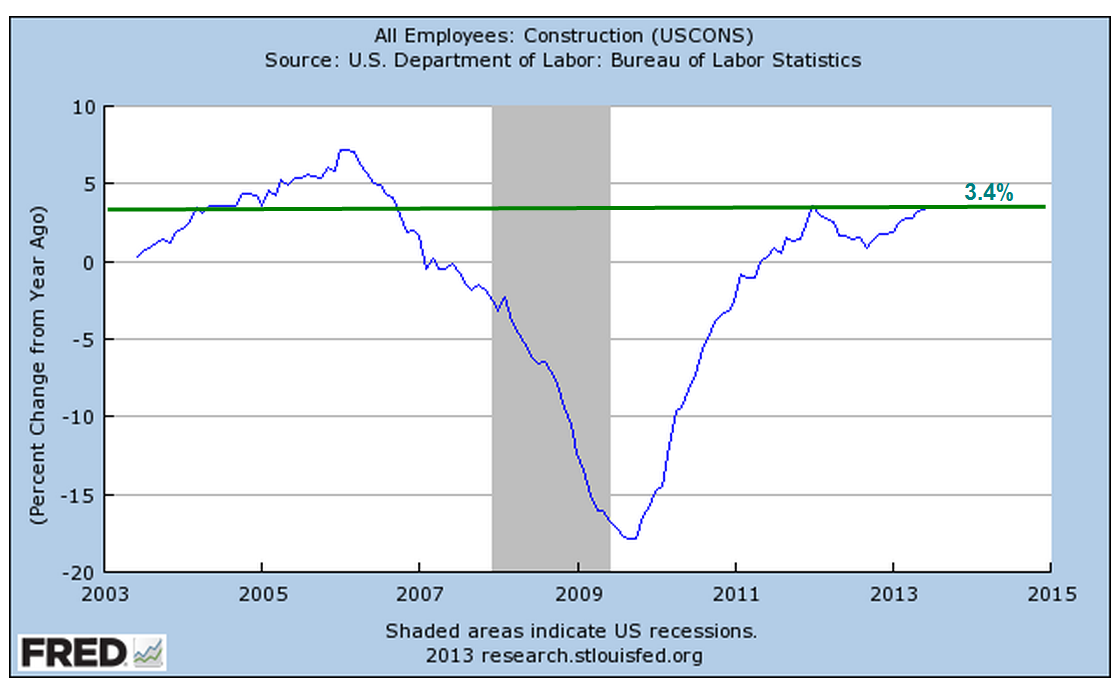
As the number of housing starts increases, the unemployment rate among construction workers continues to decline and dipped below 10% this month. Lower lows in this unseasonally adjusted index of unemployment is a good sign.

But the year-over-year percent change in construction employment is still not robust enough to reverse the heavy job losses since the onset of the recession.
The core work force aged 25 – 54 dropped by 100,000 and continues its slight upward struggle above the recession depths.

A decline in this prime working age population is partly responsible, but the 1.6 million decline in population is but a third of the 5 million plus decline in employment for this age group.

A 2004 paper by a BLS economist, Jessica Sincavage, provides an interesting historical perspective on multi-decade generational trends in the unemployment rate. She noted “The characteristics of today’s younger workers differ from those of their baby-boomer counterparts in several ways that may affect the former group’s impact on the labor force and the unemployment rate now and in the future. Among the relevant characteristics affecting both groups are school enrollment patterns, race and Hispanic origin, and women’s labor force participation.”
In 1979, over 42% of the last of the boomer generation aged 20 – 24 were enrolled in school. In 2002, under 37% of the “echo boomer” generation aged 20 -24 were enrolled. Easy job availability, the growth of the internet and the sustained rise of the stock market during the 1990s persuaded many younger workers that the opportunity cost of going to college was simply not worth it.

The onset of this recession has divided the prime work force into two groups. For those with a degree unemployment has remained low. For those without the higher education, unemployment is almost double. In a curious correlation, the unemployment rate for three groups is about the same – the general labor force, workers above 25 years with a high school only education, and Hispanics.
The third factor noted by Ms. Sincavage is the participation rate of women in the labor force. In her 2004 paper she observed “In 1979, the participation rate of women 16 to 34 years was about 63 percent; by 1999, it was 70 percent.” By the mid 2000s, this cultural and demographic bulge began to decline. The rate for all women has now declined below the levels of the early 1990s.

Although there was a lot to like about this month’s labor report, recent job gains are swimming against an undertow of shifting demographics and labor demands from employers. A casual reading of the headline numbers might lead one to discount these long term negative trends.
