December 6, 2015
A horrible week for many families. When we count the dead and injured in mass shootings, we often neglect to include the family and friends of each of these victims. If we conservatively estimate 20 – 30 people affected for each victim, we can better appreciate the emotional and economic impact of these events. Shooting Tracker lists the daily mass shootings (involving four or more victims) in the U.S. in 2015. What surprised me is that, in most cases, the shooter/assailant is unknown.
A strong November jobs report sent equities, gold and bonds soaring higher on Friday. Markets reacted negatively on Thursday following a lackluster response from the European Central Bank(ECB) and comments by Fed chair Janet Yellen indicating that a small rate increase was in the cards at the mid-December Fed meeting. The SP500 closed Thurday evening below November’s close. Not just the close of November 2015, but also the monthly close of November 2014!
Overnight (early Friday morning in the U.S.), the ECB said that they would do whatever it took to support the European economy. Shortly after the cock crowed in Des Moines, the Bureau of Labor Statistics released November’s labor report, confirming an earlier ADP report of private job gains. By the end of trading on Friday, the SP500 had jumped up 2%. However, it is important to step back and gain a longer term perspective. The index is still slightly below February 2015’s close – and May’s close – and July’s close.
Extended periods of price stability – let’s call them EPPS – are infrequent. Markets struggle constantly to find a balance of asset valuation. Optimists (bulls) pull on one end of the valuation rope. Pessimists (bears) pull on the other end. Every once or twice in a decade, neither bears nor bulls have a commanding influence and prices stabilize. Markets can go up or down after these leveling periods: 1976 (down), 1983 (up), 1994 (up), 2000 (down), 2007 (down), 2015 (?)
**************************
Year End Planning
Mutual funds must pass on their capital gains and losses to investors. Investors who have mutual funds that are not in a tax-sheltered retirement account should take the time in early December to check on pending capital gains distributions either with their tax advisor or do it themselves. Most mutual fund companies distribute gains in mid to late December. Your mutual fund will have a list of pending December distributions on their web site. For those retail investors in a rush, you might just scan through the list and look for those funds that have a distribution that is 5% or more of the value of the fund, then look and see if it is one of your funds.
An EPPS tends to produce relatively small capital gains but this year some mid-cap growth funds and international funds may be declaring gains of 7 – 10% of the value of the fund. An investor who had $50,000 in some mid-cap growth fund might see a capital gain distribution of $4,000 on their December statement. When an investor receives the statement in January 2016, it is too late to offset this gain with a loss. Depending on the taxpayer’s marginal tax rate, they could be on the hook to the tax man for $700 – $1200.
Let’s say an investor is anticipating a $4000 capital gain distribution in a taxable mutual fund in late December. Most mutual fund companies list the cost basis of each fund in an investor’s account. An investor who had a cost basis that was higher than the current value of the fund could sell some shares in that fund to offset some or all of the capital gain distribution in the other fund. This is called tax loss harvesting. Again, remind or ask your tax advisor if you are unclear on this.
Here is an IRS FAQ sheet on capital gains and losses. Here is an article on the various combinations of short term and long term gains and losses.
**************************
CWPI
The latest ISM Survey of Purchasing Managers (PMI) showed that the manufacturing sector of the economy contracted in November. October’s reading was neutral at 50.1. November’s reading was 48.6.
The services sector, which is most of the economy, is still growing strongly. Both new orders and employment are showing robust growth.
However, manufacturing inventories have contracted for five months in a row. For now, this decline is more than offset by inventory growth in the service industries. However, the drag from the manufacturing sector is affecting the services sector. The trough and peak pattern of growth in employment and new orders since the recession recovery in 2009 has begun to get a bit erratic. Nothing to get too concerned about but something to watch.

The Constant Weighted Purchasing Index combines the manufacturing and service surveys and weights the various components, giving more weight to New Orders and Employment. Both components anticipate future conditions a bit better than the equal weight methodology used by ISM, which conducts the surveys. In addition, there is a smoothing calculation for the CWPI.
During this six year recovery, the CWPI has shown a wave-like pattern of growth. Since the summer of 2014, growth has remained strong but there has been a leveling in the pattern as the manufacturing sector no longer contributes to the peaks of growth.
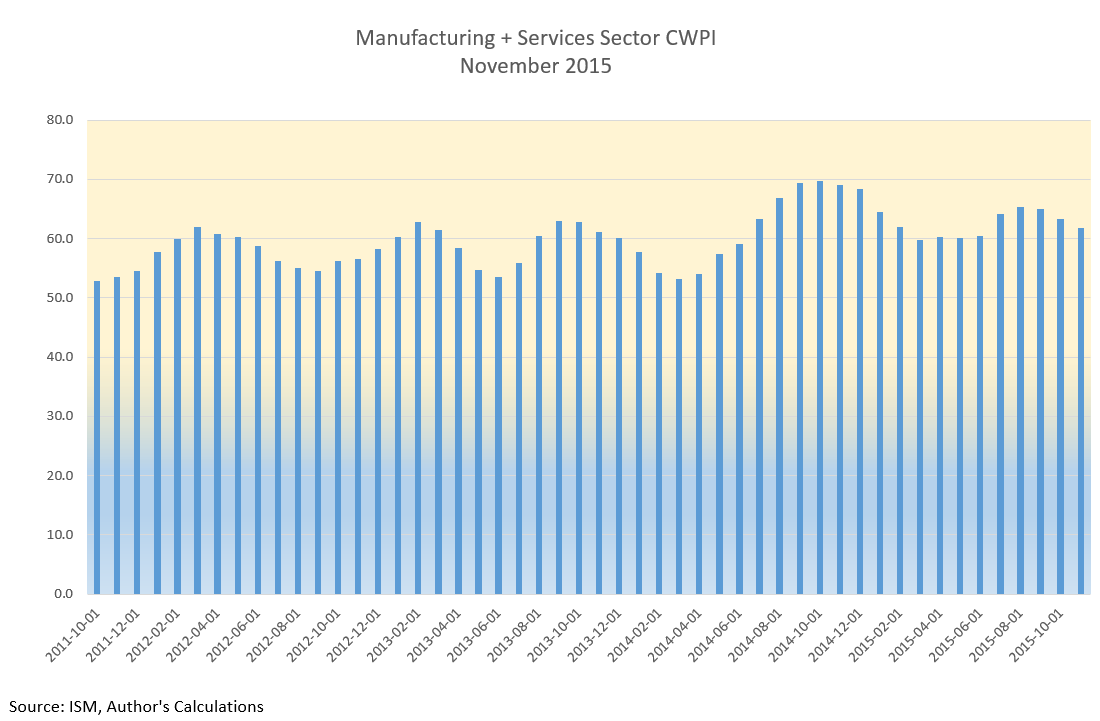
Despite the underlying growth fundamentals, there are some troubling signs. In response to activist investors, to boost earnings numbers and maintain dividend levels, companies have bought back shares in their own company at an unprecedented level. In some cases, companies are taking advantage of low interest rates to borrow money to make the share buybacks. (U.S. Now Spend More on Buybacks Than Factories, WSJ 5/27/15)
*******************************
Labor Report
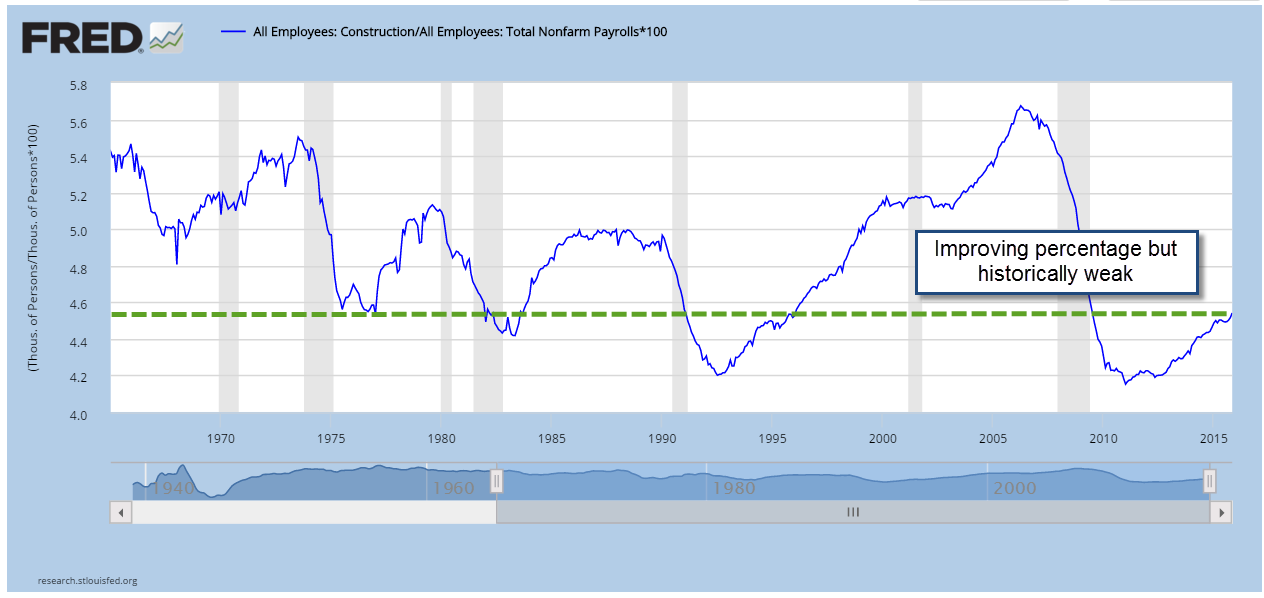
46,000 jobs gained in construction was a highlight of November’s labor report and was about a fifth of all job gains. Rarely do gains in construction outweigh gains in professional services or health care. This is more than twice the 21,000 average gains of the past year. The steady but slow growth in construction jobs is heartening but a long term perspective shows just how weak this sector is.
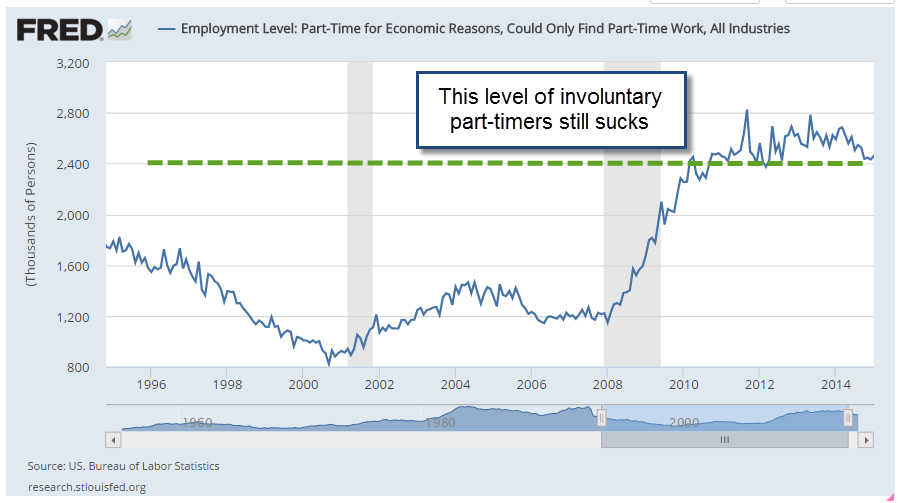
Involuntary part-timers, however, increased by more than 300,000 this past month, wiping out a quarter of the improvement over the past year. These employees, who are working part time because they can not find full time work, have decreased by almost 800,000 over the past year.
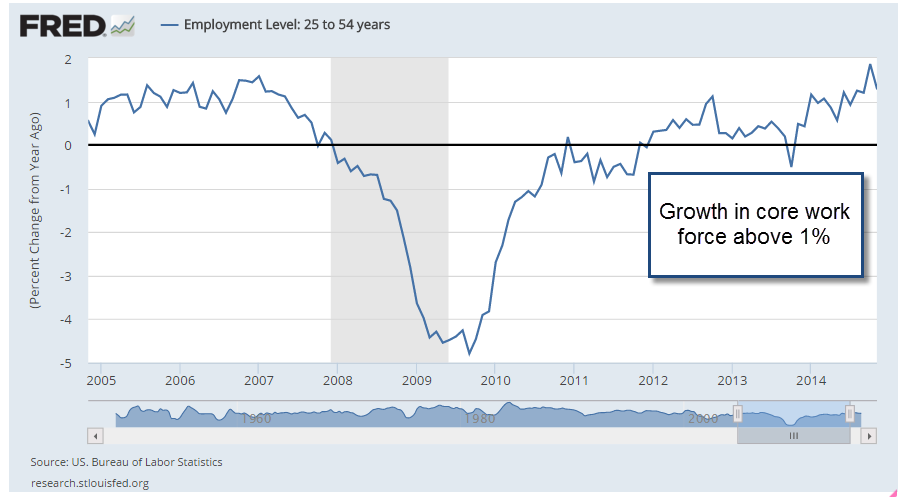
The core work force, those aged 25-54, remains strong with annual growth above 1%.
Other notable negatives in this report are the lack of wage growth and hours worked. Wage growth for all employees is a respectable 2.3% annual rate, but only 1.7% for production and non-supervisory employees. This is below the core rate of inflation so that the income of ordinary workers is not keeping up with the increase in prices of the goods they buy.
Hours worked per week has declined one tenth of an hour in the past year, not heartening news at this point in what is supposed to be a recovery. Overtime hours in the manufacturing sector has dropped 10% in the past year.
******************************
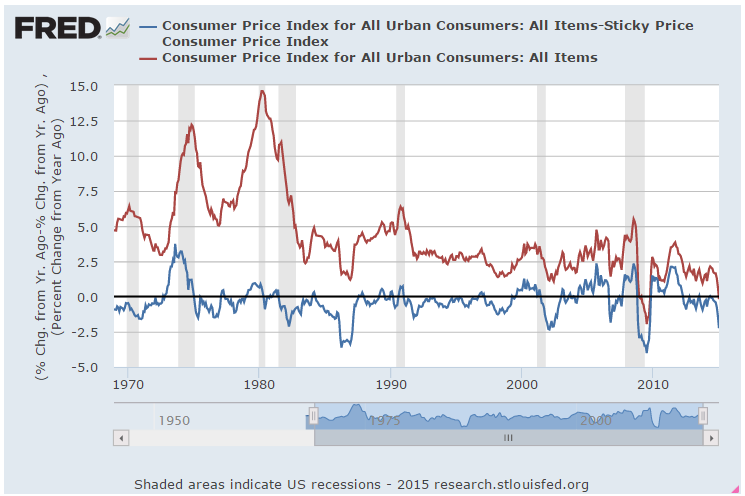
Inflation
The core CPI is a measure of inflation that excludes the more volatile price changes of food and energy. While the headline CPI gets the attention, this alternative measure is one that the Federal Reserve looks at to get a sense of the underlying inflationary forces in the economy. The target annual rate that the Fed uses is 2%.
October’s annual rate was 1.9%. November’s rate won’t be released till mid-December. However, Ms. Yellen made it pretty clear that the Fed will raise interest rates this month, the first time since the financial crisis. I suspect that prelimary reports to the Fed on November’s reading showed no decline in this core rate. With employment gains and inflation stable, the FOMC probably felt comfortable with a small uptick in the bench mark rate.