March 22, 2015
Monetary Policy
The FOMC is a committee of Federal Reserve members who meet every six weeks to determine the course of monetary policy. A statement issued at the end of each two day meeting is carefully parsed by traders in an orgy of exegesis. And thus it was so this past week. Recent statements by the Fed included the word “patient” as in low inflation and some lingering weaknesses in the labor market allow us to take a patient approach with monetary policy. If the Fed removed the word patient, then it was a good bet that they would start raising rates at their mid June meeting. By the end of the year, the thinking was, the benchmark Fed funds rate could be 1%-1.25%.
So here’s what happened while you were at work, or at lunch or picking up the kids on Wednesday afternoon when the Fed meeting concluded. The initial reaction was negative, or at least that’s how the HFT (high frequency) algorithms parsed the Fed’s statement. “Patient” was gone. Sell, sell, sell. Then some human traders noticed that the Fed was also saying that they did not have to be impatient either – the perfect neutral stance. Buy, buy, buy. The SP500 jumped 1.5% in a few minutes. The neutral stance of the Fed caused many to revise their estimates of the Fed rate at the end of the year to .75% or less. The broad market index ended the week at the same level as it was when the month began. Volatility as measured by the VIX is rather low but there has been a lot of positioning since Christmas and a net gain of only 1% in those three months.
*********************
Earnings Recession
The analytics firm FactSet projects a year-over-year decline in the earnings of the SP500 companies for this first quarter of 2015. Here is a good review of the historical response of the stock market to earnings recessions, defined as two quarters of year-over-year declines in the composite earnings of the SP500.
***********************
Oil
Oil is an international commodity that trades on world markets in U.S. dollars. A prudent strategy for countries which are net importers of oil is to stock up on dollars to pay for its short term oil needs. As the demand for dollars climbs so does its price in other currencies, a self-reinforcing mechanism. Half of the drop in the price of oil is due merely to the appreciation of the dollar, which has spiked some 25% since the beginning of the year.
For decades, many in academia and government have advocated the adoption of an international currency called the SDR, already in use by the International Money Fund. Here is an article from last May, before the price of oil started its slide. The dollar is the latest in a series of reserve currencies over the past 500 years and has been the dominant currency for almost 100 years (History here). The reliance on one country’s currency works – until it begins to cause more problems than it solves. The largest producer and consumer of oil, Saudi Arabia and the U.S., have formed a decades long agreement to price oil in U.S. dollars, binding the rest of the world to the movements in the U.S. dollar.The recent volatility in the dollar in threatening the economic stability of many nations, who are increasing their calls for a change in international monetary policy.
***********************
Sticky CPI
In a survey of newspaper articles, inflation was mentioned more than unemployment or productivity. In the U.S., inflation is often measured by the Consumer Price Index (CPI). A subset of that measure is called the core CPI and excludes more volatile food and energy items to arrive at a fundamental trend in inflation. (IMF primer on inflation ) Critics of the core CPI point out that food and energy items are the most frequent purchases that consumers make and have a fundamental effect on the economic well being of U.S. households. Responding to some of the inherent weaknesses in the methodology of the CPI, the Atlanta branch of the Federal Reserve began development of an alternative measure of inflation – a “sticky” CPI. (History) This metric gives a statistical weight to the components of the CPI by how much prices change for each component. The Atlanta Fed has an interactive graph that charts both the sticky measure and a more volatile, or flexible CPI that is similar to the conventional CPI. The sticky CPI tends to measure expectations of future changes in inflation and moves rather slowly.

Over a half century, the clearest trend is the closing of the gap between the regular CPI and the sticky CPI.
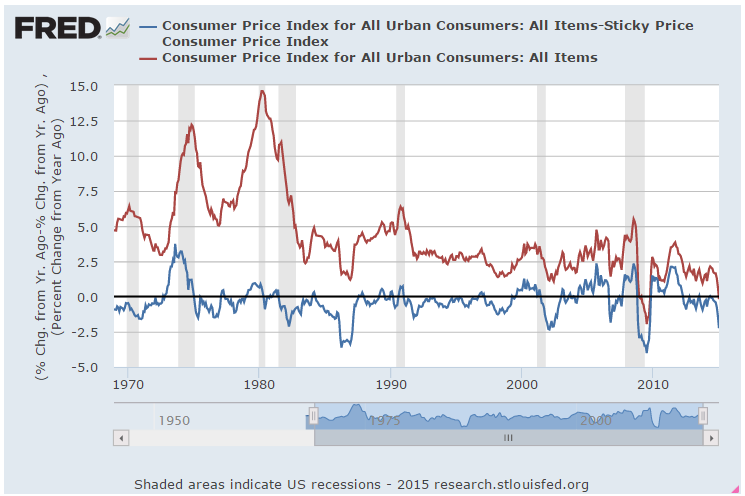
When we compare all three measures, core, sticky and regular CPI, we see that the sticky CPI is usually above the core CPI. January’s readings are 2.06% for the sticky index, 1.64% for the core index and -.19% for the headline CPI index.

A private project called Price Stats goes through the internet comparing prices on billions of items.(WSJ blog article here) This data is more timely and shows an uptick in core inflation that is approaching 2%, the Federal Reserve’s target rate. When asked why the Fed uses 2%, chair Janet Yellen answered that inflation indexes do not capture improvements in products, only prices, so they tend to overstate inflation as a matter of design and practical data gathering. Secondly, the 2% mark gives the Fed a statistical cushion so that they are able to take appropriate monetary steps to avoid deflation.
Why is deflation a bad thing? In answering this question, we discover the true benefit of the core CPI. Food and energy are regularly consumed. Demand for these goods is relatively “sticky”. A family may change what types of foods it buys in response to price changes but it is going to buy food. Deflation in these core purchases can be a good thing as it takes less of a bite out of the average household’s wallet.
On the other hand, deflation in less frequently purchased goods, which the core CPI tracks, is not good because it leads to a self-perpetuating cycle in which consumers delay making purchases in the expectation that tomorrow’s price will be lower than today’s price. If I expect that the price of an iPhone will be lower next week, how likely am I to buy one this week? As consumers delay purchases, suppliers lower prices even more to move their goods. Seeing the price competition among vendors, consumers are even more likely to delay purchases, waiting for prices to come down even further. As sales drop, vendors and manufacturers begin to layoff employees. Lower prices no longer entice consumers who become concerned about keeping their jobs and purchase only what they need.
***********************
Indicators
The Conference Board, a business association, released their monthly index of Leading Indicators this week but it has a spotty history of forecasting trends. Doug Short puts together a nice snapshot of the Big Four indicators, Employment, Real (inflation-adjusted) Sales, Industrial Production, and Real Income.
