Debt Power

Visitors to an air show may have had the opportunity to witness the vertical take off power of an F18 fighter jet.  Flying horizontally to the ground, the jet makes an almost 90° turn and shoots up into the sky, a breathtaking show of power for spectators.  Welcome to the airshow of the last three decades.  Below is a Federal Reserve graph of household debt. (Click on any graph to enlarge)

  Aren’t you impressed with the sheer power of consumer borrowing?  Next in our air show is state and local government borrowing.

Not to be outdone, Fannie and Freddie, the government sponsored mortgage companies, show off their impressive borrowing power.

And lastly, our federal government turns on the after burners and shoots up into the debt stratosphere.  This chart does not include the almost $5 trillion of debt the federal government owes its agencies, like the Social Security trust funds, or the Federal Reserve.

Together, we – after all, it’s our governments – are the Blue Angels of debt – or perhaps we should be called the Red Angels of debt.  Together, we have piled up over $31 trillion in debt, more than twice the national GDP. 

Even if we devoted 10% of a $14 trillion GDP to paying down all this debt, it would take over twenty years.  As any one of us knows, debt is a serious drag on savings and investment.  We can expect that the drag of this debt will be with us for many years to come.

Money Ratios

A Denver investment advisor, Charles Farrell, has just written a book titled “Your Money Ratios” that should be part of a course for high school seniors. Mr. Farrell gives clear, simple guidelines for personal savings goals and debt ratios based on your income and age. The book lays out a game plan for making the transition from laborer to capitalist, from working for money in your twenties to having your money work for you to support you in retirement.

In simple language, Mr. Farrell explains many financial products that a person will encounter during their lifetime: stocks, bonds, various forms of insurance. He gives clear guidelines for mortgage and education debt as a ratio of your income and age. He compares the long term costs or savings of buying a house vs. renting.

His ratios are age-adjusted signposts, easy to understand and easy to use as a financial fitness check.

Disposable Personal Income

Disposable personal income is a benchmark that is used to assess aspects of our financial condition, like debt and wealth. What is it? It is gross income, including any transfer payments like Social Security that we receive, less taxes.

Discretionary income is what we have left of disposable income after paying our rent or mortgage, utilities, food and clothing – the essentials. Discretionary implies that we have some choice about whether to spend the money or not. What is discretionary to one person may seem like a necessity to another person. For those of us who are having some financial difficulties, it can be both fruitful and painful to reassess our guidelines for what is a necessity. A cell phone, once regarded as a luxury item, is now considered by many to be a utility like electricity. Is the monthly $100 voice/data plan we are on a necessity or could we get by with a $30 monthly voice plan instead? As I said, these reassessments can be painful.

Some regard a new car every three years a necessity while others view it as a luxury. In any assessment of our personal expenses, it is frightingly easy to lie to ourselves, to convince ourselves that something really is an absolute necessity and to line up several reasons why a particular item is a necessity.

Of the two income benchmarks, disposable personal income (DPI) is easier to measure and to gauge our debt. Household debt, which includes both consumer and residential mortgage debt, was about 80% of disposable personal income during the 1980s and 1990s. Household debt is now 122% of DPI, down from 129%. Americans are saving more but they have quite a ways to go to decrease their debt levels.

Credit Guard has a good guide to personal budgeting.

Budget Aneurysm

In mid 2008, the Office of Management and Budget (OMB) under President Bush estimated a $400B total deficit for fiscal year 2008, ending in Sept. 2008, and a deficit of $450B for the 2009 fiscal year.

In Dec. 2008, after the financial implosion of Sept. 2008, the non-partisan Congressional Budget Office (CBO) estimated that the total deficit would be about $1T. In Jan. 2009, before the new President was sworn in, the CBO revised their deficit projections upward to $1.2T, or 8.9% of GDP.

The 2009 fiscal year just ended Sept. 30th and the CBO announced this week that the actual deficit numbers will probably come in at $1.4T, or 9.9% of GDP. For a historical look at the budget numbers since 1968, click on Historical Budget Data at the CBO site. There you will see trends, like the defense spending trend shown in Table F-8. Although President Bush has been vilified by some for his military spending, he has spent less than his Dad did, and about 2/3 as much as President Reagan on defense as a percentage of GDP.

Since this data is in spreadsheet form, you can play with it. In dollars, personal income tax revenues almost doubled and Social Security taxes more than doubled during Reagan’s tenure. What were income tax revenues as a percentage of GDP? Go to the table with GDP figures, copy those figures into the table with income tax revenues and run a column of percentages. Bet you never had this much fun since you and Lindy Lou went to the lake in high school.

Can’t sleep at night because you are wondering what the size of the total public debt is? No problem. The Treasury updates the public debt daily.

Consumer Debt

Each quarter, the Federal Reserve calculates the average percentage of debt payments to income for households in the U.S. In 1980, credit card and automobile lease payments were about 11% of disposable, or after tax, income. By 1998, they had climbed to 12%. In 2006, that percentage broke 14%. During 2008, the American consumer has been whittling down that percentage to about 13.5% of disposable income.

Every 3 years, the Fed conducts a detailed survey of consumer finances. In its most recent released 2007 Survey of Consumer Finances, the Fed found that 2/3 of families had applied for credit in the past five years. 30% of those had been either turned down or been approved for less credit than they applied for (pg 45). 73% of families had credit cards but only 60% of those with credit cards had balances due, a healthy sign that families were paying off their credit card balances each month (pg 46). However, those holding credit card balances saw a 25% increase in their balance to about $3000. The median interest rate on a bank type credit card was 12.3% (pg 47).

Einstein said that compound interest was the most powerful force in the universe. When we owe debt, that power of compound interest is working for the other guy, the company we owe the money to. That 12% in interest we pay to a credit card company is in after tax dollars, meaning that it is more like 15% – 20%, depending on the tax bracket we are in. Translating that into hours, it means that we may work 1/2 day to a day each week just to pay the interest on the debt. We become someone else’s work slave.

Debt Mountain

There has been a big rally in corporate bonds in the past few months. Decreasing fears of defaults has sparked a huge inflow of money into these bonds. The U.S. corporate bond market is large, with $9.8 trillion in outstanding debt – 1.5 times the amount of outstanding Treasuries, or about 70% of the nation’s GDP.

According to Federal Reserve data, the U.S. mortgage market is even bigger – $14.7 trillion at the end of 2008, of which $8.2 trillion is securitized. The three government agencies Fannie Mae, Freddie Mac and Ginnie Mae now back 90% of mortgages.

Debt Burden

In his book “American Theocracy”, economist Kevin Phillips compares this decade with that of the Depression. In 1929, the total of government, corporate, financial and household debt was 287% of GDP. In 2004, it was 304% of GDP. At the end of the first quarter of 2009, the Federal Reserve estimates that we had almost $34T in debt. With an estimated annual GDP of $14T, we have a debt load about 2.5 times GDP. That sounds better, huh? Not quite.

In 1929, there was no Social Security trust fund for the federal government to borrow from because Social Security would not be set up for another four years. Because Social Security pay outs have been less than Social Security receipts in the past several decades, largely due to the large number of working payers in the boomer generation, the Federal government has been borrowing this extra money. By borrowing from the Social Security trust fund, the federal government does not have to borrow from other countries like China, but the easy availability of this money has allowed politicians on both sides of the political aisle to fund a lot of programs through the years by borrowing against the future – our future and our children’s future.

The Federal Reserve does not include this “intergovernmental” debt in its calculation of total debt, estimated at $4.3 trillion. Add that to the total debt load of $34T and the total comes to more than $38T of debt or a percentage of total debt to GDP that is close to that of the depression.

The good news is that Americans have been reducing their debt load. The bad news is that we still have some ways to go to get healthy. It will be a slow recovery as reduced consumption continues to dampen production.

Household Debt

Thanks to Lydia who sent a link to a Toronto Globe and Mail interview by Heather Scoffield with Laurence A. Tisch, professor of history at Harvard University, and author of The Ascent of Money, A Financial History of the World. Some notable comments:

“This is a very unfair crisis. Here is the world’s biggest economy, which gave us subprime mortgages, rampant securitization, the collateralized debt obligation, Lehmann Brothers, Merrill Lynch. The epicentre is the United States, but the rest of the world, and particularly America’s trading partners, will get hit harder than the U.S. … because the U.S. retains the safe-haven status.” Safe haven is when, in a crisis, the rest of the world buys U.S. Treasury notes and bonds.

“Property ownership is something that our societies, particularly English-speaking societies, seem to be drawn towards. The notion that the majority of people should own their own homes dated from the 30s. It didn’t really become a reality until the 50s. We’ve sort of pushed the home ownership rate up to what seems to be its maximum, and beyond. It will clearly come down. The lesson of the subprime crisis is that you shouldn’t give mortgages to people who can’t afford them.”

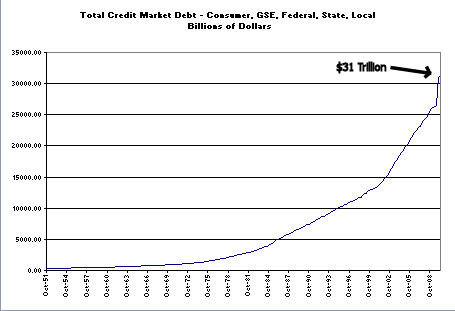
“It’s a crisis of excessive debt, the deleveraging process has barely begun, the U.S. consumers are not going to suddenly bounce back and hit the shopping malls just because they get a tax cut. The savings rate is going to continue to rise. These processes have tremendous momentum that quite clearly differentiates them from anything that we’ve seen, including the early 80s, including 73, 74, 75. Those big crises, the ones that we have lived through, were bad. But seems certain to be deeper, and more protracted. “

“August, 2007 was when this crisis began. And if you were really watching the markets carefully, April is when it began, when the various hedge funds started to hemorrhage. The stock markets carried on until October of that year. And in many ways, consumer behaviour in the U.S. did not change until the third quarter of 2008.”

“$2-trillion worth of debt is going to hit the market this year, maybe more. Supply is exploding just when demand is contracting.” “There is still this inertia that prevents the dollar from falling off a cliff, that keeps the Treasury market from falling off a cliff.” “If I were in the market to buy distressed assets, I would wait, I would wait a bit longer until they’re really desperate. And it might even be better to wait until they’re bankrupt.”

“From John Law in 1719 to Alan Greenspan in the late 90s, there’s always a banker, there’s always a central banker making credit too readily available. The second thing is, though, that regulation may not prevent that.”

“Monetary policy evolved in a peculiar way in the 1990s towards de facto or de jure targeting of inflation, an increasingly narrow concept of inflation – core CPI.” “When the central bankers got together at Jackson Hole, the view that emerged from the debate in the late 90s was, we shouldn’t really pay attention to asset prices in the setting of monetary policy.”

“European banks are far more leveraged than American banks.”

“But one of the things that I find troubling about the administration is the degree to which is has ceded power to Congress. It’s almost like it’s a parliamentary system.”

“If you subtract mortgage equity withdrawal from the Bush years, the real underlying rate of growth of the U.S. economy was 1 per cent.”

“If you have a more equitable redistribution through the tax system, which Obama is committed to, it might actually be no discernible downside for middle America and lower-class Americans. So many of the benefits of the boom went to the elites.”

Debt, Household

In his “Ahead of the Tape” column in WSJ 3/11/09, Mark Gongloff reports that 3rd quarter household debt recorded its first decline since recordkeeping began in 1952. Even with the decline, household debt was a whopping 96% of GDP. In 1998, it was 66% of GDP. The Fed releases 4th quarter data on 3/12/09.

Why were many of us taking on more debt? Easy credit is one answer. The other is less income. The median income has been decreasing, not increasing. The Grandfather Economic Report presents several pictorial and informative analyses of economic trends for families by a NASA physicist with postgraduate work in business and economics. Milton Friedman liked it.

In an op-ed in WSJ 3/12/09, Daniel Henninger reviews a “Top 1% earners” chart that shows the net that the top 1% of earners took home over the past decades. It is a part of Obama’s recently released budget. Henninger notes some of the flaws of this chart, it’s primary flaw being that it is a tool of “progressives.” Whatever its flaws, this summary of median income data shows that the trend is real. Henninger says that the “primary goal [of the Obama budget] is a massive re-flowing of ‘wealth’ from the top toward the bottom.” Henninger denies any “reflowing” of wealth from the bottom to the top in the past few decades.

There is no set of facts that can sway the path of a herd ideology, whether it be on the right or left.