October 20th, 2013
This coming Saturday is the 132nd anniversary of the gunfight at the OK corral. We got our own OK corral in Washington and there was a whuppin’ this week – a Washington style whuppin’, which means that no one got whupped but everyone agreed on an appointment date for a future whuppin’.
Congress passes a continuing budget resolution with the same frequency that many of us get our teeth and gums cleaned. Many government reports were not released this past week but the National Assoc of Homebuilders (NAHB) released a very positive monthly report of the national housing market, showing a slight decline over the past few months last month but still a strong index reading of 55. Two years ago this October, that index stood at 15. In fact since the latter part of 2007, the index oscillated in the range of 15 – 20, so this has been a strong and sustained growth surge.

Over the past hundred years, house prices have risen at about the same rate as inflation, so that the real price of homes stays about the same. Most homeowners finance their home purchase and it is this interest cost that determines the total capital cost of the home. That capital cost and the interest cost is divided over the life of the mortgage into monthly payments. PITI is a familiar acronym to many home owners and buyers; the initials represent the components of a monthly house payment. The ‘P’ stands for Principal – the monthly capital cost of the home. The ‘I’ is interest on the amount of the loan. The ‘T’ represents the local real estate taxes which are included in the monthly house payment sent to the mortgage servicer who forwards them on to the local taxing agency. The ‘I’ represents Insurance. This can be both house insurance and, for those with an FHA loan, the amount of the loan insurance. The interest rate on the home loan is a key component and although there has been an increase in mortgage rates since the spring, they are near all time lows. A 30 year mortgage is a common benchmark.

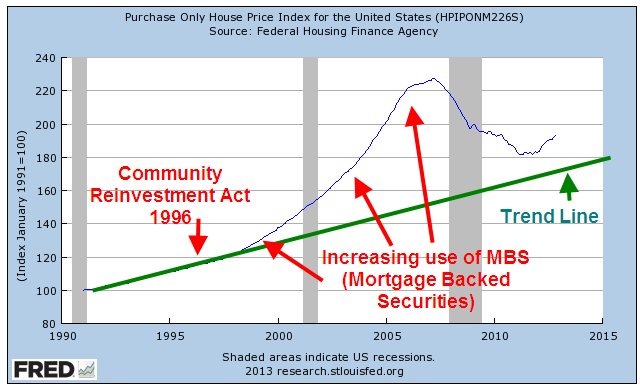
Let’s index the CPI and the house price index to 1991 and look at the divergence.
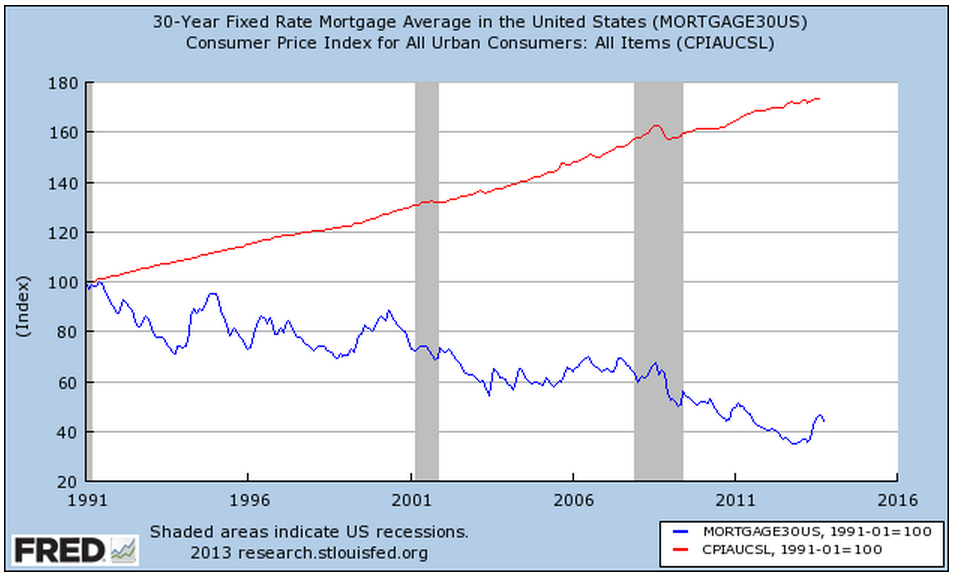
Declining interest rates have enabled many more people to qualify for a home purchase, thus driving up home prices. In 1995, Congress made some major revisons to the 1977 Community Reinvestment Act, making home loans more available in distressed urban and rural districts. This further exacerbated the rise in home prices, creating a large divergence between the CPI and the housing price index.

As every homeowner knows, the cost of a home includes maintenance, repairs, utilities, and improvements. As I discussed last week , real median household incomes plateaued during the 2000s. The rise in home values and changes in banking laws enabled homeowners to tap the equity in their homes to meet these additional obligations and to augment stagnant incomes.

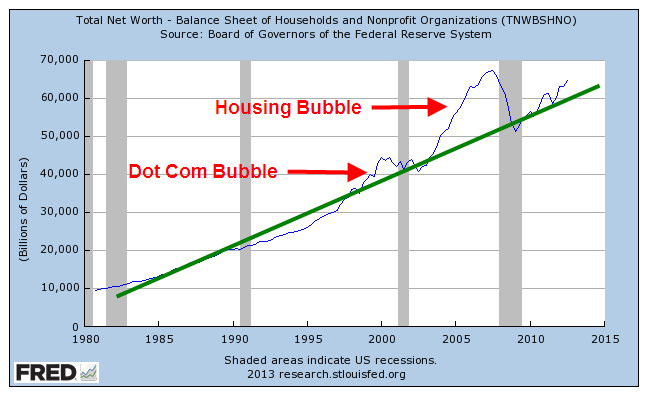
In the past dozen years, many people discovered that housing is not a reliable source of income. At the turn of the century, stock traders who quit their jobs to trade stocks during the tech bubble, discovered the same truth about the stock market, whose price returns are a few percent above inflation. A nifty calculator at DQYDJ illustrates the average returns of the SP500 over the past 100 years.

At the heart of the financial follies of past centuries is that a surge in price for some asset, be it tulip bulbs, Florida real estate or tech stocks leads people to conclude that they can hop on the gravy train. What is the gravy train? As an asset increases in value, more people invest in the asset bubble, the valuation continues to rise and – for a time – it is possible to convert a stock, a store of value, into a flow of income by either buying and selling the asset or borrowing money against the asset. There is always some constraint – the rise of inflation, or the rise of personal incomes, or the growth rate of profits – that eventually brings an asset valuation down to earth. Einstein famously quipped that the most powerful force in the universe was compound interest. He might have mentioned what may be the most powerful force – reversion to the mean.