Happy Days

January 27th, 2013

This past week, Republicans in the House passed a bill to delay the raising of the debt ceiling till May.  The S&P500 crossed 1500, nearing the high of 1550 it set in October 2007.  This past week, money flowing into equity mutual funds finally surpassed the flows into bond funds (Lipper Source)

As the saying goes, “The trend is your friend.”  When the current month of the SP500 index is above the ten month average, it’s a good idea to stay in the market.

So, happy days are here again!  Well, not quite.  Household net worth is still climbing but has not reached the 2007 peak.

But when we step back and look at the past thirty years, household net worth is better than trend.

Asset bubbles overly inflate and deflate net worth, which includes the valuation of assets like stocks and homes.  An asset bubble is like a Ponzi scheme in that those who get in toward the end, before the bubble bursts, often suffer the worst.

CredAbility, a non-profit credit counseling service, produces a Consumer Distress score that evaluates five categories that have a significant effect on a consumer’s financial stability: employment, housing, credit, the household budget and Net Worth. It has only just broken out of the unstable range into the bottom of the frail range.

The Federal Housing Finance Administration (FHFA) released their House Price index a few days ago.  This price gauge is indexed so that 1991 prices equal $100. The index, which does not include refinancing, came in at $193, or just about 3% per year.  Although housing prices are still depressed from the heights of the housing bubble they are still above the CPI inflation index since 1991.  Housing prices generally rise about 3% – 4% per year, depending on what part of the country you live. 

When we look back twenty years, we can see that housing prices are, in fact, above a sustainable trend line established before the Community Reinvestment Act and the advent of mortgage securitization, both of which undermined rational underwriting standards.

Nationally, we are close to sustainable price trend but still a bit inside the bubble.  Sensing that home prices may have hit bottom, Home Builder stocks as a group are up about 50% in the past year.  Think that’s good?  They rose almost 100% from the spring of 2009 to the spring of 2010, only to fall back again. 

Tight credit, rigid underwriting standards and a still frail consumer will present challenges to the housing market as it climbs slowly out of the doldrums of the past few years.

CPI and Wages

Dec. 24th, 2012

Merry Christmas, Everyone!

This is part two of a look at the CPI, comparing the price index to wage growth.  Part 1 is here

In the years 1947-1980, the average hourly earnings of production workers rose 6.08% annually while the CPI grew 4.03% (Source)  In effect, earnings rose 2% higher than prices.   Since 1980, earnings have risen 3.55% annually as the CPI rose 3.29%, giving workers a real growth rate of less that a 1/3rd of 1%.

The rise in worker productivity fueled gains in worker compensation until the past fifteen years.  Below is a chart of real, that is inflation-adjusted, compensation and productivity.

Increased Productivity means more profits.  For several decades in the post-WW2 economy, workers shared in those profits.  After the recession of 1982-1984, workers’ share of the increase in output slowly decreased.  As incomes barely kept up with inflation, workers tapped the equity in their houses.

Low interest rates, poor underwriting standards, lax regulations and a feeding frenzy by both home buyers and banks fueled a binge in home prices, followed by the hangover that started in 2007.  Only now is the housing market struggling up out of a torpor that has lasted for several years.

Before the housing bust, magical thinking led many to believe that the rise in home equity was a sure fire way to riches.  Over a century’s worth of data shows that housing prices tend to rise about the same as the CPI.  Housing prices have finally bottomed out at about the same level as the long term trend line of CPI growth.

The boom and bust upended the lives of a lot of people and the repercussions of that “hump” will continue as banks continue to foreclose on home owners whose incomes have flattened or declined. The recovery in the housing market will help some home owners but the real problem is unemployment, underemployment and the decreasing share of workers’ share of the profits from productivity gains.  Until the labor market heals, the housing market will not fully heal.

Those who do have savings have become cautious.  Since 2006, investors have taken $572 billion out of stocks and put $767 billion in bonds, a move to safety – or so many retail investors think.  For decades, home prices never fell – until they did.  For over thirty years, bond prices have been rising, giving many retail investors the feeling that bonds are safe – until they are not.

Companies have been selling record amounts of corporate bonds into this cheap – for companies – bond market.  As this three decade long upward trend in bond prices begins to turn, bond prices can fall sharply as investors turn from bonds to stocks and other investments.  We are approaching the lows of interest yields on corporate bonds not seen since WW2.  Investors are loaning companies money at record low rates and companies are sucking up all that they can while they can.  Sounds a lot like home buying in the middle of the last decade, doesn’t it?

Y’all be careful out there, ya hear?

Capital and Consumer Spending

If I hit my thumb with a hammer, maybe it won’t hurt this time.  Not likely.  Last week I noted a warning sign in non-defense new orders for capital goods, excluding aircraft.  As I noted previously, aircraft orders are volatile; they may be up 30% one month and down 30% a few months later because orders for planes are placed in rather large blocks with the actual delivery of the aircraft occurring over many months.

A few days ago the most recent durable goods report came out for September, showing a continued decline in the year-over-year gains for new orders.  Declines like this have preceded the past two recessions.

We like to think that this time may be different. Our imagination is capable of soaring the heights of creativity in art and science.  In the economics of our personal lives, it can lead to fanciful thinking.  Fanciful notions led many to buy houses with little money down at the height of the housing boom, thinking that somehow they would refinance when mortgage payments escalated after a certain period.  Magical thinking induced many to increase their credit balances far beyond their means to pay, thinking that they could pay down their credit balances by refinancing their homes.  No matter how much homes went up in value, housing prices would continue to rise.  Then they didn’t.

The chart below shows the housing inflation.  Recessions in the latter part of the past century had caused housing starts to decline to 400,000 before recovering.  In the 2001 recession, easy money and loose standards for mortgage securitization curbed the natural decline.  The bill eventually came due in 2008.

Single family homes create jobs; the market has shown life recently but is still very weak.

The Conference Board’s Consumer Confidence index rose 9 points to 70 in September and is about the same level as this past February, when confidence started sliding to a summer low point of 60.   The new consumer survey is due to be released next week and analysts are predicting another increase of 3 to 4 points. Consumers are feeling upbeat but the decline in new orders shows that businesses continue to be cautious as the prospect of rising taxes and budget cuts next year dampens any optimistic planning.  The slowdown in Europe and Asia contributes to the gloomy reading of Moody’s Business Confidence survey.  Rising consumer confidence before the critical Christmas shopping season may alleviate the pessimism of businesses if consumers actually open up their wallets and spend but retailers have not been building inventory ahead of the shopping season.

While these two forces tug at each other, a prudent investor might exercise some caution.

Debt Comparison

As this past quarter began in July, Greece’s debt was a concern but the countries of the EU were in negotiations to work it out.  QE2, the Federal Reserve’s program of bond buying, had just ended, prompting some to worry about a negative effect on the economy as that stimulus.   Early second quarter earnings reports in mid July were strong and the balance sheets of major companies showed that they had accumulated ample reserves of cash to weather any small downturns. Manufacturing was slumping a bit but that was attributed to supply chain disruptions from the March Japanese tsunami and was expected to grow again in the third quarter.  The moribund housing sector and stubbornly high unemployment remained a concern but the stock market is a pricing of future company earnings.  The companies in the S&P500 which have any foreign earnings receive the majority of their earnings from countries other than the U.S.  This global sales and revenue base makes these large U.S. companies less vulnerable to economic weakness in any one country.

Japan’s recovery in GDP in the second quarter surprised many, testifying to the resilience and industry of the Japanese people and Japanese industry.  China, Indonesia, India and Brazil were showing strong growth, perhaps a bit too much growth, as inflation in those countries and regions was prompting central banks to take steps to cool that growth.  Growth in the EU countries was a concern but German manufacturing was holding steady.

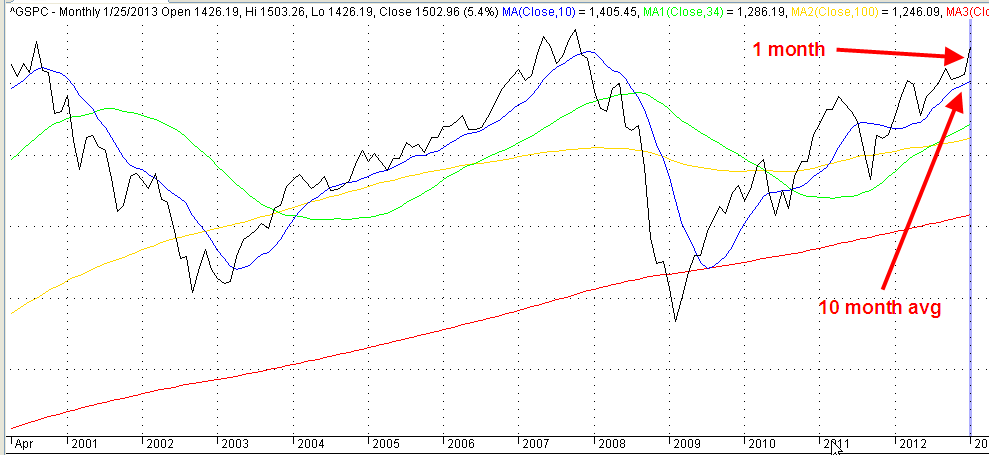
Toward the end of July, the EU reached an agreement to provide financing to Greece and, in the U.S., President Obama and House Speaker Boehner supposedly reached an agreement – dubbed the “grand bargain – for debt reduction.  On July 22nd, the S&P500 closed near 1350.  At the end of September, the S&P500 stood at 1130, a drop of 17%.  What happened?

The weekend after the “grand bargain” came news that there was no bargain.  During August, the American people stared in befuddlement at a dark comedy in which lawmakers and the President brought the country to the brink of default, prompting one rating agency to downgrade U.S. government debt. 

Computing the Gross Domestic Product (GDP) of an entire nation is a complex affair, one that requires an early estimate and two revisions. In the late days of July, the Bureau of Economic Analysis (BEA) revised the GDP growth for the 1st quarter of 2011 (ending in March) from a weak 1.9%  to an almost recessionary .4%.  This was a large revision and shook the markets, swiftly dropping the S&P500 index to about 1100. 

Germany reported strong manufacturing data for July but China showed a stalled growth in their manufacturing, adding to worries about a global slowdown.  Since early August, the market has behaved like a small boat in the Mid Atlantic, rising and falling dramatically with both news and worries about Greece’s debt as well as the debt of Italy, Spain, Ireland and Portugal.  Investors have fled from the stocks of banks holding the debt of those countries as well as larger banks which might have indirect exposure to that debt.  An index of large banks has fallen 28% since April of this year.  Many developed countries are wallowing in debt.  A slowdown in growth leads to less tax revenue to pay down that debt.  Worries of a global recession or a severe slowing of growth provoke fear of bank defaults, government defaults, and growing pressure on small and medium sized businesses, who are least able to withstand downturns in an economy.

Fractious meetings among EU member countries, among the various branches of the U.S. government leads many to regard politicians on both sides of Atlantic as dysfunctional, unable to resolve their ideological differences to make any functional policy decisions.  Investors worry about the viability and future of the euro currency, fleeing the Euro and parking their money in U.S. Treasuries, causing the price of Treasuries to rise and the yield (interest) on those bonds to fall to historically low levels.

In September, an HSBC index of small and medium Chinese manufacturers reported a slight contraction.  German manufacturing declined from strong numbers in July to a neutral stall speed in September, confirming fears of a global slowdown. 

In the U.S. and Eurozone, governments at all levels have instituted austerity measures to cope with declining tax revenues.  Government employee layoffs increase the demand for social support programs, prompt civilians to curb their spending, resulting in less tax revenues for government, prompting more government cuts, ad nauseum.  Cautious companies hoard what cash they have, reduce their investments in anticipation of further slowdowns in consumer demand.

Weighing on the economies of the U.S, Japan and Europe are a decades long accumulation of debt.  Below is a chart of OECD data on the total debt of developed countries.  Debt in the U.S. doesn’t look bad compared to some of these other countries. (Click to enlarge in separate tab)

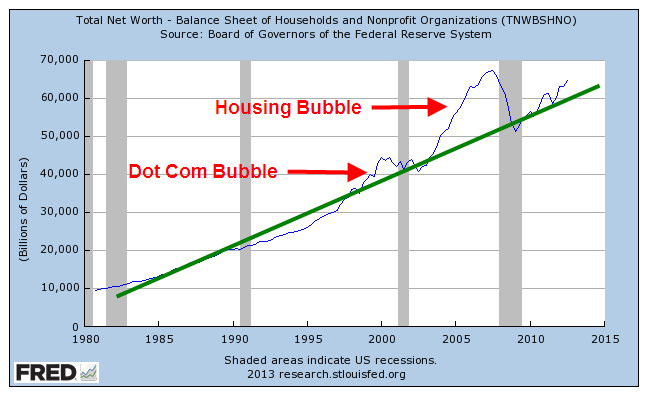
For the past thirty years, all of us in the U.S. have been running up debt.  People, companies and governments at the Federal, State and local levels have borrowed…and borrowed…and borrowed some more. 

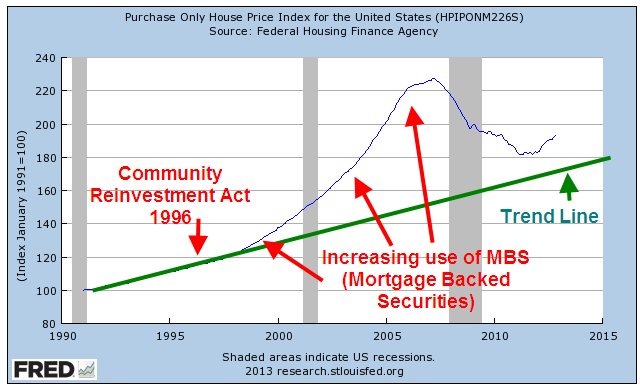
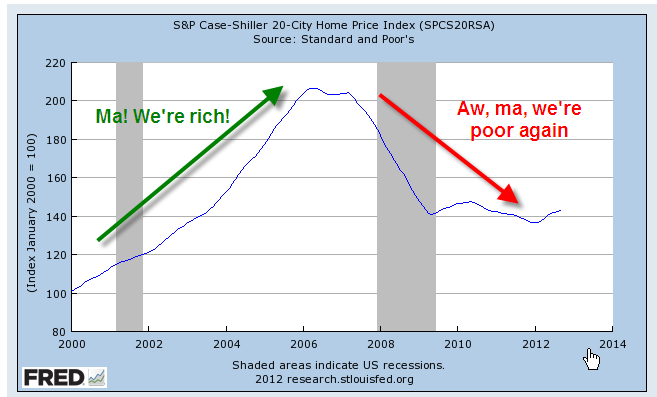
The severely slumping U.S. housing market is a strong headwind to any GDP growth.  Lower valuations lead to less property taxes for local governments and schools, reduced government services, houses that are difficult for homeowners to sell without bringing cash to the sale. A recent report by the Commerce Dept. showed that housing has contributed an average of 4.7% to GDP for the past half century.  Last year, housing contributed only 2.2% to GDP.  If the health of the housing sector was just average, GDP growth in this country would be 2.5% higher.   Some in the industry anticipate that it will be another five years for housing to recover from the excesses of the past decade.