Business Cycles

June 16th, 2013

The manufacturing sector accounts for less than 20% of the economy but is probably the major cause of business cycles in the economy.  In the 1990s, the growing development of technology and business services in the U.S., together with what was called “just in time” inventory management, led some economists to declare an end to the business cycle. Cue the loud guffaws.

May’s monthly report on industrial production released Friday showed no monthly gain, after a decline of .4% in April.  The year over year change in the index was just under 2%.  In a separate report from the Institute for Supply Management (ISM) released a week ago, the Manufacturing Purchasing Managers Index (PMI) index for May fell into contraction, its lowest reading since June 2009, when the recession was ending.


New Orders and Production components of this index saw sizeable decreases.  Computer and electronic businesses reported a slowdown that they attributed to the sequester spending cuts enacted a few months ago.

The latest data for non-defense capital goods excluding aircraft from the U.S. Dept of Commerce showed an uptick after a period of decline in the latter half of 2012; however, there is a month lag in this data set.


The sentiment among small businesses improved somewhat, as shown by the monthly National Federation of Independent Businesses (NFIB) survey.  The overall index of 94 indicates rather tepid expectations of growth by small business owners.  Plans for capital spending to expand business are still at recession levels.

A business builds inventory in anticipation of sales growth.  Since the beginning of this year the net number of small businesses expanding inventory has finally turned positive.

  In a 2003 paper, economist Rolando Pelaez tested an alternative model of the Purchasing Managers Index that would better predict business cycles, specifically the swings in GDP growth.  Assigning varying constant weights to several key components of the overall PMI index, his Constant Weighted Index (CWI) model is more responsive to changes in business conditions and expectations.  In early 2008, the PMI showed mild contraction but Pelaez’ CWI model began a nose dive. It would be many months before the National Bureau of Economic Research (NBER) would mark the start of a recession in December 2007 but the CWI had already given the indication.  In May of 2009, the CWI reversed course, crossing above the PMI to indicate the end of the contractionary phase of the recession.  It would be much later that the BEA would mark the recession’s end as June 2009.


The CWI index is rather erratic.  We lose a bit of its ability to lead the PMI when we smooth it with a three month moving average but the trend and turning points are more apparent in a graph.

Before the 2001 recession the CWI index led the PMI index down.

OK, great, you say but what does this have to do with my portfolio?  Smoothing introduces a small lag in the CWI but it is a leading, or sometimes co-incident indicator of where the stock market is headed over the next few months.

Let’s look at the last six years.  In December 2007, the smoothed CWI crossed below the PMI, which was at a neutral reading of about 50.  The stock market had faltered for a few months but as 2008 began, the CWI indicated just how weak the underlying economy was.  The NBER would eventually call the start of the recession in December 2007.  In June 2009, the CWI crossed back above the PMI.  Coincidentally, the NBER would later call this the end of the recession.

The period 2000 – 2004 was a seesaw of broken expectations, making it a difficult one to predict because it was, well, unpredictable.  I did not show this example first because this period is a difficult one for many indicators.  Before 9-11, we were already in a weak recession.  Although the official end was declared in November 2001, the effects were long lasting, a preview of what this last recession would be. In 2002, we seemed to be pulling out of the doldrums but the prospect of an Iraq invasion and a general climate of caution, if not fear, prompted concerns of a double dip recession.

An investor who bought and sold when the smoothed CWI crossed above or below 50 would have had some whipsaws but would have come out about even instead of losing 15% over the five year period.

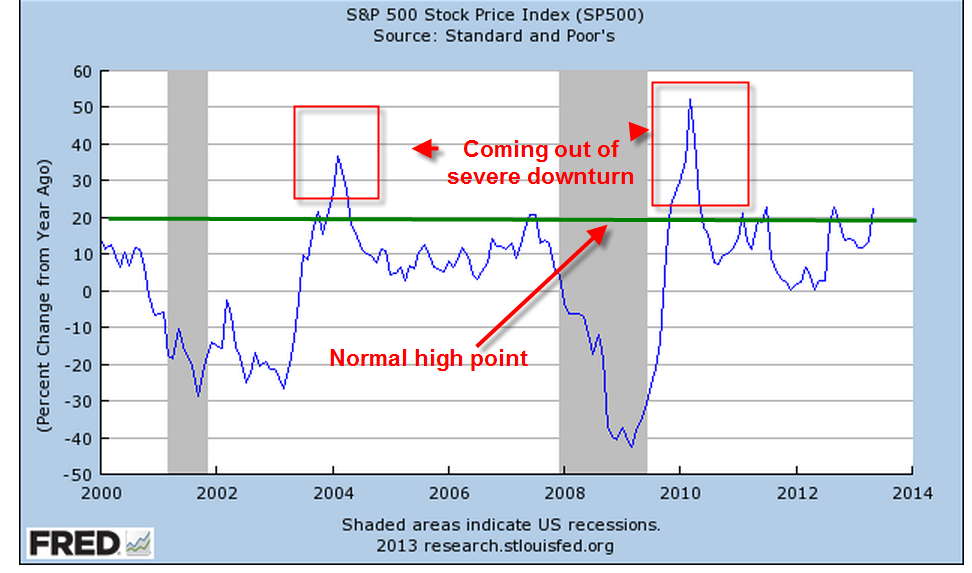
The present day reading of both the CWI and PMI are at the neutral reading of 50.  Given the rather lackluster growth of the manufacturing sector, the robust rise of the stock market since last November indicates just how much the market is riding on expectations and predications of the future decisions of the Federal Reserve regarding future bond purchases and interest rates. Over the past thirteen years, when the year over year percent change in the stock market hits about 22%, the percentage of growth in the index declines.

So what is a normal run of the mill investor to do?  The CWI, a predictor of business cycles, is not published anywhere that I could find. This and many other indicators are used by the whiz kids at investment firms, pension funds, by financial advisors and traders, to anticipate business conditions as well as the movements of the markets.  But look again at the SP500 chart above and remember that it is the composite of millions of geniuses and not so geniuses trying to anticipate the market.  As I have mentioned in previous blogs, when that percentage change drops below zero, it is time for the prudent investor to consider some portfolio adjustments.  Since 1980, the average year over year percent change in the SP500 is 9.7%, using a monthly average of the SP500 index. Despite the recent 20% gains, the average year over year percent gain during the past ten years is only 4.9%.  If we look back to the beginning of the year 2000, the average is only 3.1%.  Those rather meager gains look robust when compared to the NASDAQ index, which is still 25% below its January 2000 high.  Think of that – thirteen years and still 25% down. The Japanese market index, the Nikkei 225, is at the same level as it was in early 1985, almost thirty years ago.  Both of these examples remind us that we need to pay some  attention or pay someone to do it for us.

Things That Spring

April 14th, 2013

Across the land, springtime wakens the trees and flowers, birds chirp and squirrels chatter.  From the buildings where the humans live comes the wailing and gnashing of teeth as many procrastinators spend this last weekend before the tax deadline in a spring ritual of angst.  The lost W-2 form is finally found beneath the Netflix DVD that has lain casually on the bookcase, waiting to be watched.  The 1099DIV form is found beneath a birthday card that was never sent.

Lay aside your problems; let’s climb inside the hot air balloon and look at the big picture.  A few weeks ago, economic growth for the fourth quarter of 2012 was revised marginally higher into positive territory, but dropping from the annualized growth rate of 3.1% in the 3rd quarter of 2012.  Let’s look at GDP from a per person basis since WW2.  Until the recession hit in late 2007, economic growth had consistently outpaced population growth.  Then POOF! went the economy and blew away a big gap in GDP.

Let’s zoom in on the past ten years to see the effect.  On a per person basis, the gap is $5,000 of spending that simply didn’t get spent.

Call it the GDP dust bowl of the 2000s, similar to the dust bowl of the 1930s when the wind blew the top soil from the prairie of the Oklahoma panhandle and forced many families from their farms.  In this case, the wind blew away a lot of jobs and chunks of home equity.

Policy makers in Washington want to close that $5000 per person gap.  If they could write a law forcing everyone to spend that $5000, they would.  Instead, they keep giving away money in unemployment benefits, food stamps, disability benefits, crop subsidies – all to keep people from not spending even less and making the problem worse.

Retail sales account for about 1/3rd of the total economy.  Including automobile sales and parts, consumers are still below twenty year averages.

This past Friday, the monthly report on retail sales showed little change from the past month.  When we look at per person real retail and food sales and take out automotive sales we get a feel for core sales, those that we make on a frequent basis.  Once again, we see the same gap that we saw in GDP.  Since mid-2009, this core consumer spending has grown 2.3% annually, above the 1.8% annual growth trend from 1992 through 2006, but it still down $2000 a year from what we would have spent if we had stayed on the same trend line before this past recession hit.

To make it a bit clearer, let’s look again at that chart and compare the 15 year annual growth rate from 1992 to the longer 21 year growth rate.  It has fallen from 1.8% to 1.1% annual growth.

GDP measures spending; let’s look at Gross Domestic Income, or GDI.  A fundamental principles of economics is that it takes money to spend money.  A six year old asks a parent “Why can’t we just go out and get more money?” to which the parent replies “Whaddya think money grows on trees?!”  End of Chapter One in the Parent’s Guide to Economics.

When we compare the country’s income to spending, we find that a dip in income below production precedes recessions.

After the 2008 – 2009 crash and recovery in national income and spending, both are limping along.

A few weeks ago came the monthly New Orders, an indication of business confidence.  As regular readers know, I have been watching this declining trend since September of last year, when the percent change in New Orders was negative.  The recent rise has been a welcome sign of growing confidence but new orders fell 2.7% in February and now hover around the zero growth line. 

On a quarterly basis, the year over year (y-o-y) percent change is still firmly in negative territory, meaning that businesses are not putting up more money to invest in new equipment.  Why?  Because they are still not sure about consumer spending. The six month run up in the SP500 stock index might lead a casual observer to think that the economy and companies are gearing up.  New Orders indicates that there is much more caution out there than the stock index would indicate.

This past Friday, business’ caution to commit to new investment was only reinforced when the latest Consumer Sentiment index was released.  After climbing the past few months, confidence is sinking again.  Maybe it’s the extra 2% coming out of paychecks since January 1st.  Whatever it is, it doesn’t inspire many business owners to put a lot of money into expanding their production.

When the stock market is trading on hope, it looks six months ahead.  The recent run up is hoping for double digit profit growth in the second half of this year.  When the market trades on fear, it looks ahead about 2 seconds, faster than the normal investor can or should react.  Let me get out my broken record for another spin, cue the needle and play that same old song “Diversify.”

P.S. For those of you who are more active investors, check the latest post from Economic Pic in my blog link list on the right.  It shows the past 40 year returns for a strategy of selling the SP500 index in May and buying the long term government / credit index.  The iShares ETF that tracks this index is ITLB.  A comparable ETF from Vanguard is BLV.

Production Doldrums

On April 15th, the Federal Reserve released its March data on industrial production. “The capacity utilization rate for total industry fell further to 69.3 percent, a historical low”

In a 4/15/09 WSJ “Ahead of the Tape” column, Mark Gongloff notes a Congressional Budget Office estimate that “GDP growth could be 7% below potential for the next two years” and that it is “the deepest underperformance since the 1981-82 recession.” The investment firm Goldman Sachs estimates that “getting GDP back to trend will require unusually fast catch-up growth – 4.75% per year in order to close the output gap by 2015, or 3.75% per year to close it in a decade.”

Gongloff concluded with a comment from Goldman Sachs that “such speedy growth closed the wide output gap of the early 1980s … and it didn’t create inflation.”