Employment Curves

January 15, 2023

by Stephen Stofka

For millennia people have claimed a power of divination by various methods, including the casting of bird bones on the ground, the magic of numbers or certain word incantations. As the New Year begins, there is no shortage of predictions for 2023. Will the Fed taper its rate increases now that inflation has moderated? Will the U.S. go into a recession? Will falling home prices invite a financial crisis like the one in 2007-9? Will bond prices recover this year? Other animals see only a few moments into the future. We have developed forecasting tools that try to time-travel weeks and months into the future, but we should not judge a tool’s accuracy by its sophistication.

Statistics is a series of methods that constructs a formula explaining a relationship between variables. Each data point requires a calculation, a tedious task for human beings but a quick operation by a computer. Before the introduction of the computer in the mid-20th century, investors used simpler tools like the comparison of two moving averages of a time series like stock prices. These simple tools are still in use today. An example is the MACD(12,26) trend that compares the 12-day and 26-day moving averages, noting those points where the short 12-day average crosses the long 26-day average (Stockcharts.com, 2023). We can apply a similar technique to the unemployment rate.

In the chart below I have graphed the 3-month and 3-year moving averages of the headline U-3 unemployment rate. The left side of each column faintly marked in gray marks the beginning of a recession has noted by the NBER (2023). These beginnings roughly coincide with the crossing of the 3-month (orange) above the 3-year (blue) average. With the exception of the 1990 recession, the end of the recessions is near the peak of the 3-month orange line, after which unemployment declines. Today’s 3-month average is well below the 3-year trend, making a recession less likely. However, except for the pandemic surge of unemployment, the 3-month average is quite low and has been below the 3-year average for the longest period in history.

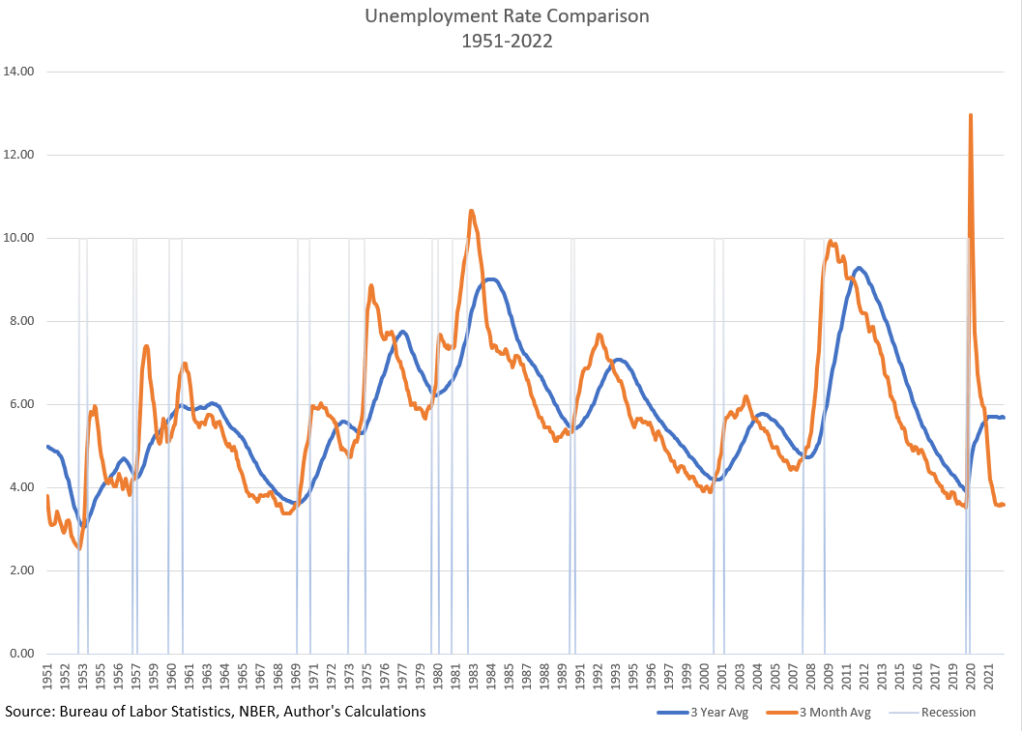
I did not do any laborious trial and error of various averages to find a fit. I chose these periods because they fit my story, something I wrote about last week. A 3-year average should provide a stable long term trend line of unemployment. A 3-month average should reflect current conditions with some of the data noise removed. The crossing should capture an inflection point in the data.

The low unemployment rate implies that workers have more wage bargaining power but wage increases have lagged inflation, robbing workers of purchasing power. If inflation continues to decline in 2023, some economists predict that wage increases may finally “catch up” and surpass the inflation rate.

There are two trends that have weakened the wage bargaining power of workers. Since World War 2, an economy dominated by manufacturing has transitioned to a service economy with lower average wages. In that time, the percent of workers employed in agriculture fell from 14% to less than 2% as production and harvesting became more mechanized. The labor market has undergone structural changes that may invalidate or weaken the lessons of earlier decades.

Since WW2, self-employment has declined. Half of those employed now work for large companies with 500 or more employees (Poschke 2019, 2). Few are unionized and able to bargain collectively for wages. According to the Trade Union Dataset (2023), most European countries enjoy much higher trade union participation than in the U.S. where only 10% of workers belong to a union. Large American companies enjoy a wage-setting power that smaller companies do not have and this enables them to resist wage demands. American workers do not have enough wage bargaining power to make a significant contribution to rising prices. Stock owners, able to move money at the stroke of a computer key, hold more bargaining power.

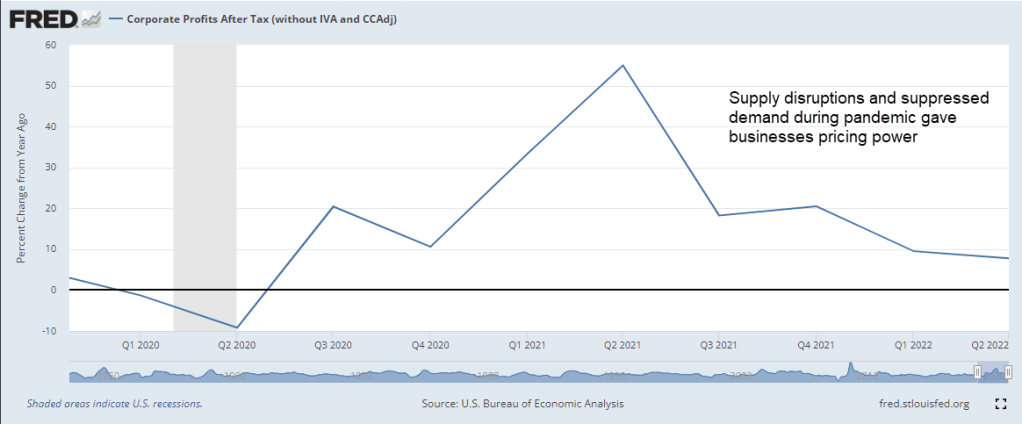
To keep their stock prices competitive, publicly traded companies must maintain a profit margin appropriate to their industry. Investors will punish those companies who do not meet consensus expectations. Company executives rarely take responsibility for falling profit margins. Instead, they blame rising wages or material costs, shifting consumer tastes or government regulations. Interest groups like the U.S. Chamber of Commerce, a private lobbying organization funded by the largest companies in America, champion a narrative that inflation is the result of rising wages, not rising profit margins. Like any interest group, their job is to assign responsibility for a problem to someone else, to convince lawmakers to act favorably to their cause or industry. The Chamber has far better funding than advocates for labor and it uses those funds to block policies that might favor workers.

There are economists and policymakers who still believe in the Phillips Curve, a hypothetical inverse relationship between unemployment and inflation. High unemployment should coincide with low inflation and high inflation with low unemployment. Shortly after Bill Phillips published his data and hypothetical curve, Guy Routh (1959), a British economist, published a critique in the same journal Economica, pointing out the flaws in Phillips’ methodology. The chief flaw was Phillips’ lack of knowledge about the labor market itself. Despite that, American economists like Paul Samuelson, who favored an activist fiscal policy, liked the implications of a Phillips Curve. Policy makers could fine tune an economy the way a car mechanic tuned a carburetor.

In the past year, some economists and policymakers have advocated policies to drive unemployment higher and wring inflation out of the economy. Despite rising interest rates, the labor market has been strong and resilient. In January 2020, Kristie Engemann (2020), a coordinator at the St. Louis Fed, explored the debate about whether this relationship exists or not. For the past five decades, the “curve” has been flat, a statistical indication that there is no relationship between inflation and unemployment. Policymakers will continue to cite the Phillips Curve because it serves an ideological and political purpose.

We don’t need statistical software to debunk the Phillips curve. In the chart I posted earlier, there were several points where the 3-month average unemployment rate was near or below 4%. These were in the late 1960s, the late 1990s, and the late 2010s. The inflation rate was 3%, 2.5%, and 1.4% respectively. If the Phillips Curve relationship existed, inflation would have been much higher.

As our analytical tools become more sophisticated we risk being fooled by their power. With a few lines of code, researchers can turn the knobs of their statistical software machines until they reach a result that is publishable. We should be able to approximate if not confirm our hypothesis with simpler tools.  

///////////////////

Photo by Augustine Wong on Unsplash

Engemann, K. M. (2020, January 14). What is the Phillips curve (and why has it flattened)? Saint Louis Fed Eagle. Retrieved January 13, 2023, from https://www.stlouisfed.org/open-vault/2020/january/what-is-phillips-curve-why-flattened

National Bureau of Economic Research. (2022). Business cycle dating. NBER. Retrieved January 13, 2023, from https://www.nber.org/research/business-cycle-dating

Poschke, M. (2019). Wage employment, unemployment and self-employment across countries. SSRN Electronic Journal, (IZA No. 12367). https://doi.org/10.2139/ssrn.3401135

Routh, G. (1959). The relation between unemployment and the rate of change of money wage rates: A comment. Economica, 26(104), 299–315. https://doi.org/10.2307/2550867

Stockcharts.com. (2023). Spy – SPDR S&P 500 ETF. StockCharts.com. Retrieved January 13, 2023, from https://stockcharts.com/h-sc/ui?s=spy  Below the price chart is the MACD indicator pane.

Trade Union Dataset. OECD.Stat. (2023, January 13). Retrieved January 13, 2023, from https://stats.oecd.org/Index.aspx?DataSetCode=TUD

U.S. Bureau of Labor Statistics, Employment Level [CE16OV], retrieved from FRED, Federal Reserve Bank of St. Louis; https://fred.stlouisfed.org/series/CE16OV, January 11, 2023.

U.S. Bureau of Labor Statistics, Employment Level – Agriculture and Related Industries [LNS12034560], retrieved from FRED, Federal Reserve Bank of St. Louis; https://fred.stlouisfed.org/series/LNS12034560, January 11, 2023.

////////////////////

The Misery Index

December 18, 2022

By Stephen Stofka

This week’s letter is about a measure of economic discomfort that economist Arthur Okun developed in the 1960s. In the early 1980s President Reagan renamed it the “misery index.” Weather forecasters calculate a misery index of temperature and humidity. Okun’s measure of discomfort added the inflation rate and the unemployment rate. How reliable is this weathervane of human misery? Let’s focus on those points where the index touched a medium term low.

We can begin in the mid-60s as society began to rupture. Young people protested the restrictive norms of the post-war society when employers regarded a man whose hair was longer than “collar length” as unkempt. Polite women wore white gloves to church and formal affairs. In northern cities black people rioted over the prejudice that prevented them from access to business loans in their own neighborhoods. By law, federal home loans were not available to people who lived in “redlined” majority black neighborhoods. The courts and Indian agencies disregarded the property and civil rights of Native American families. There was a lot of misery that was not measured by the misery index.

The late 1990s – another relative low in the misery index – were a heady time. The internet and Windows 95 was but a few years old and investors were exuberant about the “new internet economy.” Fed chairman Alan Greenspan warned of “irrational exuberance” and economist Robert Shiller (2015) wrote a book of that same name, introducing his cyclically adjusted price earnings, or CAPE, ratio. Investors based their valuations on revenues, not profits. In a rush to dominate a market space, companies spent more to acquire a new customer than the revenue the customer brought in. Investors rejected “old economy” manufacturing companies like Ford and GE and turned to the new economy stocks like  Microsoft, Sun Microsystems, CompuServe, AOL and Netscape, companies that connected computers and people. Neither Google nor Facebook existed. Amazon was a company that sold books online. Pets.com raised $83 million at its IPO on the promise of convenient pet food delivery. In the summer of 2000, the air started leaking from the “dot-com” bubble. By the spring of 2003, the SP500 was down 42% from its high. None of that investor misery was captured by the misery index.

The index touched another low in early 2007, a year before the beginning of the 2007-09 recession and the Great Financial Crisis. This time investors were exuberant over both housing and stocks. The top bond ratings companies, like Moody’s and S&P, dependent on the fees they collected from Wall Street firms, slapped Grade AAA stickers on the subprime mortgage backed securities their customers wanted to underwrite. Financial companies played regulatory agencies against each other, choosing the one with the most relaxed standards and supervision. Whiz kids in the back rooms of major financial firms developed trading models that blew up within a few years. Some of the largest companies in the world, champions of the free market who consistently fought regulations, ran to the government with their hands out, pleading for bailouts.  In the 3rd quarter of 2008, Lehman Brothers collapsed and threatened to take down the rest of the financial system. The misery index rose to 11.25%, slightly below our current reading of 11.88%. If the misery index were a tape measure, a carpenter would throw it in the garbage as an unreliable tool.

The collapse of oil prices in 2014 shifted the misery index to another low in 2015. After a decade of near zero interest rates, housing and stock prices had again reached nosebleed levels and the index dropped to another low in late 2019. Was that a harbinger of a coming financial crisis? We never did find out. Within six months, the pandemic crisis struck.  

The misery index is an unreliable measure of discomfort but a good measure of investor exuberance. Medium term lows are an indicator that investor optimism and asset valuations are too high. Relative index highs like the current 12% mark a period of excess investor pessimism. Sometimes a lousy tape measure can be useful after all.

///////////////////////////

Photo by patricia serna on Unsplash

Shiller, R. J. (2015). Irrational Exuberance: Revised and Expanded Third Edition. Princeton University Press.

//////////////////////////

The Change Changed

November 13, 2022

by Stephen Stofka

October’s CPI report released this week indicated an annual inflation of 7.7%, down from the previous month. Investors took that as a sign that the economy is responding to higher interest rates. In the hope that the Fed can ease up on future rate increases, the market jumped 5.5% on Thursday. Last week I wrote about the change in the inflation rate. This week I’ll look at periods when the inflation rate of several key items abruptly reverses.

Food and energy purchases are fairly resistant to price changes. Economists at the Bureau of Labor Statistics (BLS) construct a separate “core” CPI index that includes only those spending categories that do respond to changing prices. It is odd that a core price index should exclude two categories, food and energy, that are core items of household budgets.

Ed Bennion and other researchers (2022) at the BLS just published an analysis of inflationary trends over several decades. Below is a chart of the annual change in energy prices. Except for the 1973-74 oil shock, a large change in energy prices led to a recession which caused a big negative change in energy prices.

We spend less of our income on food than we did decades ago so higher food prices have a more gradual effect, squeezing budgets tight. Lower income families really feel the bite because they spend a higher proportion of their income on food. In the graph below a series of high food price inflation often precedes a recession. Unlike energy prices, there is rarely a fall in food prices. Following the 2008 financial crisis, food prices fell ½% in 2009. It is an indication of the economic shock of that time.

Let me put up a chart of the headline CPI (blue line) that includes food and energy and the core inflation index (red line) which does not. Just once in 75 years, during the high inflation of the 1970s, the two indexes closely matched each other. Following the 1982-83 recession, the core CPI has outrun the headline CPI.

A big component of both measures of inflation is housing. The Federal Reserve (2022) publishes a series of home listing prices calculated per square foot using Realtor.com data. You can click on the name of a city and see its graph of square foot prices for the past year. You can select several cities, then click the “Add to Graph” button below the page title and FRED will load the graph for you. Here’s a comparison of Denver and Portland. They have similar costs.

The pandemic touched off a sharp rise in house prices in both cities. Denver residents have attributed the big change to an influx of people from other areas. However, Census Bureau data shows that the Denver metro area lost a few thousand people from July 2020 to July 2021 (Denver Gazette, 2022). In the decade after the financial crisis, there simply wasn’t enough housing built for the adults that were already here.

The surge in home buying has not been in population but in demographics. As people approach the age of 30, they become more interested in and capable of buying a home. The pandemic helped boost home buying because interest rates plunged from 5% in 2018 to 2.6% in 2021.

Record low interest rates enabled Millennials in their 20s and 30s to buy a lot more home with their mortgage payment. That leverage caused housing prices to rise. A 30-year mortgage of $320K has a monthly mortgage payment of $1349 at 3%. At 5%, it is $1718 and at 7% it rises to $2129. Ouch!

Rising rental costs and home prices drive lower income families to less expensive areas in a metro area or entirely out of an area. Declining public school enrollment has forced two Denver area counties to announce the closing of 26 schools and transfer them to other schools (Seaman, 2022). As the number of students decreases, the schools infrastructure costs do not change, increasing the per student costs. Buses have to be maintained, drivers paid, schools staffed with guards, cafeteria staff, janitors and administrative personnel. Once schools are shuttered, the building may be sold and converted to other uses, either residential or commercial. The public schooling system is like a large ship that takes some time to change course.

During our lifetimes we experience many changes. They can happen quickly or emerge over time. The effects may be short lived or last decades. Families are still living with the consequences of the financial crisis fourteen years ago. Carelessly planned urban development isolates the residents of a community. The social and economic effects can last several generations. As we grow older, we learn to appreciate William Faulkner’s line, “The past is never dead. It’s not even past.”

/////////////////////

Photo by Davies Designs Studio on Unsplash

Bennion, E., Bergqvist, T., Camp, K. M., Kowal, J., & Mead, D. (2022, October). Why inflation matters. U.S. Bureau of Labor Statistics. Retrieved November 11, 2022, from https://www.bls.gov/opub/btn/volume-11/exploring-price-increases-in-2021-and-previous-periods-of-inflation.htm

Denver Gazette. (2022, March 25). Denver joins big city trend with pandemic population slip. Denver Gazette. Retrieved November 11, 2022, from https://denvergazette.com/news/local/denver-joins-big-city-trend-with-pandemic-population-slip/article_65c6393d-2a4d-5b91-837c-f8c3efce3778.html

Federal Reserve. (2022). Median listing price per square feet:Metropolitan Areas. FRED. Retrieved November 11, 2022, from https://fred.stlouisfed.org/release/tables?eid=1138280&rid=462

Seaman, J. (2022, November 10). Schools targeted for closure in Denver, Jeffco have disproportionately high numbers of students of color, data shows. The Denver Post. Retrieved November 11, 2022, from https://www.denverpost.com/2022/11/10/dps-jeffco-school-closures-students-of-color/

////////////////////

Economic Puzzles

November 6, 2022

by Stephen Stofka

Many people compare today’s inflation with that of the 1970s. A better comparison might be with a much earlier period. This week’s letter will be about the change in the inflation rate. Inflation is like the speed on a speedometer. If I accelerated from 50 to 60 MPH over a certain time period, perhaps 10 seconds, the change in the speed is 10 MPH. The time period I’m looking at is one year. If inflation rose from 1% to 5% in a year’s time then the change is 4%.

I’ll start with the current year. The one year change peaked at 6.1% in the first quarter of 2022. As the Fed raised rates, that change moderated. It’s like accelerating to 60 MPH and realizing that the speed is over the speed limit and reducing speed by easing up on the gas pedal or braking.  

Most of the time the inflation rate changes by less than 2% up or down. During and after recessions it can become more volatile. In 1980, inflation soared above 14% and the one year change peaked at 5.8%, slightly less than our recent experience.

There has only been one time in the past 70 years when the inflation rate rose faster than today. That was in 1951, shortly after the Korean War began. For the first six months of 1950, prices sank – deflation – then war was declared in June 1950 and the U.S. again ramped up defense production. The one year change in inflation peaked above 10% as Federal defense spending shot up 45%.

If you would like to explore this period in more detail Tim McMahon (2014) presents 1950s inflation data in an easy to read format. A hundred years ago, a period of persistent deflation – not inflation – followed the last pandemic.  See Tim’s second link below. The Federal Reserve was still fairly new and the U.S. and European nations had adopted a gold standard that would eventually lead to the Great Depression. That’s another story. Today the world’s commerce is interlocked and pandemic shutdowns continue to deliver a series of supply shocks. Getting policy right is more difficult when circumstances are this unusual.

Volatile Inventories

Inflation rises when there are inadequate resources to meet demand. In 2021, real private gross domestic investment rebounded quickly, rising almost 32% on an annualized basis in the 4th quarter. One component, inventories, was responsible for much of that surge. Even under normal conditions, this series is a volatile component of GDP (BEA, 2019) and the BEA publishes a figure called Final Sales of Domestic Product which excludes the change in inventories. Real final sales is approximately close to inflation-adjusted GDP.

During the pandemic manufacturing and retail goods sat in container ships off the port of Los Angeles and other ports. While the goods were in transit, they were not added to inventories. In the 2nd quarter of 2021, businesses began to open again but the ports were slow to unravel their logjams. Empty truck containers sat in parking lots and on neighborhood streets near the L.A. port while ships waited in line out on the water.

Sales surged as economy reopened

In the 2nd quarter of 2021, real final sales increased 2%, finally reaching pre-pandemic levels. In the first half of the year, real food and service sales shot up 10%. Normally that increase would occur over three years. However, within months that initial surge subsided. Over the next two quarters, real final sales barely increased. Real food sales declined slightly. This confirmed a temporary response to a post-pandemic recovery. With so many items out of stock, customers were willing to pay higher prices to get products. Some businesses had orders shipped from Asia by air. In the 4th quarter 2021, the floodgates opened and real private inventories rose by a record $197 billion.

Profits Surge

Real retail and food services sales fell slightly. In the last six months of 2021 inflation topped 5% but people were not buying and selling more stuff. Where were the price pressures? During the inflationary second half of the 1970s, profits increased a whopping 12% per year in those five years. In 2021, corporate profits rocketed up. Supply disruptions and repressed demand during the pandemic gave businesses pricing power. In 2021, corporate profits increased 18%. If demand was relatively flat, that pricing power had to fade but profit growth was still strong in the first quarter. Like the 1970s, rising corporate profits and pricing power were major contributors to inflation. This week the House Committee on Oversight and Reform (2022) came to a similar conclusion. What is the source of that pricing power?

War in Ukraine

In February 2022, Russia attacked Ukraine, sending energy prices higher. XLE, a broad energy ETF, gained 35% by early March. Two months later, the BEA reported another record rise in real private inventories of $214 billion. However, real final sales fell 2.5%. Some economists pointed to low unemployment and rising wages but ECI wages of private workers were on the same trend as before the pandemic when inflation was low. Most of the rise in the inflation rate was in housing, food and energy prices. The pandemic and low interest rates had contributed to the rise in housing costs. The war in Ukraine was responsible for volatile energy prices. There was no increase in real food sales but food prices were rising. Four large meat producers had profit growth of 134%, the committee reported.

The Puzzle

Historians still argue about the causes of World War I a century ago. Economists still cannot agree on the inflation mechanism of the 1970s. Contributing causes were rising corporate profits, shifting demographics in the work force, oil supply shocks, a shift in the international monetary regime and an evolving trans-global economy in the post war era. Economists do agree that it was a gestalt of market, fiscal and monetary forces, complicated by geopolitical and policy shocks that shaped expectations of future inflation. When people expect further price increases, they buy more now, aggravating inflationary pressures. Those expectations helped entrench inflation in the economy of the 1970s. Paul Volcker, chairman of the Fed in the late 1970s and early 1980s, raised interest rates so high that it wrung inflation out of the economy but at great economic cost to many families. The high interest rates caused two recessions, one of them the worst since the Great Depression.

The Korean War

In answer to the surge of inflation in 1951, the Fed raised rates slightly but rates stayed below 2%. The government did the heavy lifting. In September 1951, President Truman started a regime of wage and price controls administered by the Economic Stabilization Agency (ESA) and Wage Stabilization Board (WSB). There were loud protests against the controls and President Eisenhower ended them after he took office in 1953. Several months later the Korean War ended. In 1971, President Nixon instituted wage and price controls and demonstrated the failure of controls. Monetary policy is the weapon of choice to combat inflation but rising rates disproportionately affect the most vulnerable workers.

Conclusion

Infrequent events are an intersection of many factors that make each one unique. As economists pull apart the tangle of causal narratives, they develop new theories or modify existing ones. Economists usually cling to a favorite – either supply or demand. I’m watching profit growth. If Republicans take the House and possibly the Senate in the coming election, they will try to further enhance corporate profits at the expense of social programs like Medicare and Social Security. Republicans continue to sell a “trickle down” narrative but decades of evidence shows that the trickle is but a few drops. What goes to the top stays at the top.

///////////////////

Photo by Ana Municio on Unsplash

BEA: Bureau of Economic Analysis. (2019). Chapter 7: Change in private inventories. Retrieved November 4, 2022, from https://www.bea.gov/resources/methodologies/nipa-handbook/pdf/chapter-07.pdf

The House Committee on Oversight and Reform. (2022, November 4). Subcommittee analysis reveals excessive corporate price hikes have hurt consumers and fueled inflation, while enriching certain companies. House Committee on Oversight and Reform. Retrieved November 5, 2022, from https://oversight.house.gov/news/press-releases/subcommittee-analysis-reveals-excessive-corporate-price-hikes-have-hurt

McMahon, T. (2014, April 23). Inflation and CPI consumer price index 1950-1959. InflationData.com. Retrieved November 3, 2022, from https://inflationdata.com/articles/inflation-cpi-consumer-price-index-1950-1959/. Inflation data for 1920-1929 is here https://inflationdata.com/articles/inflation-consumer-price-index-decade-commentary/inflation-cpi-consumer-price-index-1920-1929/

A Global Wave

October 16, 2022

by Stephen Stofka

On Thursday, September’s CPI came out, showing an annual price increase of 8.2%. A quarter of that increase was housing costs – rent and owner equivalent rent. Price increases have decelerated this quarter. Remember that inflation is the change in prices. Acceleration (+) or deceleration (-) is the change of that change. Inflation is like the speed in a car. Acceleration is the change in speed. The graph below shows the acceleration for the past five years.

Notice the regular up and down in small increments before the pandemic. When we drive down the highway without cruise control, we experience the same minor variations in speed. After the pandemic, price acceleration became more erratic. Why?

Usually, we do not synchronize our spending and saving. During the pandemic in 2020, we began to coordinate our buying habits. The first round of stimulus checks went out in April 2020, shortly after the economy was locked down. We bought workout equipment, computers and peripherals, appliances for the home. The second round of stimulus went out in December 2020 and January 2021. President Biden was sworn into office in January 2021 and immediately began discussions of a third stimulus payment, part of the American Rescue Plan.

Critics say the third stimulus payment was too much, that it was the impetus to the recent inflationary surge. That is an ex-post or hindsight criticism. On December 18, 2020, Moderna was granted emergency approval by the FDA (2020) for its MRNA vaccine, a relatively new vaccine manufacturing technology. The Pfizer vaccine was the first to get such approval but its vaccine required a temperature of -94F. Moderna’s vaccine required a temperature of only -4F, about the same level as the freezer temperature in a home refrigerator. The vaccine was deemed safe but the drug makers did not know how long the vaccines would last. Secondly, they needed a booster shot as well. Moderna promised 100 million doses by March of 2021. What if the vaccines lasted only a few months and development of a better formulation was delayed another year? The third stimulus would have been entirely appropriate. Policymakers must make ex-ante decisions – before all the evidence is known or evaluated.

In 2021, some economists predicted higher inflation in 2022. They turned out to be right. Ten years ago, those same economists predicted higher inflation after the 2009 ARRA stimulus. They were wrong. Economists, like traders, are right sometimes and wrong sometimes. Like traders, the winning prediction rate is closer to 50-50 or pure chance. Others are likening this to the inflation of the 1970s. However, there is a big difference. In the 1970s, price acceleration kept rising like a car which is speeding up. Currently it is falling, like a car slowing down. Here’s a look price acceleration in the 1970s.

As I mentioned last week the Social Security Administration announces the yearly COLA for Social Security recipients after the September CPI figure is reported. The 2023 COLA adjustment will be 8.7%, adding $146 to the average $1673 monthly payment for retirees. As I discussed last week, worker’s wages have not kept up with inflation. They are more on a fixed income than retirees at this point.

The inflation is global – a first in economic history. Global market research company Ipsos (2022) survey people in 29 countries. Inflation has become the top concern for 40% of respondents. Here’s the chart I downloaded from their page. Look at the surge in inflation as a concern over the past year. Unemployment and Covid-19 were the top concerns in 2020. Stimulus assistance and monetary policy in the Eurozone countries helped relieve job concerns. Covid-19 became less worrying as more people got vaccinated and hospital admissions decreased. After Russia’s invasion of Ukraine, rising oil prices lifted inflation worries in many countries.

As the world becomes more integrated financially and economically, will we reach a self-destructive resonance? Our economic systems could become less stable as they synchronize. I hope not.

////////////////

Photo by Providence Doucet on Unsplash

FDA. (2020, December 18). FDA takes additional action in fight against COVID-19 by issuing emergency use authorization for second COVID-19 vaccine. U.S. Food and Drug Administration. Retrieved October 15, 2022, from https://www.fda.gov/news-events/press-announcements/fda-takes-additional-action-fight-against-covid-19-issuing-emergency-use-authorization-second-covid

Ipsos. (2022, September 22). What worries the world – September 2022 . Ipsos. Retrieved October 14, 2022, from https://www.ipsos.com/en-uk/what-worries-world-september-2022

The Old, Young and Middle

October 9, 2022

by Stephen Stofka

This week I’ll compare inflation-adjusted or real spending on Social Security and K-12 education with wage growth. I was surprised to learn that the number of people in both programs are the same. I’ll begin with Friday’s employment report because the market’s reaction to it indicates the erratic – but rational – thinking that higher inflation can trigger. Job gains of 263,000 were in line with expectations, but the unemployment rate went down by .1% because people stopped looking for jobs. Three years ago a .1% move would be discarded as a survey error. The unemployment rate is derived from a survey of households, not businesses, and often exaggerates any move up or down. In today’s volatile market, traders are skittish, employing algorithms that don’t care about the extent of a move, only whether it is up or down. Short term options trading leverages both money and time and they are now almost half of the options market. A minus sign might trigger a sell, a plus sign a buy. The number after that plus or minus is less important. A trader might have taken a position forecasting a slight uptick in the unemployment rate. No increase or a decrease = sell and minimize losses. This is reactive trading, not economic evaluation.

This week’s ADP report of private job gains showed a decline of 7,000. Averaged together job gains were only 116,000 in September and has shown a distinct downward response to the Fed’s raising of interest rates. The historical average of the two surveys has been the more accurate after revisions. More disappointing for workers is that wage growth has been more than 3% below the inflation rate.

While workers’ wages are not keeping up with inflation, social security recipients will likely get a COLA (cost-of-living-adjustment) raise of about 8.6% this year. By law, the COLA calculation compares this year’s average third quarter CPI to last year’s third quarter average. September’s CPI report will be released Thursday, October 13th, finalizing this year’s 3rd quarter and the final adjustment percentage. It will be the largest increase since 1981’s adjustment of 11.3%, according to the Social Security Administration (2022).

An eternal theme in the Republican platform is the privatization of Social Security before it goes broke. A few weeks before the election, some Republicans will undoubtedly use the COLA adjustment to call for Social Security privatization. They will claim that higher payments will inevitably lead to the insolvency of the fund. Retirees will get partial payments or no payments.

Former House Speaker and Republican Vice-Presidential candidate, Paul Ryan once asked Alan Greenspan, then Chairman of the Fed and a fellow conservative, a leading question meant to demonstrate the insolvency of Social Security. Wouldn’t personal retirement accounts (privatized Social Security accounts) make the retirement system more financially secure? In his dry tone, Greenspan answered that “there is nothing to prevent the Federal Government from creating as much money as it wants and paying it to somebody” (C-Span, 2005). Ryan, a champion of privatization, was disappointed in the answer.

Why then do we have the trust funds? The Social Security system is “Pay-Go.” The taxes of current workers pay for the benefits to retired workers. When the program was created almost 90 years ago, President Roosevelt (FDR) thought that Republicans – and some conservative southern Democrats – would be more hesitant to cancel the program if funds were – on paper at least – dedicated to the program and called “insurance.” Republicans challenged the program up to the Supreme Court on the basis that the Federal government had no Constitutional right to force people to pay into a retirement program. The Court ruled that, even if the program was called “insurance,” it was a tax and the government had the right to tax incomes. Read the 16th Amendment. The unfairness in the system was that the first generation of recipients paid little into the system for the benefits they received when they retired. Today, the average retiree receives $1673 a month, or $20K per year (SSA, 2022). Let’s compare that to spending on K-12 education.

The U.S. has about the same number of K-12 students as it does retirees who are collecting Social Security – a bit more than 50 million. Social Security is a federal program. K-12 education is funded at the state and local level with only 8% federal funding. The federal government has deep pockets. State and local governments have shallow pockets with many demands from their constituents. In 2019, federal, state and local governments spent $765B, or $15,120 per pupil in 2019 (Hanson, 2022). That’s 75% of what we spend on retirees. Have we shifted too many resources to seniors from children?

Retirees have paid Social Security taxes for their entire working lives and feel that those funds have been set aside for them. The federal government doesn’t have to provide goods and services to retirees. Even the task of computing and remitting Social Security taxes is done by businesses – by law and for free. The accounting is a business expense. State and local governments must provide real resources. These include schools and facilities, teachers and lunches, school nurses and security guards.

Education competes with other essential services. The 2008 financial crisis and the slow recovery “put a hurt” in most state and local budgets. Since 2008, the national average of real per pupil funding has increased only 6% (Hanson, 2022). For most of that time, inflation has been low. Imagine what a sustained period of high inflation might do. Let’s look back at the last period – the 1970s and early 1980s.

Higher inflation wakes us up. Even when inflation is low, workers are squeezed, having to support children and retirees. Inflation increases the budget squeeze so workers pay closer attention to personal budgets and public policies. In the high inflation decade of the 1970s the public discovered that income and real estate taxes were not indexed to inflation. Rising wages caused people to go into higher tax brackets even when their real wages had barely moved. Tax laws were changed in the 1980s.

Ever rising real estate taxes in California made it difficult for retired homeowners on fixed incomes to stay in their homes. A growing taxpayer revolt rose up in many states. In 1978, California voters approved Proposition 13 which limited annual increases in taxes. Real estate taxes are the largest source of funding for schools so today California spends 10% less than the national average on K-12 students. Will today’s higher inflation provoke some sweeping policy changes?

Knowing past history, the Fed can’t let high inflation get entrenched in the economy for long. People will demand policy and institutional changes. Next week I’ll look at consumer psychology during high inflation periods.

////////////////////////

Photo by CDC on Unsplash

C-Span. (2005, March 3). User Clip: Alan Greenspan answers Paul Ryan. C-Span. Retrieved October 7, 2022, from https://www.c-span.org/video/?c4923562%2Fuser-clip-alan-greenspan-answers-paul-ryan

Hanson, Melanie. “U.S. Public Education Spending Statistics” EducationData.org, June 15, 2022, https://educationdata.org/public-education-spending-statistics

Social Security Administration. (2022). Cost of Living Adjustments. Cost-Of-Living Adjustments. Retrieved October 7, 2022, from https://www.ssa.gov/oact/cola/colaseries.html

SSA: Social Security Administration. (2022, August). Monthly Statistical Snapshot, August 2022. Research, Statistics & Policy Analysis. Retrieved October 7, 2022, from https://www.ssa.gov/policy/docs/quickfacts/stat_snapshot/

////////////////////////

50595238

Inflation and Profit Flow

September 18, 2022

by Stephen Stofka

Price records circumstances, not value or utility. Our buying power is like a bar of soap. As water shrinks soap, high inflation shrinks our buying power. Economists offer several explanations for the persistent inflation but the one that I buy is that constrained supply and fairly steady demand are driving prices higher. Rising prices are a symptom of a shortage of goods – a quantity issue. Retailers inventory to sales ratio has increased slightly from the historic low in May 2021 but the ratio is still far below the range of 1.4 – 1.5 that was the benchmark before the pandemic.

This past Thursday, I picked up three jars of my favorite crunchy peanut butter. Some stores have been out of stock on the crunchy variety so I bought extra to be sure. I was not concerned about rising prices. I was responding to a quantity shortage, or the fear of a shortage. The difference is important. In Econ 101, students are shown the standard supply and demand diagram.

Left out of this stylized relationship is that supply is on a slower time scale than demand. It takes time, planning, investment and risk to produce all that supply. To cope with that reality, businesses must keep an inventory on hand to meet changes in demand which happen on a shorter time scale. Shift the red supply line to the left and the intersection of supply and demand occurs at a higher price. The Fed and the market thought that the supply constraints would fully resolve by this year but they have not. As stores and restaurants reopened, customers put away the electric panini sandwich makers, bread machines and gym equipment they had bought during the pandemic. They began purchasing consumables and were willing to pay higher prices for clothes, airline and movie tickets, and restaurant meals. In the face of ongoing supply constraints, the Fed has had to keep raising interest rates to try to curb demand, shifting the blue demand line to the left as well.

The higher prices helped businesses recover profits lost during the pandemic. Businesses have taken advantage of the supply disruptions to juice their profits by 33% (BEA, 2022).

When the Republicans took control of both chambers of Congress and the Presidency, they lowered corporate taxes. Those on the left often blame the economic elite for society’s problems and wasted no opportunity in criticizing Republicans for gifting the corporate elite. Mr. Trump boasted on his business prowess, promising to get the economy revving up again. Despite his rhetoric, corporate profits remained at the same level as during Mr. Obama’s second term.

A Presidential veto can block legislation but it is Congress that passes the laws that affect the economy. As I wrote last week Congress sometimes buys voter approval, creating bubbles that finally implode. The State Historical Society of Iowa (2019) has an image of a 1928 campaign ad for Herbert Hoover. It is a resume of economic progress under total Republican control during the 1920s. The Congress had won the public’s approval with easy credit and lax regulation. The following year the onset of the Great Depression brought down the house of cards. 25% of workers lost their jobs. Many lost their homes and farms.

Corporations exist to turn money flows into profits. Whatever money Congress spends winds up in corporate coffers. After 9-11, the federal public debt rose by $3 trillion (U.S. Treasury Dept, 2019) while corporate profits more than doubled, all thanks to Congress. Democrats and Republicans supported higher military spending and a building boom supported by easy credit policies.

In response to the pandemic, a bipartisan effort in Congress passed relief packages of more than $3 trillion. Today the public debt is $7 trillion above the pre-pandemic level. Much of that money became corporate profit because that’s what good companies do – turn cash flows into profits. Some of those profits were then used to buy the Treasury bills generated when the government increased their debt. This completed the cycle of debt and profits.

On average voters re-elect 90% of House members and 80% of Senate members. Midterm elections are less than two months away. Both parties take advantage of the public’s tendency to pin responsibility – good or bad – on the President, both the current and the past President, Mr. Trump. “Inflation is Biden’s fault,” Republicans will say and hope it sticks with some voters. Democrats hope that Trump will announce a 2024 run for President before the coming midterm election. They hope that independent voters, particularly suburban women, will vote for Democrats to voice their disaffection with Mr. Trump.

The election spending will juice the profits of media companies who depend on the craziness of our democratic politics. People in western European countries look in dismay at our frenzied politics that makes us vulnerable to a populist like Trump. Some Americans long for authoritarian measures that might curb the craziness of our politics and promote more cooperation. They are tired of the demolition derby of American democracy and wish they could go to sleep for a few months until it is over.

////////////////////

Photo by Anvesh Uppunuthula on Unsplash

State Historical Society of Iowa. (2019, January 14). “A chicken for every pot” political ad, October 30, 1928. IDCA. Retrieved September 16, 2022, from https://iowaculture.gov/history/education/educator-resources/primary-source-sets/great-depression-and-herbert-hoover/chicken If you have a moment, do check this out!

BEA: U.S. Bureau of Economic Analysis, Corporate Profits After Tax (without IVA and CCAdj) [CP], retrieved from FRED, Federal Reserve Bank of St. Louis; https://fred.stlouisfed.org/series/CP, September 16, 2022.

U.S. Department of the Treasury. Fiscal Service, Federal Debt: Total Public Debt [GFDEBTN], retrieved from FRED, Federal Reserve Bank of St. Louis; https://fred.stlouisfed.org/series/GFDEBTN, September 16, 2022.

The Water That Connects Us

August 28, 2022

by Stephen Stofka

Several events this week share a common theme. President Biden announced a partial student loan forgiveness program.  Fed chair Jerome Powell announced the central bank’s firm commitment to tame inflation. The justice department is pursuing tens of thousands of fraudulent claims related to the pandemic federal relief programs. California Governor Gavin Newsome announced that the state will completely phase out gas fueled cars by 2035. What do these four events have in common? Government officials taking action to shield or relieve individuals from some oppressive force – a debt burden, rising prices, a pandemic, and a contributing cause to climate change. Government is a raft, an anchor of safety that we must share if we are to keep our heads above the water that connects us.

The physical world does not care whether human beings acknowledge or deny climate change. In 2013 the IPCC released their fifth assessment of the global climate. They were careful to note that they could not project individual small weather events like thunderstorms but that there would be more extreme weather events. Tree ring data indicates that this two decade drought in the west last occurred 1200 years ago. Agriculture uses 80% of the total amount of water humans use and have been severely impacted by water rationing. The federal government and states have spent billions fighting fires throughout the west. In recent days several southern states have experienced “1000 year” floods. They have declared emergencies to trigger federal assistance for cleanup and rebuilding.

The sun pours a flow of energy on the earth. Greenhouse gases like carbon dixoide retard the escape of the heat from that energy. California’s initiative is a key declaration of an aspirational agenda to lessen the release of greenhouse gases.  Building an infrastructure for thousands of electric vehicles is a Herculean task. So was the journey from Independence Missouri on the Oregon Trail in the 19th century. More of us are realizing that things have gotten to a point that we have to make some changes whether we like it or not. California has declared its intention to start the journey. Let’s hope more states will follow.

Inflation is oppressive. In a Jackson Hole summit speech this Friday Fed Chairman Jerome Powell stressed the Fed’s  commitment to taming inflation. “Inflation feeds on itself,” he said. As people come to expect higher inflation they may buy more now, making choices that actually accelerate inflation. When inflation is low, businesses and people no longer need to factor in rising prices as they make future plans. Former Fed Chairman Allan Greenspan called it “rational inattention.” The Fed has a twin policy mandate from Congress – full employment and stable prices. Because unemployment is so low the Fed feels that they can focus their policy tools on curbing inflation. Powell warned that rising interest rates would have a negative impact on both economic growth and employment. The stock market fell more than 3% in response to the Fed’s determination to keep raising rates until inflation has returned closer to their target.

David Farenthold (2022) reports that the Justice Department is pursuing tens of thousands of fraudulent claims under the CARES act. Three relief programs totaled $5 trillion, $3.1 trillion in the spring of 2020 and $1.9 trillion under the new Biden administration in the spring of 2021. Because there are so many cases, those who stole $10,000 will probably escape prosecution as investigators tackle claims with larger amounts. The Labor Department has 39,000 cases of fraudulent unemployment claims pending. The Small Business Administration has over two million fraudulent claims to investigate and verify. So far, the Justice Department has charged 1500 and secured 500 convictions. During the pandemic, Congress reached out. Many took advantage.

President Biden announced a student loan forgiveness program of $10,000 for each student with outstanding student debt and an income below $125K. The debt relief does not apply to those pursuing advanced medical and law degrees. A surge of college enrollment before and after the Great Recession drove student loan debt much higher. For-profit colleges overpromised well-paying careers to attract lower income students who qualified for federal grants and loans. Those low-income students who qualified for Pell grants will be eligible for up to $20,000 of student loan forgiveness. This will help minority students and women who typically earn less even after earning a BA degree. Most of those who graduate from 4-year schools come from the top 50% of incomes, and are endowed with more financial and educational resources prior to entering college. Whether a president has the power to forgive student loan debt is a matter for the courts. Mr. Biden’s executive action will surely be challenged.

Former President Ronald Reagan once quipped “The nine most terrifying words in the English language are: I’m from the Government, and I’m here to help.” Despite his rhetoric, Reagan headed a big spending government that helped certain groups of people. Communities near military bases appreciated his military buildup in the fight against the Soviet Union. Investment and savings banks appreciated the 1984 and 1986 bailouts from his administration. High interest rates during the early 1980s drove the economy into a deep recession and curbed inflation but crippled debt-burdened farmers. Many family farms were sold to large agricultural holding companies. Military contractors and finance companies got relief. Farmers did not.

The founders of our country thought that the business of government was to protect people from oppressive burdens. Then as now we argue about whose burdens, who pays and how they should be relieved. We are all interconnected, swimming in the same pool. Government is a big raft, a temporary rest from a lifetime of staying afloat. At times we appreciate the hand up when someone says, “I’m from the government and I’m here to help.”

////////////////

Photo by Jong Marshes on Unsplash

Fahrenthold, D. A. (2022, August 16). Prosecutors struggle to catch up to a tidal wave of pandemic fraud. The New York Times. Retrieved August 25, 2022, from https://www.nytimes.com/2022/08/16/business/economy/covid-pandemic-fraud.html

United Nations. (n.d.). United Nations Charter. United Nations. Retrieved August 26, 2022, from https://www.un.org/en/about-us/un-charter/full-text

Different Measures

July 31, 2022

by Stephen Stofka

Inflation around the world is high but the primary contributors to rising prices vary by region. In the U.S., heightened demand has outpaced supply. In Europe, supply and rising costs have had the most influence on inflation. Price growth is outpacing wage growth, adding pressure to many household budgets. This week the first estimate of GDP growth in the second quarter was -0.9%, the second consecutive quarter of negative growth. Economists offered varying definitions of recession while politicians threw blame and accusations for the economic downturn. Only Japan and Germany have lower unemployment rates than the 3.6% rate in the U.S. (OECD, 2022). In the fall of 2019, Mr. Trump bragged when the rate was that low. Political messaging is founded on diversion, delusion and doubt. 

Let’s start with the inflation rate, a crucial factor in the calculation of real GDP, the headline GDP numbers that are highly publicized. The inflation rate is deducted from the quarterly growth in nominal GDP to arrive at an inflation-adjusted measure of output. The higher the inflation rate, the lower the real GDP growth rate. In the 38 developed countries that comprise the OECD, average inflation in the 2nd quarter was 9.6% and GDP quarterly growth was 0.2%, a flatline in growth. Stuck in a three decade economic malaise, only Japan had a reasonable inflation rate of 2.4%. Here are the inflation rates in a few selected countries: U.S. 9.1%, U.K. 8.2%, Germany 7.6%, Italy 8.0%, France 5.8%. The 19 countries of the Eurozone are averaging 8.9% inflation and GDP growth of 0.5%. Only 40% of OECD countries have growth greater than 1% and those countries have relatively small economies (OECD, 2022).

Gross National Product, GDP, is the most widely publicized measure of economic activity but there are alternative measures. GDP emphasizes production within a country’s borders regardless of ownership. If a Japanese firm owns an auto plant in Tennessee, that production is counted even though the profits are flowing to Japanese investors.

Gross Domestic Income, GDI, includes income from all American owned production around the world but would not include income to the Japanese owners of the Tennessee plant. Ford co-owns 50% of Changan Ford Automobile Corporation, Ltd. in China. GDI would include income from that production. U.S. companies have large investments around the world so GDI captures that global presence.

The two measures capture different aspects of a country’s economy. The graph below charts the quarterly growth in real, or inflation-adjusted GDP and GDI (BEA, 2022). Notice that GDI quarterly growth remained positive in the 1st quarter.  The Bureau of Economic Analysis (BEA, 2021) won’t release 2nd quarter data for Gross Domestic Income for another month. A third measure, Final Sales of Domestic Product, excludes inventory adjustments and it turned positive in the second quarter.

(BEA, 2022)

Major League Baseball uses high frame rate cameras to capture the second-by-second action on the field. With the advantage of multiple angles and slow motion, a review committee in NYC overturns almost 50% of disputed calls (AP, 2020). While the players and fans wait for that review, they argue the call.

In the U.S., the final arbiter of recessions is a recession dating committee at a private, non-partisan organization called the National Bureau of Economic Research (NBER, 2022). The committee requires several months to gather enough data to determine the start of a recession. They announced the start of the 2001 recession at the end of that recession. In the FAQ accompanying the announcing the committee warned that two quarters of negative growth do not always count as a recession because the committee uses monthly data (NBER, 2001). Neither the Fed nor political parties can wait for all the information. The Fed makes monetary decisions in real time. An opposition political party uses even the hint of recession in an election year to sow doubt in the minds of voters.

On June 3, 1980, five months before the Presidential election, the NBER (1980) declared a probable start to a recession in January of that year. That announcement gave Republican challenger Ronald Reagan momentum against incumbent Jimmy Carter. In 1992, as unemployment continued to rise following the 1990 recession, challenger Bill Clinton suggested that we might be headed for another recession and called for a change in leadership. In their campaigns, John F. Kennedy (1960) and George Bush (2000) suggested that the economy might already be in a recession as the election neared. Both called for a change in leadership. This year Republicans will run on economic issues conveniently summarized with one word – inflation and recession. Democrats can highlight historically high employment gains and a low unemployment rate and will certainly run on individual rights.   

In baseball, the MLB central review office makes the final call on disputed calls. In national accounting, the recession dating committee at the NBER makes the determination of the start and end of recessions. In disputed decisions among lower courts, the Supreme Court makes the final determination and rule. In presidential elections, the electoral college makes the final call. We may not like the calls but we agree to live by them. Following the 2020 election, former President Trump and his allies broke that agreement and on January 6th tried to overturn the final call by violence. There’s a single word for that – coup.

///////////////////

Photo by patricia serna on Unsplash

AP. (2020, July 21). MLB doubles camera angles for video reviews of umpires. Tampa Bay Times. Retrieved July 29, 2022, from https://www.tampabay.com/sports/rays/2020/07/21/mlb-doubles-camera-angles-for-video-reviews-of-umpires/

BEA. (2022, June 29). Gross Domestic Income. Gross Domestic Income | U.S. Bureau of Economic Analysis (BEA). Retrieved July 29, 2022, from https://www.bea.gov/data/income-saving/gross-domestic-income

U.S. Bureau of Economic Analysis (BEA). (2022). Real gross domestic income [A261RX1Q020SBEA], retrieved from FRED, Federal Reserve Bank of St. Louis; https://fred.stlouisfed.org/series/A261RX1Q020SBEA, July 29, 2022.

U.S. Bureau of Economic Analysis (BEA). (2022). Real Gross Domestic Product [GDPC1], retrieved from FRED, Federal Reserve Bank of St. Louis; https://fred.stlouisfed.org/series/GDPC1, July 29, 2022.

U.S. Bureau of Economic Analysis (BEA). (2022). Real Final Sales of Domestic Product [FINSLC1], retrieved from FRED, Federal Reserve Bank of St. Louis; https://fred.stlouisfed.org/series/FINSLC1, July 29, 2022.

NBER. (1980, June 3). Business cycle dating committee announcement June 3, 1980. NBER. Retrieved July 29, 2022, from https://www.nber.org/news/business-cycle-dating-committee-announcement-june-3-1980

NBER. (2001). Business cycle dating committee announcement November 26, 2001. NBER. Retrieved July 29, 2022, from https://www.nber.org/news/business-cycle-dating-committee-announcement-november-26-2001#:~:text=of%20this%20memo.-,FAQs,the%20recession%20in%20March%202001.

NBER. (2022). US business cycle expansions and contractions. NBER. Retrieved July 29, 2022, from https://www.nber.org/research/data/us-business-cycle-expansions-and-contractions

OECD. (2021, May 25). OECD welcomes Costa Rica as its 38th member. OECD. Retrieved July 29, 2022, from https://www.oecd.org/newsroom/oecd-welcomes-costa-rica-as-its-38th-member.htm

OECD (2022), Inflation (CPI) (indicator). doi: 10.1787/eee82e6e-en (Accessed on 29 July 2022)

OECD (2022), Quarterly GDP (indicator). doi: 10.1787/b86d1fc8-en (Accessed on 29 July 2022)

OECD (2022), Unemployment rate (indicator). doi: 10.1787/52570002-en (Accessed on 29 July 2022)

Price Tides and Cultural Waves

This week I’ll look at the week’s events within a broad context of several centuries so make sure your seat belt is secure! Two weeks ago I wrote about two reliable indicators of recession, the annual acceleration in unemployment and in real retail sales. Since World War 2, an upward tick in unemployment and a downward movement in real retail sales has always preceded a recession. The unemployment report came out last week ending July 10th. The acceleration in the unemployed has remained negative, not confirming a high likelihood of a recession in the presence of weak retail sales.

The latest reports on inflation and retail sales were released this week. Although retail sales showed an increase, inflation adjusted retail sales decreased from last year. The deceleration in real retail sales is severe at -26%, indicating the dramatic consumer response to inflation and higher interest rates. Whether economists declare an official recession or not, consumers are feeling the pain and uncertainty. Here is an update on a graph I showed two weeks ago.

(FED, BLS, 2022)

In 2011, we saw a similar pattern – a plunge in retail sales but not an annual rise in the unemployment rate. There was a budget battle, a looming government shutdown and the stock market dropped 20% in anticipation of a recession that did not materialize. In the first quarter of 2012, the stock market began another historic climb, rising 60% in 30 months.

Each week we are reminded of rising food and energy prices but the rise in the cost of housing has been the most dramatic. According to Redfin (2022), a national real estate brokerage, a townhome in LA had a typical mortgage of almost $2400 in February 2021. In June 2022, they estimate a monthly mortgage cost of $4000, making it more expensive to own a townhome than to rent.

In David Hackett Fischer’s (1996) book The Great Wave he wrote about four centuries where prices continued to rise even during economic downturns. He dubbed these periods of sustained inflation “price revolutions.” The approximate dates are the 1200s, 1500s, 1700s, and 1900s (p. 6). The current price revolution began after World War 2, with prices falling only three times. Despite the severe recessions of 1974 and 1982, prices continued to rise.

Price revolutions create class conflict. The prices of life sustaining commodities like food, basic commodities, energy and shelter go up, having a greater impact on people with lower incomes. There are higher returns to property and capital owners. The price movements of manufactured goods are more tame but these benefit those with higher incomes, exacerbating class tensions (p. 86).

According to the Dept of Agriculture (USDA, 2022), the cost of food at home has fallen in only two of the last fifty years – in 2016 and 2017. There have been nine recessions since WW2, but the cost of shelter has fallen in only one year – 2010 (BLS, 2022). In a period of sustained price increase, people need more money. Since 1960, the per person quantity of a broad measure of money called M2 has declined in only two years – 1993 and 1995 (BOG, BEA, 2022).

Fischer identified seven causes of inflation (p. 279-280). Let’s review these in light of the rise in the cost of shelter. The first is an expansion of the money supply. A textbook example is the 1920s in Weimar Germany when people carted money in wheelbarrows to buy groceries. Today the Federal Reserve increases the money supply by lowering interest rates. People demand more credit and the banks increase the money supply. Low mortgage rates increase housing debt and the demand for housing.

A second cause  of inflation is an increase in aggregate demand. An extreme example is the surge in military spending during WW2. In this case we are focused on one sector – housing. According to the Case-Shiller Home Price Index (S&P, 2022), home prices have risen at last 5% each year in the past decade. China’s rapid industrialization since 2000 has elevated global demand for building supplies. A third cause of inflation is a contraction in supply. The pandemic caused supply bottlenecks in the supply of lumber and other building materials. A fourth cause is rising input costs, or “cost push inflation.” This is sometimes associated with rising wages as happened in the 1960s, but real wages in the decade before the pandemic rose only 5%, according to the BLS (2022). In that same ten year period, the costs of building materials rose 26% and jumped 50% in the second quarter of 2021 (BLS, 2022).

A fifth cause of inflation are administered prices, or oligopolies and monopolies created by government action or as part of an international pact. A good example is the alliance of oil exporting countries known as OPEC. This has not been a factor in the latest rise in home prices. A sixth cause is “bubble inflation” like the tulip mania of 1634 or the more recent surge in home prices during the 2000s. People bought homes in the expectation of a rapid rise in home asset values and they paid little attention to the home’s affordability.

The seventh cause of inflation is more applicable to the recent surge in home prices and current Fed policy – inflationary expectations. Anticipating higher prices of goods and services, people buy now, increasing demand and prices. The expectation starts a chain of events that fulfills the expectation. The late 1970s is a good example of this. Anticipating a 25% increase in the price of stereo in the coming year, a consumer would buy now on an installment plan, paying 15-20% interest. They were saving money and getting to use the stereo free for a year! It is that kind of thinking that the Fed wants to contain because those expectations continue to fuel inflation. Each of these inflationary factors adds to the persistence of inflation. Five of the seven causes are clearly present in this latest bout of inflation but the pandemic is the culminating event of decades of inflation.

In previous price revolutions, a crisis event led to a fundamental transformation of society, attitudes and thinking. The plague of 1348 ended the price revolution of the 1200s and early 1300s. In its aftermath,  humanism emerged and the serfdom of the Middle Ages declined. The price revolution of the 1500s was followed by the Thirty Years War and the founding of the nation state that persists to this day. The Age of Enlightenment accompanied the price revolution of the 1700s. Napoleon’s defeat at Waterloo in 1815 marked the beginning of the Modern Age, a revolution in travel, communications and industrial production. Will historians mark this pandemic as the end of the price revolution of the 1900s and the start of a new age?  

////////////////////

Photo by Silas Baisch on Unsplash

Board of Governors of the Federal Reserve System (US), M2 [M2SL], retrieved from FRED, Federal Reserve Bank of St. Louis; https://fred.stlouisfed.org/series/M2SL, July 15, 2022.

Federal Reserve Bank of St. Louis, Advance Real Retail and Food Services Sales [RRSFS], retrieved from FRED, Federal Reserve Bank of St. Louis; https://fred.stlouisfed.org/series/RRSFS, July 15, 2022.

Fischer, D.H. (1996). The Great Wave. Oxford University Press, NY.

Redfin. (2022, June). Data center. Redfin Real Estate News. Retrieved July 15, 2022, from https://www.redfin.com/news/data-center/. Note: at the bottom of the page is Redfin Monthly Rental Market Data. Enter the market and type of housing you are interested in.

S&P Dow Jones Indices LLC, S&P/Case-Shiller U.S. National Home Price Index [CSUSHPINSA], retrieved from FRED, Federal Reserve Bank of St. Louis; https://fred.stlouisfed.org/series/CSUSHPINSA, July 15, 2022.

U.S. Bureau of Labor Statistics, Consumer Price Index for All Urban Consumers: All Items in U.S. City Average [CPIAUCSL], retrieved from FRED, Federal Reserve Bank of St. Louis; https://fred.stlouisfed.org/series/CPIAUCSL, July 15, 2022.

U.S. Bureau of Labor Statistics, Consumer Price Index for All Urban Consumers: Shelter in U.S. City Average [CUSR0000SAH1], retrieved from FRED, Federal Reserve Bank of St. Louis; https://fred.stlouisfed.org/series/CUSR0000SAH1, July 15, 2022.

U.S. Bureau of Labor Statistics, Producer Price Index by Industry: Building Material and Supplies Dealers [PCU44414441], retrieved from FRED, Federal Reserve Bank of St. Louis; https://fred.stlouisfed.org/series/PCU44414441, July 15, 2022.

U.S. Bureau of Labor Statistics, Employed full time: Median usual weekly real earnings: Wage and salary workers: 16 years and over [LES1252881600Q], retrieved from FRED, Federal Reserve Bank of St. Louis; https://fred.stlouisfed.org/series/LES1252881600Q, July 15, 2022.

U.S. Bureau of Labor Statistics, Unemployment Rate [UNRATE], retrieved from FRED, Federal Reserve Bank of St. Louis; https://fred.stlouisfed.org/series/UNRATE, July 15, 2022.

U.S. Bureau of Economic Analysis, Population [POPTHM], retrieved from FRED, Federal Reserve Bank of St. Louis; https://fred.stlouisfed.org/series/POPTHM, July 15, 2022

USDA. (2022, June 24). Food price outlook. USDA ERS – Food Price Outlook. Retrieved July 15, 2022, from https://www.ers.usda.gov/data-products/food-price-outlook/

S&P Dow Jones Indices LLC, S&P/Case-Shiller U.S. National Home Price Index [CSUSHPINSA], retrieved from FRED, Federal Reserve Bank of St. Louis; https://fred.stlouisfed.org/series/CSUSHPINSA, July 15, 2022.