
November 13, 2022
by Stephen Stofka
October’s CPI report released this week indicated an annual inflation of 7.7%, down from the previous month. Investors took that as a sign that the economy is responding to higher interest rates. In the hope that the Fed can ease up on future rate increases, the market jumped 5.5% on Thursday. Last week I wrote about the change in the inflation rate. This week I’ll look at periods when the inflation rate of several key items abruptly reverses.
Food and energy purchases are fairly resistant to price changes. Economists at the Bureau of Labor Statistics (BLS) construct a separate “core” CPI index that includes only those spending categories that do respond to changing prices. It is odd that a core price index should exclude two categories, food and energy, that are core items of household budgets.
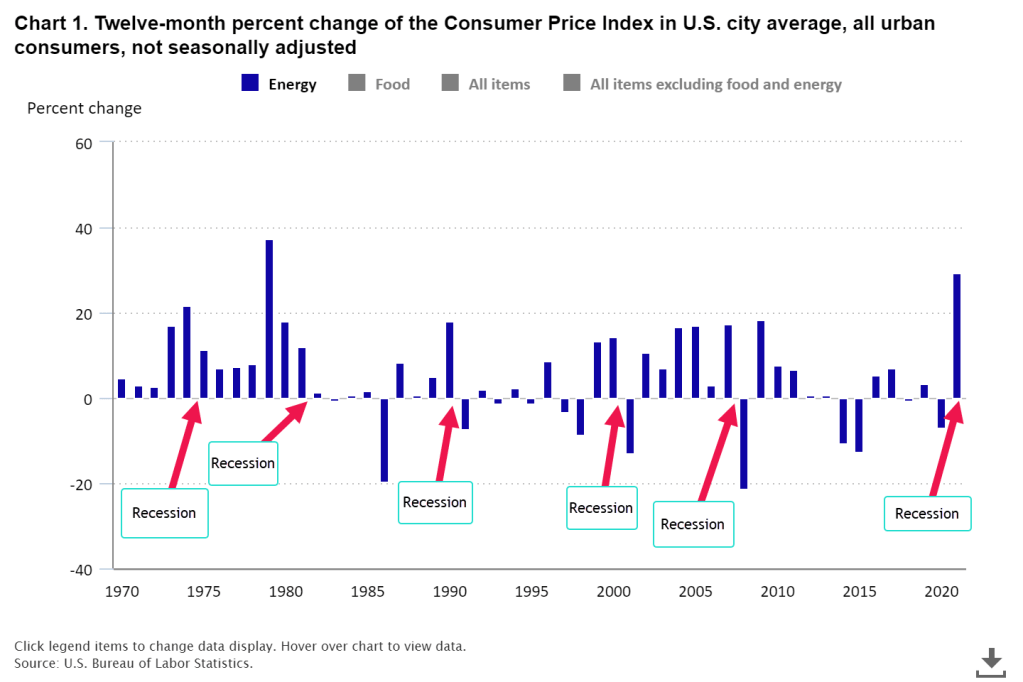
Ed Bennion and other researchers (2022) at the BLS just published an analysis of inflationary trends over several decades. Below is a chart of the annual change in energy prices. Except for the 1973-74 oil shock, a large change in energy prices led to a recession which caused a big negative change in energy prices.
We spend less of our income on food than we did decades ago so higher food prices have a more gradual effect, squeezing budgets tight. Lower income families really feel the bite because they spend a higher proportion of their income on food. In the graph below a series of high food price inflation often precedes a recession. Unlike energy prices, there is rarely a fall in food prices. Following the 2008 financial crisis, food prices fell ½% in 2009. It is an indication of the economic shock of that time.

Let me put up a chart of the headline CPI (blue line) that includes food and energy and the core inflation index (red line) which does not. Just once in 75 years, during the high inflation of the 1970s, the two indexes closely matched each other. Following the 1982-83 recession, the core CPI has outrun the headline CPI.

A big component of both measures of inflation is housing. The Federal Reserve (2022) publishes a series of home listing prices calculated per square foot using Realtor.com data. You can click on the name of a city and see its graph of square foot prices for the past year. You can select several cities, then click the “Add to Graph” button below the page title and FRED will load the graph for you. Here’s a comparison of Denver and Portland. They have similar costs.

The pandemic touched off a sharp rise in house prices in both cities. Denver residents have attributed the big change to an influx of people from other areas. However, Census Bureau data shows that the Denver metro area lost a few thousand people from July 2020 to July 2021 (Denver Gazette, 2022). In the decade after the financial crisis, there simply wasn’t enough housing built for the adults that were already here.
The surge in home buying has not been in population but in demographics. As people approach the age of 30, they become more interested in and capable of buying a home. The pandemic helped boost home buying because interest rates plunged from 5% in 2018 to 2.6% in 2021.
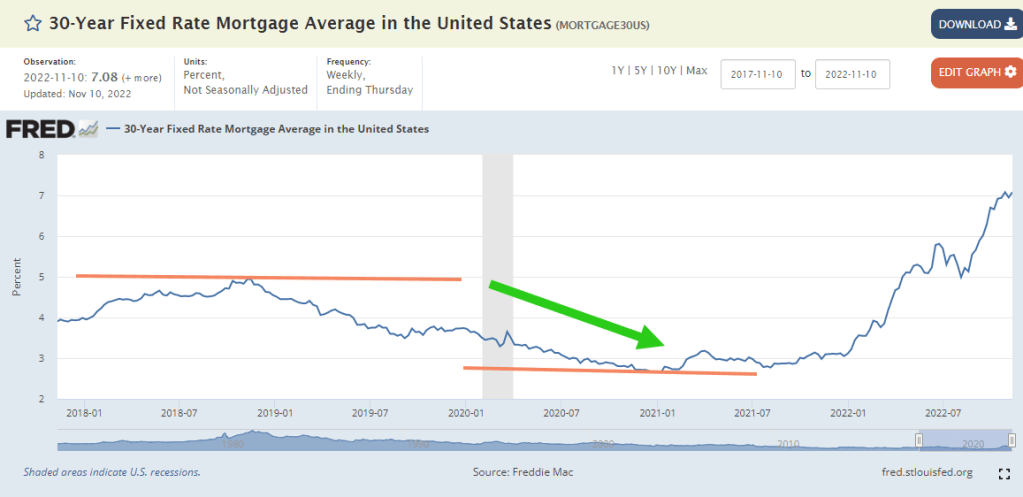
Record low interest rates enabled Millennials in their 20s and 30s to buy a lot more home with their mortgage payment. That leverage caused housing prices to rise. A 30-year mortgage of $320K has a monthly mortgage payment of $1349 at 3%. At 5%, it is $1718 and at 7% it rises to $2129. Ouch!
Rising rental costs and home prices drive lower income families to less expensive areas in a metro area or entirely out of an area. Declining public school enrollment has forced two Denver area counties to announce the closing of 26 schools and transfer them to other schools (Seaman, 2022). As the number of students decreases, the schools infrastructure costs do not change, increasing the per student costs. Buses have to be maintained, drivers paid, schools staffed with guards, cafeteria staff, janitors and administrative personnel. Once schools are shuttered, the building may be sold and converted to other uses, either residential or commercial. The public schooling system is like a large ship that takes some time to change course.
During our lifetimes we experience many changes. They can happen quickly or emerge over time. The effects may be short lived or last decades. Families are still living with the consequences of the financial crisis fourteen years ago. Carelessly planned urban development isolates the residents of a community. The social and economic effects can last several generations. As we grow older, we learn to appreciate William Faulkner’s line, “The past is never dead. It’s not even past.”
/////////////////////
Photo by Davies Designs Studio on Unsplash
Bennion, E., Bergqvist, T., Camp, K. M., Kowal, J., & Mead, D. (2022, October). Why inflation matters. U.S. Bureau of Labor Statistics. Retrieved November 11, 2022, from https://www.bls.gov/opub/btn/volume-11/exploring-price-increases-in-2021-and-previous-periods-of-inflation.htm
Denver Gazette. (2022, March 25). Denver joins big city trend with pandemic population slip. Denver Gazette. Retrieved November 11, 2022, from https://denvergazette.com/news/local/denver-joins-big-city-trend-with-pandemic-population-slip/article_65c6393d-2a4d-5b91-837c-f8c3efce3778.html
Federal Reserve. (2022). Median listing price per square feet:Metropolitan Areas. FRED. Retrieved November 11, 2022, from https://fred.stlouisfed.org/release/tables?eid=1138280&rid=462
Seaman, J. (2022, November 10). Schools targeted for closure in Denver, Jeffco have disproportionately high numbers of students of color, data shows. The Denver Post. Retrieved November 11, 2022, from https://www.denverpost.com/2022/11/10/dps-jeffco-school-closures-students-of-color/
////////////////////
