Oil and Inflation Diverge

July 10, 2022

by Stephen Stofka

The jobs report this past Friday surprised to the upside, showing a monthly gain of 372,000 jobs, far above the 250,000 expected gain. This is one of three indicators I wrote about last week. The positive job gains lowers the chances of a coming recession but the Atlanta Fed is now projecting a 2nd quarter decline of 2% in real GDP. As some economists have noted, it is unusual to have strong positive employment growth and negative GDP growth. In the graph below is the percent change in employment (blue line) and real GDP (red line). Since labor accounts for the majority of production costs, the two series move closely together.

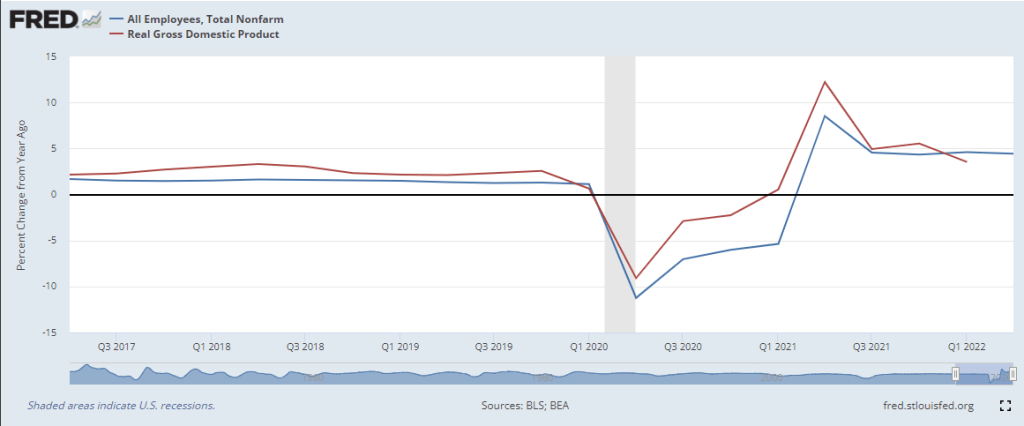
Historically, employment growth (blue line) is declining before recessions. Here is a look at the period before the 2008-9 recession.

Let’s turn to another prominent concern – inflation. When the price of oil declined below $100 this past week, some economists interpreted that as a sign of decreased demand and a greater likelihood of recession. The price of oil factors into the production of most goods, even the electricity that comes into our homes. In the graph below I’ve charted the acceleration in the price of oil and prices in general. The magnitude is less important than the direction. Most of the time, the direction of each is the same.

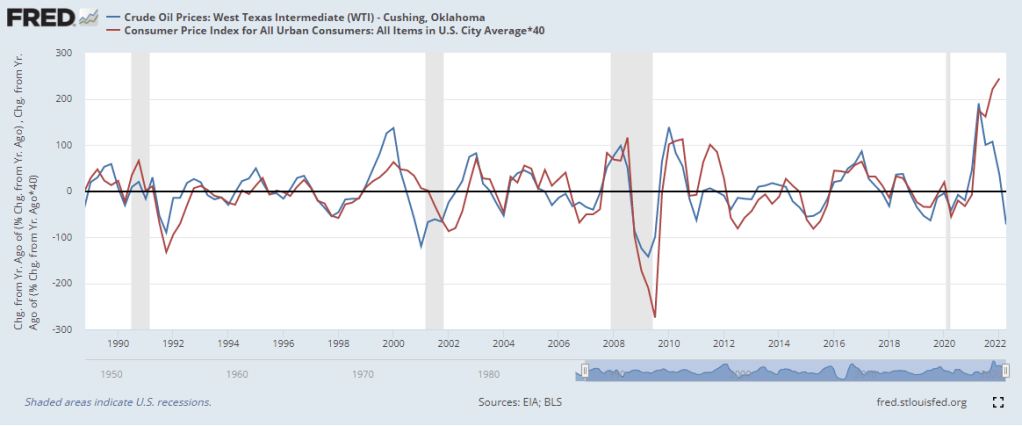
Now I want to focus on recent years. As the economy recovered from pandemic restrictions in 2021, the changes in both series shot higher as expected. In the past year, the acceleration in oil prices (blue line) has declined while the acceleration in general prices has gone up.

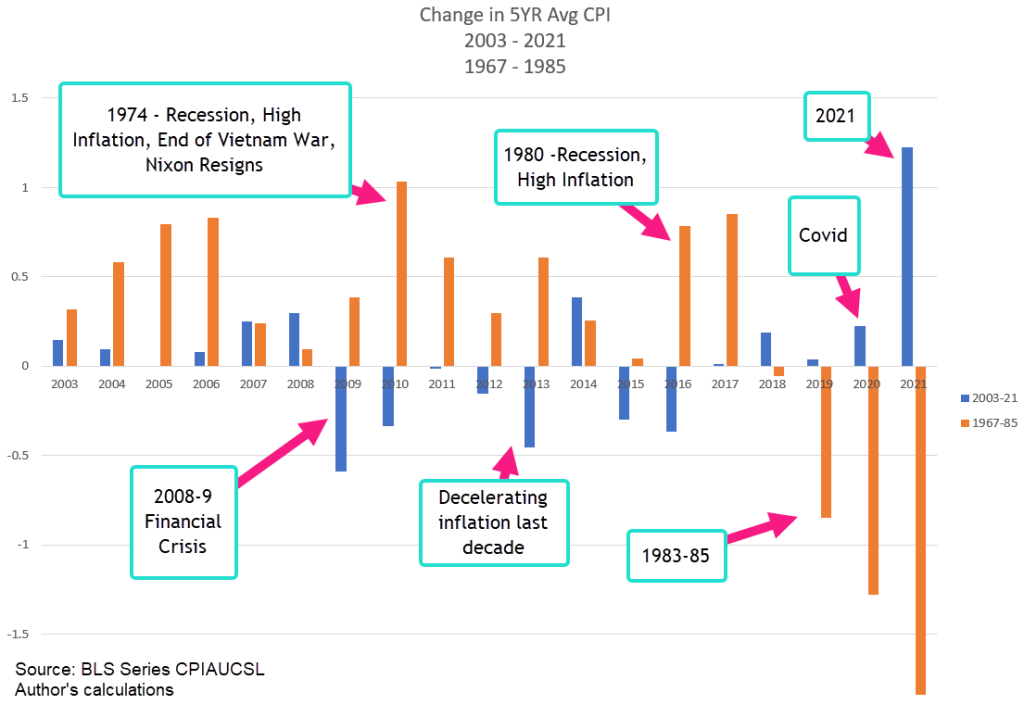
The divergence is unusual and indicates that inflation is grounded more in supply disruptions and pent up demand than in the price of oil. I’m guessing that the Fed has noticed a similar trend. To appreciate how unusual this divergence is, let’s go back to the 1970s when the price of a barrel of oil went from $3 to $34. Even though the price movement was extreme, the acceleration in oil prices and the general price level moved in the same direction.

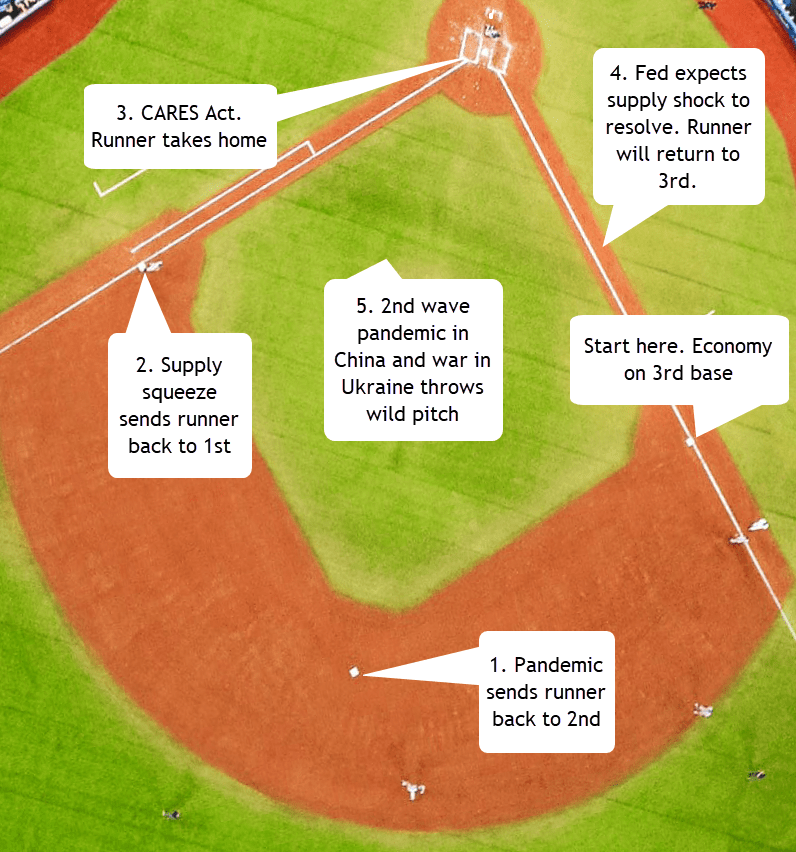
There is no shortage of opinions about Fed monetary policy and the Biden administration’s fiscal policy. The second stimulus payments went out in the first two weeks of 2021 under the Trump administration. Retail sales rose 5% that month, but fell 2% in February. Inflation in February was 1.7%, below the Fed’s target of 2%. On March 11, 2021, six weeks after taking the oath of office, Joe Biden signed the American Rescue Plan and in late March a third round of stimulus payments went out. Retail sales rose 11% in March but most of that increase happened before people received their payment. The odd thing is that there was little change in retail sales in the following months. This is one of many oddities surrounding this pandemic.

The general adult population received vaccines in April, May and June. Inflation rose above 5% by June 2021, then leveled off through September. In the graph above, the acceleration in oil prices and the general price level began to show a divergence. In the last three months of 2021, inflation started climbing while the acceleration in oil started falling. Why? It had never happened before.

Russia’s invasion of Ukraine has aggravated the situation and no one is happy. Xcel Energy, the public utility in my area, has raised electricity prices by 42% over last year; natural gas prices by 14%. The Fed’s next FOMC meeting is July 26-27 and the market is pricing in a 97% chance that the Fed will raise interest rates by another .75%, moving the federal funds effective rate near 2%. From 1954-2008, the average rate was 5.65%. From 1988-2008, the rate averaged 4.71%. Since 2008, the rate has averaged .62%. Near zero interest rates are abnormal.

Can the Fed retrain investors and consumers expectations toward a 3-4% federal funds rate in line with historical averages? The Fed conducts a lot of research but the current circumstances are unusual and the data shows conflicting trends. In a few years with the benefit of hindsight and firm, revised data, an economist can devote a few chapters if not an entire book to the past two years.

///////////

Photo by Tim Johnson on Unsplash

The Economic Valley

July 3, 2022

by Stephen Stofka

The Atlanta branch of the Federal Reserve maintains a running estimate of current output and other economic indicators updated sometimes daily as reports are released. The app is called EconomyNow and includes GDP, unemployment (UE), retail sales, and inflation. Recent data has caused them to revise their forecast for GDP growth in the 2nd quarter to a -2.1% annualized rate from 0% earlier in the week. Just a month ago, the model was forecasting 2% growth. If there was actually negative growth in the 2nd quarter, that would be two consecutive quarters of negative growth, increasing the likelihood that the Bureau of Economic Analysis (BEA) would call this a recession. However, the BEA does not rely on a single number to call a recession. Let’s look a bit deeper at past recessions.

Out of the many economic reports released each month, the unemployment (UE), inflation and retail sales reports have been reliable predictors of recession. The inflation report is used to adjust retail sales for inflation and produce what are called real retail sales. The combination of positive growth in UE and negative growth in real retail sales is a clear indicator of a weakening economy. The UE report for June will be released this coming Friday, the inflation report on July 13th and retail sales on July 15th.

Before each recession, the quarterly average of the unemployment rate rises above that of the previous year. Because the same quarter is compared in both years, the seasonal adjustments and economic flows are similar, an “apples-to-apples” comparison. Look at the rise in UE just before the 1990 and 2001 recessions, shaded gray in the graph below. (I will leave the series identifiers in the footnotes at the end of this post). Notice the hint of a recession in the first quarter of 1996. The Fed had raised interest rates by 3% in the previous year to curb growing inflation, then began lowering them at the end of 1995, averting what might have been a shallow recession.

Before the 2007-2009 recession, the growth of UE turned positive.

At the start of 2020, the UE was about the same as it was the previous year, an indication that the economy was susceptible to a shock. The pandemic was the shock of the century.

Let’s add in another indicator, real retail sales, and revisit these periods. When UE growth is positive, state unemployment benefits are rising while income tax revenues are falling. If retail sales are falling, then sales tax revenues are falling as well, putting additional budget pressures on states and localities. 1996:Q1 UE growth had barely turned positive but the growth in real retail sales was still positive and did not confirm the weakness in UE. In 2001, UE growth was positive and real retail growth was negative, confirming the economy’s weakness as investors became disillusioned with the heady promises of the new internet economy.

Before the 2008 recession, UE growth turned positive as real retail sales growth turned negative.

Let’s turn from that historical perspective to our current situation. In the 1st quarter of 2020, these two indicators turned positive and negative because of the pandemic, not in advance of it. At the end of 2019, UE growth was at zero, indicating a weakening economy. However, real retail sales growth was 1.6%.

There is a lot of talk about recession but these two indicators are not confirming that prediction. Growth in real retail sales is still positive and UE growth is negative. The reports in the next two weeks will give us a better picture of recession probabilities. The retail report comes out on July 15th, which is a Friday. The market will react to this report as it does most months. I will update the graph to include both of these indicators in my blog post for July 17th. Have a good 4th celebration and be careful if you live in a western state where it has been dry this year.

//////////////

Photo by Hans Luiggi on Unsplash

U.S. Bureau of Labor Statistics, Unemployment Rate [UNRATE], retrieved from FRED, Federal Reserve Bank of St. Louis; https://fred.stlouisfed.org/series/UNRATE, July 2, 2022.

Federal Reserve Bank of St. Louis, Advance Real Retail and Food Services Sales [RRSFS], retrieved from FRED, Federal Reserve Bank of St. Louis; https://fred.stlouisfed.org/series/RRSFS, July 2, 2022.

Lessons Learned

June 5, 2022

by Stephen Stofka

This week Janet Yellen, the current Secretary of the Treasury and former Fed Chair, admitted that she had not understood the path inflation would take. Such honesty from an administration official is refreshing. Ms. Yellen joins a long list of smart and experienced money managers who did not forecast this inflation trend. Global pandemics happen once a century, producing economic shocks that are unpredictable.

The economist Milton Friedman attributed inflation to money growth. Who grows money? Banks. The central bank (Fed) may increase the base money[1] it makes available to its member banks but it is the banks who multiply that base money when they make consumer and business loans. In the past decade, the annual percent change in household debt has tracked closely the rate of inflation. As long as banks were reluctant to extend credit, inflation remained low. The CARES act transferred billions to consumers and banks followed the money, extending more credit and shifting consumer demand higher.

For more than a decade sales of consumer durables excluding cars (ADXTNO) had waned. Pandemic restrictions forced us to alter our consumption habits and we bought durable goods for a new stay-at-home lifestyle. These included computers, dishwashers, refrigerators, and workout equipment. Our collective actions produced positive and negative effects. There is no one individual responsible for the negative impacts so we have blamed government policies or politicians.

Our collective actions change our physical and economic environment. Like a forest fire, we create our own weather and that feedback process can amplify the destructive forces of our actions. Adam Smith, the first economist, lived at a time when people were clustering in communities to trade with each other and engage in collective production. He was the first to note the dynamics of labor specialization where the productivity of individual effort is magnified and the entire community benefits from the assembly of coordinated effort.

As our  population grows and concentrates in larger communities, group dynamics have a greater influence in our individual lives.  Fashionable ideas and perspectives sweep through our society as easily as new product innovations. Social media speeds the introduction and adoption of trends. Under normal circumstances, the global supply chain adapts to these demand shifts rather quickly. However, the supply chain relies on a continuous flow of goods and services. The pandemic interrupted that flow, inducing a supply shock into the economy.

As economic activity returned to normal during 2021, investors and policymakers thought that supply chain disruptions would ease. Market prices increased about 20%. In January 2022, companies reporting 4th quarter results indicated that supply chain problems were slow to resolve and anticipated higher prices in 2022. Thousands of very smart people revised their earlier forecasts and adjusted their portfolio positions.

One of our favorite pastimes is armchair quarterbacking. We do it with ourselves as much as we do it with others. Reviewing a test score, we are sometimes surprised by a dumb mistake we made. Many of us gravitate toward jobs with a greater degree of familiarity and predictability. There is less stress and less likelihood of making mistakes. Some jobs are like daily tests with multiple selection choices and the answers are not certain. The lessons emerge as events unfold and lack what statisticians call external validity. The lessons learned or principles identified cannot be generalized to other situations because of important differences. Top administration officials and those in upper company management have those kinds of jobs.

/////////////

Photo by Ben White on Unsplash


[1] Base money refers to reserve money that is available only to banks.

Informed Expectations

May 8, 2022

by Stephen Stofka

A second round of the pandemic in key areas of China, continuing bottlenecks at ports and the war in Ukraine have played a key part in the persistence of inflation over the past few months. Supply shocks give companies a chance to raise prices faster than their production costs and increase profits – at first. This gives companies a chance to make up for lost profits during the pandemic. The rise in costs will hurt eventually and companies will blame rising wages.

Some people are blaming the Fed, accusing them of being behind the curve. I’ll present a model that helps readers understand the sequence of events over the past two years. Economists study how events, people and money interact. Like a football coach drawing out a strategy for a defensive backfield, economists use graphs with diagrams of solid and dashed lines with arrows to describe the dynamics of a process. For the layperson, it can be confusing. To make it fun, I sketched the dynamics on a baseball field. The action starts in the spring of 2020 with the runner – the economy – on 3rd base. Governments around the world dampened or shut down their economies to arrest the spread of the Covid-19 virus. I’ll put the graphic up here. Economists will recognize the bases as equilibrium points, and the left and right shifts of demand and supply.

 The pandemic sent the runner to 2nd base, a shift of demand. Supply constraints then sent the economy back to 1st base, a shift of supply. The CARES act and other government support programs could only send the runner to home, a shift of demand. Why not back to 2nd? Let’s keep it simple and say that those are the rules. The Fed’s monetary policy has already consisted of large measures in response to the pandemic. That is on another graph with DD and AA curves that would give a casual reader a headache.

The Fed knew that the economy should be on 3rd – not home base – but expected the supply constraints to resolve enough to shift the economy back to 3rd base. If the Fed took monetary action when it was not needed, the runner might get injured and have to rest. That’s a recession. So the Fed waited, ready to take action if the existing supply chain problems didn’t resolve.

Another wave of pandemic struck key manufacturing areas in China. In the U.S., ports on the west coast and transportation links to those ports were still not working properly. Russia attacked Ukraine, driving up the price of gasoline by more than 50%. Natural gas prices rose 160% (DHHNGSP  https://fred.stlouisfed.org/graph/fredgraph.png?g=P3jr ). As the war continued for several weeks, it became clear that there would be no spring planting of crops in Ukraine, a country that is a global food supplier. Futures prices rose, increasing grocery store prices and exacerbating the sharp rise in oil prices.

The Covid-19 virus, the many people and businesses in the supply chain, and Vladimir Putin did not pay attention to the informed expectations of the Federal Reserve. The Fed is a convenient target for pundits. Before the Fed was created in 1913, people blamed gold and anonymous speculators for panics and price instability. However, anonymous speculators do not show up for Congressional committees. A bar of gold just sits silent in the chair while committee representatives rant on at finance hearings. That’s no fun. The Fed has a chairperson, Jerome Powell, a punching bag for Congress and pundits. Taking verbal abuse is part of the job of being Fed Chair.

Congressional representatives often use charts in the main chamber. An aide slides a cardboard chart on an easel while the Congressperson explains the whole idea in 5 minutes. At a finance subcommittee hearing, Mr. Powell can bring in an easel with a diagram of a baseball field. He can point to the economy on 3rd base and explain the whole process in a simple but more eloquent way than I can. Once the committee members understood the idea, they would apologize to Mr. Powell for their earlier criticism and Washington would be a more peaceful place. If baseball players and managers could resolve their differences this spring, why can’t the folks in Washington? Play ball and a shout out to moms everywhere!

////////

Photo by petr sidorov on Unsplash

Groundhog Day

April 24, 2022

by Stephen Stofka

As the press announces the latest inflation numbers, we hear that this is the highest inflation number in four decades. These two periods share few similarities. In 1982, the economy was in a deep recession, the worst since the Great Depression. A clerical position or warehouse job would draw forty in-person applicants. Inflation had been sporadic and persistent for a decade. Two oil supply shocks and a surge of young Boomers into the workforce led to high unemployment and high inflation, a phenomenon termed “stagflation.” Since that time, economists have struggled to understand the peculiarities of that era.

Human behavior produces what economists call simultaneous causality, a recursive loop where event A causes event B which feeds back into event A. Just the anticipation of a policy causes people to act differently before the policy is implemented. This week Fed Chairman Powell strongly hinted that the Fed would raise interest rates by ½% at their May 3-4 meeting (FOMC, 2022). Anticipating that the rate increase could be as high as ¾% and more rate hikes than the market had already priced in, the market sold off on Friday. When in doubt, run, the survival strategy of squirrels and their large cousins, groundhogs.

Uncertainty joins all decades. Policymakers and investors must make forecasts and decisions with less than complete information. The more unusual the circumstances the more likely the flaws. In 1977, Congress enshrined the Fed’s independence in law and gave it a twin mandate of full employment and stable prices (Fed, 2011). A year later, Congress passed the Full Employment and Balanced Growth Act. The text of this act demonstrates how several years of stagflation had confused the direction of causality. The Act reads:

 High unemployment may contribute to inflation by diminishing labor training and skills, underutilizing capital resources, reducing the rate of productivity advance, increasing unit labor costs, and reducing the general supply of goods and services.

(U.S. Congress, 1978)

High unemployment accompanies or is coincident with diminished labor skills, resource utilization and productivity. Unemployed people lowers demand and that contributes to lower prices, not inflation. In 1979, a year after this act was passed, the Iranian Revolution overthrew the Shah and strikes in the oil fields cut global oil production by 6-7% (Gross, 2022). U.S. refineries were slow to switch production to alternative sources. Typical of that time, the Congress and U.S. agencies overmanaged prices, supply and demand in key industries. This regulation contributed to long lines at gas stations and a 250% increase in gas prices.

Today, much of the supply line has been affected by the pandemic and the effects linger. China has again shut down some tech manufacturing regions. The prices of building materials have been erratic. The ratio of home prices to median household income has now exceeded the heights during the housing crisis (Frank, 2022). Millennials have endured the dot-com crash, 9/11, the housing crisis, and the pandemic. Now a housing affordability crisis. The Fed’s survey of household finance reports that the median amount of household savings is $5300 (Wolfson, 2022).

War in Ukraine, crazies in Congress and little accountability. Since the end of 2019, inflation-adjusted wages have not improved (FRED Wages). Low unemployment should have driven wages far higher. Profit margins shrank or turned negative during the pandemic. Supply constraints have presented businesses with an opportunity to raise prices and make up for profits lost during the pandemic. As prices climb, policymakers and economists engage in a round of finger pointing.

Now comes the bit about a recession. Casual readers may have heard of a yield inversion. Time has value. Risk has value. A debt that is due five years from now should return or yield more than a debt due one year from now. There is more that can go wrong in five years. When shorter term debt has a greater yield than longer term debt, that is called a yield inversion. The yield curve is a composite of interest rates over different periods. A common measure is the difference between the 10 year Treasury note and the 2 year Treasury. When that spread turns negative over a period of 3 months, investors show their lack of confidence in the near future. A recession has occurred within 18 months.

Why should this be? As I noted at the beginning, we are a feedback machine. Our anticipation of events contributes to the likelihood that they will occur. The weekly version of the graph above did turn negative a few months before the pandemic struck in the spring of 2020. However, the weekly chart may give false forecasts. The quarterly chart captures sustained investor sentiment.

At the right side of the chart, we see how negative the sentiment has turned. The Fed knows that rising interest rates will drive that sentiment further down. By law – that 1977 law I mentioned earlier – they can’t ignore the force of rising prices. Employment, their other mandate, is strong enough to withstand some rate hikes. What worries the Fed now is a different type of unemployment – idle capital. Worried investors and business owners are less likely to begin new projects. That lack of confidence becomes self-fulfilling, creating an economic environment of pessimism. To Millennials, it feels like Groundhog Day all over again.

////////////////

Photo by Pascal Mauerhofer on Unsplash

Fed. (2011). The Federal Reserve’s “Dual Mandate”: The Evolution of an Idea. Federal Reserve Bank of Richmond. Retrieved April 23, 2022, from https://www.richmondfed.org/publications/research/economic_brief/2011/eb_11-12

FOMC. (2022). Meetings Calendars, Statements and Minutes (2017-2022). Board of governors of the Federal Reserve System. Retrieved April 23, 2022, from https://www.federalreserve.gov/monetarypolicy/fomccalendars.htm

Frank, S. (2022). Home price to income ratio (US & UK). Longtermtrends. Retrieved April 23, 2022, from https://www.longtermtrends.net/home-price-median-annual-income-ratio/

FRED Real Wages, Series LES1252881600Q. Index level 362 in 2019:Q4. Index level 362 in 2021:Q4.

Gross, S. (2022, March 9). What Iran’s 1979 revolution meant for US and Global Oil Markets. Brookings. Retrieved April 23, 2022, from https://www.brookings.edu/blog/order-from-chaos/2019/03/05/what-irans-1979-revolution-meant-for-us-and-global-oil-markets/

U.S. Congress. (1978). Public law 95-254 95th Congress an act. Congress.gov. Retrieved April 23, 2022, from https://www.congress.gov/95/statute/STATUTE-92/STATUTE-92-Pg187.pdf

Wolfson, A. (2022, March 2). Here’s exactly how much money is in the average savings account in America. MarketWatch. Retrieved April 23, 2022, from https://www.marketwatch.com/picks/heres-exactly-how-much-money-is-in-the-average-savings-account-in-america-and-psst-you-might-feel-inadequate-in-comparison-01646168736

The Change of the Change

March 20, 2022

by Stephen Stofka

Why do unexpected price changes bother us so much? Prices reflect two forces central to our lives – time and utility. Both are common measures yet each is uniquely experienced. The price of our utility – what we need and enjoy – and the price of our time is deeply personal. Price surprises upset a finely balanced mechanism inside each of us. We can adapt to a one-time price change. We struggle to make sense of repeated and erratic price changes.

A proverb in the tool business is that customers don’t want a ¼” drill bit – they want a ¼” hole. The price of goods we buy is the price of the experience we get when we consume a good. We don’t want an ice cream – we want the pleasure of eating ice cream. The cost of ice cream is the price of our time enjoying it.

Interest is the price of money’s time the way that wages are the price of our time. Einstein once quipped that interest was the most powerful force in the universe. We compliment ourselves when we enjoy an unexpected bonus return on our savings. We are outraged when the power of interest works against us. A credit card debt or student loan debt may grow even though we are making regular payments.

The price of money’s time and the price of our time are like two riders on a seesaw who seek an approximate level. For two decades the Federal Reserve has sat on the interest rate side of the seesaw to keep them close to the ground. In response, the prices of consumption assets (houses) and productive assets (stocks) have risen high. What about the price of consumption goods?

Inflation measures changes in the price of consumption goods the way that our car’s speedometer – the mileage indicator – measures our change in position on the road. We adapt to constant speed or inflation. What we notice then are the changes in speed or inflation – the acceleration. After a decade of low inflation, the pandemic was like approaching a highway junction and coming to a near stop before having to accelerate onto another highway. In mid-2021, the sudden acceleration of price changes seemed normal, a catching up after the economic lockdowns of 2020. The acceleration has continued for months now, as though the gas pedal got stuck. Using the FRED data tool at the Federal Reserve, I have charted the price acceleration – the change of inflation.

Today’s price acceleration is as high as that of the deep recession in 1973-74. Two shocks – one of them short term, one long term – produced a singular phenomenon economists called stagflation. The short term shocks were two oil crises in 1974 and 1979 that decreased world oil production (Gross, 2019). The long term shock was the large influx of the Boomer generation into the labor force, doubling the 1% average growth of the labor force. Forty years ago, the Boomers were in their late 20s and early 30s – at that age when we have increasing incomes and material needs. Lopsided demographics and supply shocks combined to produce erratic price changes.

To bring price acceleration under control in 1979 Fed Chair Paul Volker kept raising interest rates (FEDFUNDS) to keep them above the inflation rate. Interest rates acted as a cap on price changes. Once these two forces balanced, the change in inflation decreased but there was a cost. At that time, small businesses paid 20% interest for unsecured short term loans to cover payroll and accounts receivable. The change in interest rates was swift enough and large enough to drive the economy into recession. Until the 2008-9 financial crisis, the 1981-82 recession was the worst since the Great Depression of the 1930s.

This week, Fed Chair Jerome Powell announced a series of small and steady interest rate hikes with a target that is far below the interest rates of four decades ago when a 10% mortgage rate was a bargain. The demographics are different today. Because the labor force is barely growing structural price pressures should weaken. The large Boomer generation is aging and old people don’t buy as much stuff. The Fed can let the interest rate side of the seesaw rise up a bit and hope that inflation will lower in response. Instead of having to cap price changes as they did four decades ago, they can work to a negotiation between these two price forces.

////////////

Photo by Miles Loewen on Unsplash

Gross, S. (2019, March 5). What Iran’s 1979 revolution meant for US and Global Oil Markets. Brookings. Retrieved March 18, 2022, from https://www.brookings.edu/blog/order-from-chaos/2019/03/05/what-irans-1979-revolution-meant-for-us-and-global-oil-markets/

Unfolding Story

February 13, 2022

by Stephen Stofka

Trying to find the cause of inflation is like looking for a car in a big parking lot. Science is a process of ruling out causes. The latest release of the Employment Cost Index (ECIWAG) from the BLS rules out higher wages and salaries as a key driver of rising prices. During the financial crisis wages fell below trend and have stayed below the trendline for 12 years until this past year.

The average pay increase this past year has been 4.0%. Workers who have gained the most in this past year have been those with lower wages. Customer facing workers in leisure and hospitality workers are up 8% and retail workers have gained 6.3%. Other service jobs and whole sales are up over 5%. Industries with the lowest increases are in education 2.5%, state and local government (2.5%), utilities 3.0%, and financial activities 3.2%.

Two times a year the Philadelphia Federal Reserve (2022) surveys a number of economic forecasters and publishes the consensus outlook for inflation over the next decade. The current projection is 2.5%. Expectations for inflation among the public are on a shorter time frame. Once a month the University of Michigan publishes their survey of customer inflation expectations. December’s reading was 4.8%.

Housing costs could be a culprit for rising prices. The vacancy rate is very low at 5.6% and that has helped support a 5.7% increase in housing costs (CPIHOSSL). The growth rate has been swift in the past year, an aftereffect of the pandemic. For several years, the growth rate of housing costs had been about 2.7%, then fell to 2% during the pandemic. This erratic growth of the past months is unlikely to last.

The lack of new car inventory has led to sharp increases in used car prices, with smaller cars leading the pack. When the pandemic hit, auto manufacturers canceled their orders for semiconductors. As the tech factories in Asia resumed production, the auto manufacturers dedicated what chips they could get to larger SUVs and trucks with the highest profit margins. That has left a severe shortage of smaller cars. That has resulted in sharply higher prices for the used models.

The pandemic has been an experiment that would be unethical if done by anyone other than mother nature. For decades economists will try to understand the interlocking price and supply mechanisms. Economists still argue about the causes of the stagflation of the 1970s, almost fifty years ago. Human society and our interactions are at least as complex as the human mind. As economists sort through the dynamics of evolving relationships they can only hope to understand what is not true.

//////////////////

Photo by Evergreens and Dandelions on Unsplash

Federal Reserve. (2022). First quarter 2022 survey of professional forecasters. Federal Reserve Bank of Philadelphia. Retrieved February 13, 2022, from https://www.philadelphiafed.org/surveys-and-data/real-time-data-research/spf-q1-2022

Long-Term Inflation Trends

December 12, 2021

by Stephen Stofka

This past week the government’s estimate of inflation in November was a whopping 6.9% increase over last year’s prices. A comparison to November 2019 prices shows an annual increase of 4.1%. From June through September of this year, the year-over-year increase in prices flattened out at 5.4%. This plateau supported the view that higher inflation readings were a temporary effect. With the availability of vaccines, Americans were resuming their lives. Supply bottlenecks at western ports were contributing to higher demand. Since September inflation has steadily increased. That wasn’t in the script.

Each month the Bureau of Labor Statistics (BLS) surveys thousands of establishments and records the prices of many goods to compute the inflation estimate. We don’t need to know the mechanics of constructing a price index to get a sense of personal inflation. Many of us conduct a smaller survey of our friends, family and fellow workers. Our basket of goods contains a few important items like food, fuel, utilities and other housing costs. From that we build an inflation base that anchors our expectations of future price changes – until it doesn’t.

If there are a series of surprises to our expectations, we modify our individual behavior in anticipation of further surprises. That behavior can aggravate inflationary pressures so that we contribute to the very condition we anticipate. In its setting of interest rates, the Federal Reserve is mindful of this effect and earlier this year two economists at the Kansas City Fed worried that inflation expectations were anchored too low (Bundick & Smith, 2021). Fed policy and a decade of low inflation had lulled people into expecting minimum disruptions in price. People might have strong reactions to price changes, small or large.

Our base of inflationary expectations is formed over several years. In the chart below is the 5 year average of annual inflation in the Consumer Price Index, the most popular measure of price change.

The mountain of inflation during the 1970s has provoked much thought by economists and policy analysts. One hundred years after World War 1, historians continue to debate the causes of that war. In 2070, economists will debate the causes and effects of that inflation mountain. The peak of the 5-year mountain shown above was more than 9% but the annual rate in 1980 was 14%. Still, our big brains make us very adaptable. It is the surprises to those long-term trends that catch our attention.

In the chart below are two 18-year periods, from 1967-1985 when we climbed the inflation mountain, and the most recent period when we have become used to sluggish growth and declining inflation expectations. The earlier period is in orange, the recent period in blue. The year labels are the most recent period. 2003 and 1967 are Year 1 in the series.

 The graph illustrates the stark difference between the 1970s (orange bars) and the most recent two decades (blue bars). Between 2003 and 2020, Americans came to expect only minor change in the long-term inflation trend. The 2021 blue bar on the right is greater than the highest change post-war inflation which occurred in 1974. It’s even more dramatic because we have become accustomed to slight changes in many prices.

The discourse in this country was already aggravated and people are quick to take offense. Social media is built on people gaining attention by alerting others to offensive remarks or behavior. Politicians try to calm the narrative but inflation surprises disrupt the political conversation. Each person responds to their personal sense of inflation and whatever media voice, mainstream and radical, they prefer. Inflation surprises get people’s attention and the media’s business model is built on that attention. Even as inflation decelerates, the nightly news will continue to feature stories that heighten people’s inflation worries because worried people pay attention.

The political waters have been turbulent this past decade but price changes have been exceptionally placid. Like a rock thrown in calm waters, big surprises make big waves that take some time to dissipate. The task of the Federal Reserve’s rate setting policy is to dampen those waves – a series of small rate increases – without sending the economy into a recession.

/////////////////

Photo by Daniel Vogel on Unsplash

Bundick, B. & Smith, A. (2021). “Did the Federal Reserve Anchor Inflation Expectations Too Low?” Economic Review, Federal Reserve Bank of Kansas City. Available from https://www.kansascityfed.org/research/economic-review/did-the-federal-reserve-anchor-inflation-expectations-too-low/

Savings And Inflation

November 21, 2021

by Steve Stofka

Two billionaires, Warren Buffett and Elon Musk, pause before the packaged meat in a grocery store. This past week the price of rib eye steak, their favorite, has gone up a lot. Elon has had a busy week and wants a good rib eye so he picks out a steak and puts it in his basket. Warren would also like a rib eye but can’t bring himself to spend that much on a meal he will cook at home. He decides to buy the top sirloin and marinate it for a few hours. For whatever reason, Warren has reacted to a rise in the price of one good by substituting another good. Economists call this the substitution effect.

The next day Mary is shopping at that same store for a top sirloin steak for dinner. She notices that a few rib eye steaks are on sale for half-price. The expiration date is the next day but she intends to cook it that night so that is not a concern. Just as Warren did the previous day, Mary has responded to a price change by substituting one good for another. What about Elon? His response was to pay the higher price, substituting a different good, his income, for the higher price. Economists call this the income effect, where we substitute money for the higher price. Where does the money come from?

One source is savings, our backup income stream. Savings is the amount of income we have left over after paying taxes and buying stuff. It’s the money we didn’t spend before. After age 40, we become more conscious of the need to save for the later years in life when we stop working. Here’s a chart of per person savings for those over the age of 55. This does not include the equity that people have built up in their homes or investment accounts, but it does show broad trends.

The first of the Boomer generation turned 55 in 2001, a tumultuous year marked by the 9-11 attack, the dot-com bust and the buildup to the Iraq war. During the 2000s, economists and financial advisors warned that the Boomers had not saved enough. The Boomers complained that higher payroll taxes (Tax Policy Center, 2019), used to support earlier generations who had not paid in enough to Social Security, had reduced their ability to save. When the financial crisis reduced the value of both homes and investments, Boomers realized that their savings were too low. During the following decade, many worked past retirement age. Cautious spending by this age group restrained economic growth following the crisis and kept inflation in check during the recovery.

In the spring of 2020, Covid hospitalizations and death shot up in New York City and other urban hotspots. The Trump administration shut down most of the economy for several weeks. Congress and the administration passed emergency measures to provide relief to people who had lost their jobs. Savings shot up and incomes dropped. The pattern for all adults was the same as for older Americans.

As stores reopened and the economy recovered, it was inevitable that some of those savings would be drained away to buy stuff. The abrupt decline in savings has put pressure on prices. Are inflationary pressures temporary or  more permanent? Older generations have built up a reserve buying power that they did not have at the onset of the financial crisis twelve years ago.

There are 70 million Boomers who are spending down their accumulated savings. The Millennial generation, now 72 million strong, is the counterbalancing force to that dis-savings. Older Millennials are crossing the age-40 threshold when people start thinking that they had better put something away for the future. This tug of war in spending and savings between these two generations could continue to put upward pressure on prices for several more years.

////////////////////////

Photo by Damir Spanic on Unsplash

Tax Policy Center. (2019, July 18). Payroll tax rates. Retrieved November 20, 2021, from https://www.taxpolicycenter.org/statistics/payroll-tax-rates. From 1970 to 1990, payroll tax rates increased by 50%.

Prices Rising

November 14, 2021

by Steve Stofka

Put a bunch of people in a crowded theater, then yell “Inflation!” and no one runs for the exits. Instead they all turn to each other and start arguing. The recent rise in prices has prompted much discussion on the dynamics and causes of inflation. In the first six months of this year, the Fed cautioned us to compare 2021 prices to those of 2019 to get a more accurate picture of inflation. That longer term perspective began at 2.0% in January and slowly rose to 3.0% in June (BLS Series CUUR0000SA0). However, it keeps inching up and topped 3.7% in October. The one-year inflation rates have topped 6%. There are several causes including supply bottlenecks and higher demand but how long will it last? Is it temporary or more permanent? What should the Fed do? Is this the return of 1970s inflation?

This will be a two-parter so that I don’t strain anyone’s attention. First some background. Inflation is an increase in the overall price level. Why do prices go up? Because buyers buy stuff. How do people get the money to buy stuff? By working. In the 1950s, a British economist William Phillips studied a seventy year period of data and established an inverse relationship between unemployment and inflation. If more people are not working, they don’t have the money to buy stuff and prices don’t go up much. During the 1960s, unemployment declined more than 3% to 3.4% and inflation rose from 1% to 5%. This interplay confirmed Phillips’ hypothesis and policymakers believed that they could make a tradeoff between unemployment and inflation, balancing the two to produce an optimal economy. In the 1970s, high inflation and high unemployment dashed those hopes. Later, the Phillips hypothesis was revised, matching the relationship of the change in the inflation rate to unemployment.

Still other revisions included the role of the public’s expectations of inflation. I’ll take a real life example from the late 1970s. The price of a stereo with turntable and speakers is expected to go up in price by 20% next year. A store is offering credit with a 20% interest rate. If a consumer buys it now rather than saving up until next year, the amount of interest equals the change in price. A consumer gets to use the stereo for a year for free! Consumers start moving their future buying decisions toward the present and this ratchets up demand and inflation. 

Let’s go back to the definition of inflation as an increase in the overall price level. Where does that start? It may be the price of a commodity that we all use every day. During the 1970s, the sharp increase in the price of oil certainly had an effect. However, there was a sharp increase in oil in the summer of 2008 and there was not a prolonged bout of inflation. In fact, it may have contributed to the ongoing job loss that began in 2007 and added fuel to the developing housing crisis. Every time people think they got inflation figured out, it ducks and weaves like a boxer.

Without any change in policy, inflation automatically transfers income around the economy. Real, or inflation-adjusted, wages may remain the same but workers pay higher taxes on the nominal gains in wages. Economists call this seigniorage. The price of goods is higher so sales taxes are higher. Older people with savings earn higher interest income but those who want to borrow pay more in interest. Banks bank more profits on the difference, or spread, in the interest they pay on deposits and what they charge for loans. At higher mortgage rates, people can buy less house with their money because mortgage payments in the early years of a mortgage are mostly interest.

At higher rates of interest businesses cut back expansion plans and unemployment increases. This may help curb price pressures but people begin to adopt coping strategies than can prolong or exacerbate inflation. This creates a tug of war over the direction of prices. Next week I’ll review some of these behaviors and data trends from the past decades.

////////////////

Photo by Vicky Ng on Unsplash