February 3rd, 2014
The SP500 has been hovering over a support trendline in the 1760-1775 range, with buyers coming in at 1775. At 1750, the market would have corrected 5%, a fairly normal occurrence. Market watchers have been concerned that the market has not experienced one of these small “shaking of the tree” corrections since May/June of 2012. Disappointing earnings and revenue reports from bellweather companies, together with selling pressure on some emerging market currencies, have made traders nervous.
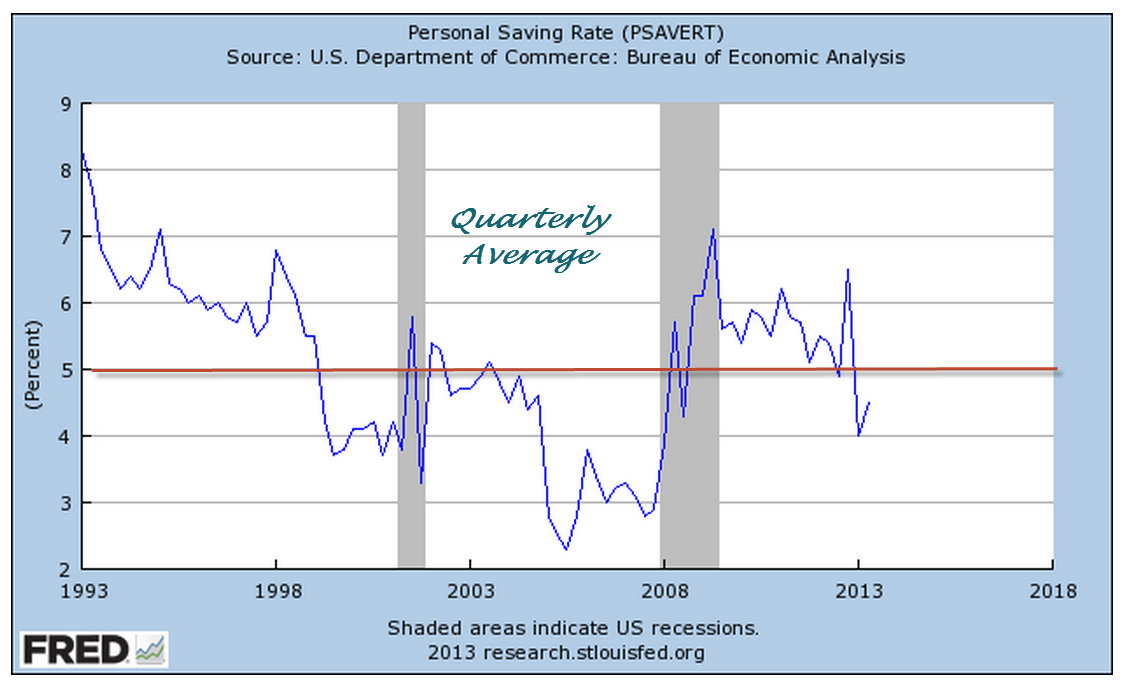
The market is composed of buyers and sellers responding within varying time frames. In a short to mid term time horizon, one person might pay more attention to turbulence in emerging markets or the latest corporate reports. A mid to long term investor might pay more attention to rising industrial production, healthy GDP numbers, consumer spending and income, and declining unemployment.
*****************************************
Apple forecast lower than expected revenues for the coming quarter in the China market. The announcement prompted an 8% decline in the company’s stock. Facebook reported blow out revenue growth of 63% in the past quarter, causing the stock to rise about 16%. FB’s active user base has more than doubled in two years. Despite the robust growth, the sky high valuation of the company reminds me of some internet stocks in the late 1990s. The stock has a Price to Sales – not Price to Earnings – ratio of about 15 to 1. Google has a track record of strong revenue and earnings growth and sports a richly valued price to sales ratio of 6.4. Does Facebook’s short track record deserve a valuation that is more than twice Google’s? In 2000, Microsoft had a price-sales ratio of 23 to 1. Fourteen years later, Microsoft’s stock sells for 30% less than it did in 2000. In 2000, Cisco had a price to sales ratio of 30 to 1. Cisco’s revenues were growing 50% a year. “The stock is cheap,” some said. Fourteen years later, Cisco sells for less than a third of what it did in the heady days of rapid growth. A word of caution to long term investors.
Amazon reported “only” a 20% increase in quarterly revenue during the busy 4th quarter Christmas season. This is five times the sales growth of the overall retail industry so a casual observer might think that the stock enjoyed a healthy bump up in price, right? Wrong. After rising 50% over the past year, the company’s stock was priced to perfection. The disappointing growth particularly in overseas markets prompted a lot of selling and an 8% decline in price on Friday.
As I noted last week, many retailers will report quarterly earnings in February. Many companies get a sense of the bottom line that they will report before the official release of quarterly data. If there are material differences between consensus expectations and forecast results, a company will issue a revised forward guidance. Wal-Mart did so this past week, revising its revenue and earnings forecast down for the fourth quarter and lowering earnings projections for the coming year. The company cited a much greater than forecast impact from November’s reduction of the food stamp program. The severe storms in December also had a material impact on sales.
In the past two months, Wal-Mart’ stock has declined 8%. Let’s think about that for a moment. The market value of Apple and Amazon declined 8% in one day. It takes two months for Wal-Mart’s stock to decline by the same percentage. Individuals who invest in companies like Apple and Amazon have to be able to take abrupt market gyrations in stride. Companies are essentially stories. Some like Apple and Amazon are stories of growth. There comes a time when the story changes, as it did for Microsoft and Cisco more than a decade ago. Apple’s story has been “under construction” in the past 18 months. Since the beginning of 2008, Wal-Mart’s stock has risen 56%, Apple’s is up 150%, and Amazon’s market price has soared more than 6 times. Growth companies offer rich rewards for the investor who has the time to follow the story, but it can be difficult to know when the story is changing.
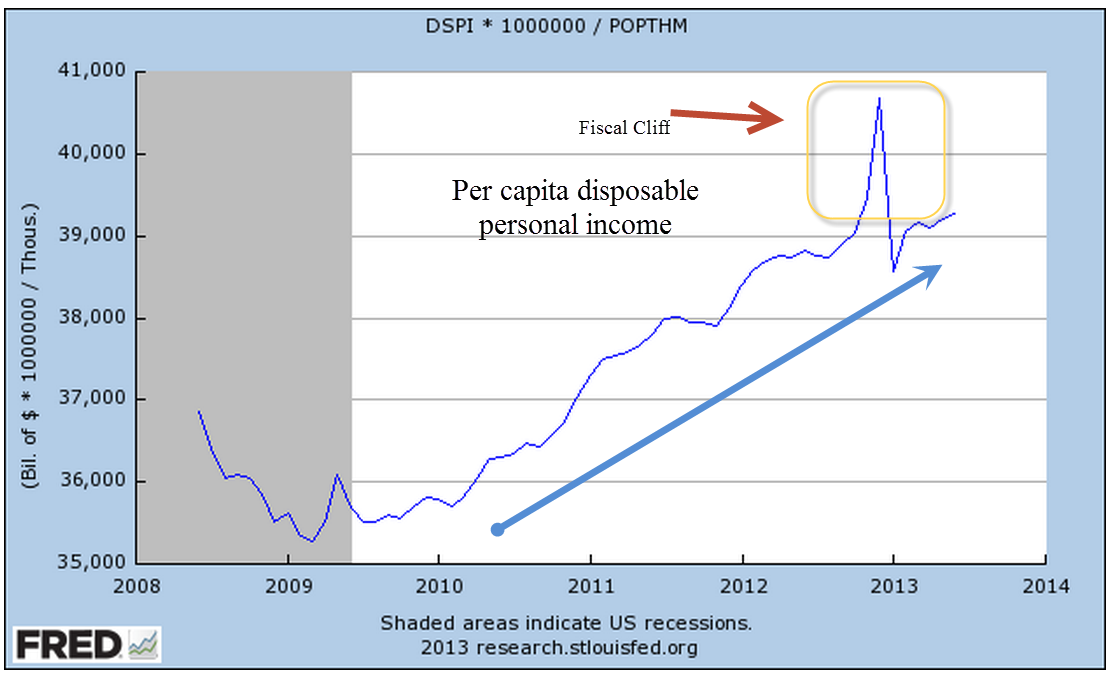
During the past 3 weeks, Home Depot has lost about 6% after gaining 35% since the beginning of 2013. This giant has one foot in the home construction and remodeling sectors, one foot in the retail sector. The decline reflects lowered near term expectations for both construction and retail. Consumer spending has risen steadily but incomes are flat.
*****************************************
December’s report of new homes sold was disappointing. After rising above an annual level of 450,000 in the fall, sales have fallen closer to the 400,000 mark.

Some blame the particularly harsh December in the east, some blame the weak labor report released in early January, others blame the low supply, still others blame rising mortgage rates. The Case Shiller home price index shows a year over year gain of almost 14% in metro area homes, indicating relatively healthy demand. However, the latest Consumer Confidence survey reports a decline in the number of people planning to buy a home. On an ominous note, pending home sales in December declined more than 8%, the worst monthly decline in almost four years. Without a doubt, the severe winter weather in the eastern U.S. was a big factor but it is difficult to assess how much of a change. This is the second report – employment was the first – that was far below even the lowest of estimates.
The link between employment and new home sales is counterintuitive; changes in new home sales anticipate changes in employment.
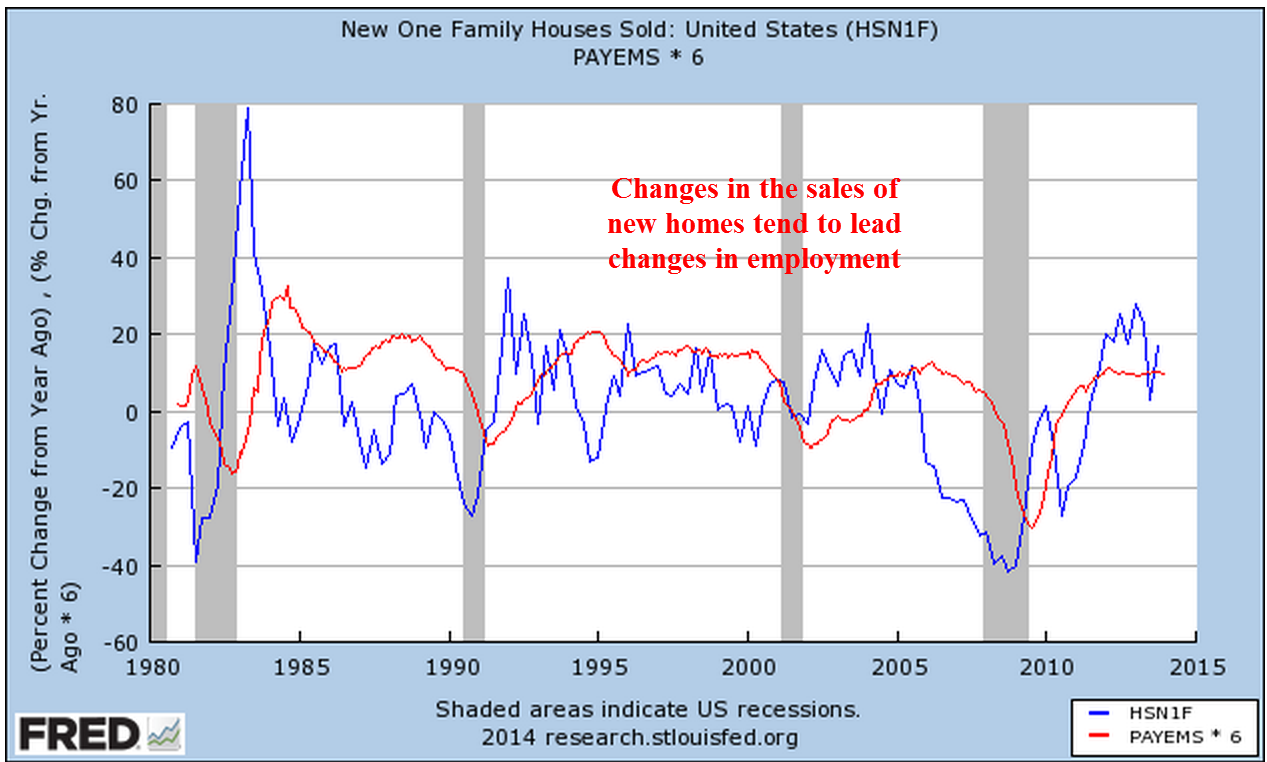
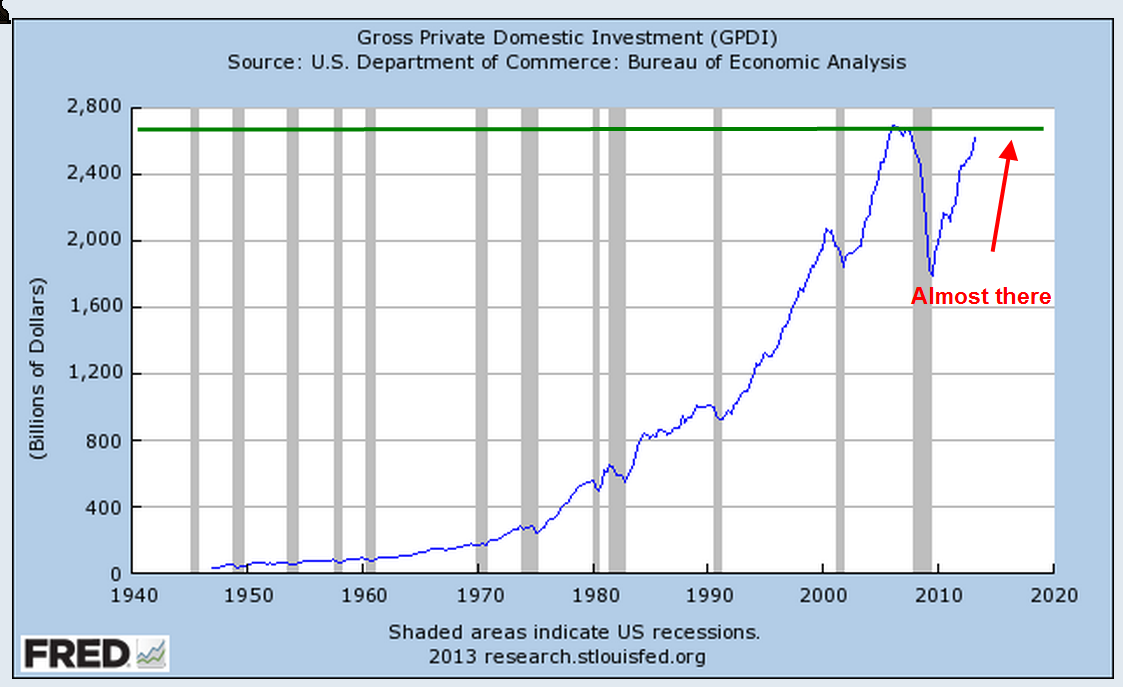
In a 2007 paper presented at a Federal Reserve conference, economist Ed Leamer demonstrated that changes in residential investment, a relatively small component of the economy, indicate coming recessions and recoveries. The National Assn of Homebuilders estimates that each new home generates a bit more than three full time jobs.
Residential investment includes new homes, remodels, furniture and appliances. Eventually residential investment reaches a point where it is contributing too much to the economy. As that percentage begins to correct to more normal levels, the contraction tugs on the total of economic growth.

As you can see in the chart above, a sustainable “sweet spot” is in the 4 to 4-1/2% of GDP range but residential investment is still less than 3% of GDP. In past recessions, residential investment has helped recovery. This time is different. Housing’s less than normal contribution to the nation’s GDP has dampened overall growth.
*****************************************
The first estimate of GDP growth for the fourth quarter was a rather remarkable 3.1%. Although this was in line with estimates, I was concerned that the severe winter weather in the east might have more of a negative impact. A version of GDP that reflects domestic consumption, Final Sales of Domestic Product, showed a modest 2.1% growth in the 4th quarter, reflecting the impact of the weather, I think. The third quarter growth rate was revised to 4.1%, up substantially from the initial estimate of 2.8%. The hope is that this is now a 4% growth economy and the first quarter of this year may hold some welcome surprises as delayed economic activity in the 4th quarter is rolled into this year’s first quarter. As I noted a few weeks ago, the wave like trend of the CWI composite index of manufacturing and non-manufacturing indicated a slight lull in these winter months before another peak in early to mid-spring.
****************************************
Consumer Confidence rose to 80, the lower bound of what I consider healthy. This index fell below 80 in the early part of 2008 and did not get above that mark till this past summer, then fell back in the fall. A separate Consumer Sentiment survey from the U. of Michigan showed a similar reading at slightly above 81.
*****************************************
January’s monthly employment numbers will be released next Friday. I ran a chart of those not in the labor force as a percent of those working. Thirty years ago, the economy was coming out of the most severe employment recession since the Depression. It is rather disturbing that this ratio continues to climb to the nose bleed levels of that recession thirty years ago.

******************************************
The harsh winter weather may be affecting consumers more than businesses. Chicago and the upper Midwest region got creamed with cold snap after cold snap in December yet industrial production figures for the month are still robust, declining somewhat from the incredibly strong readings of the past few months.